


 0.2
0.2How well do we know the global picture, the ``geography'' of large-scale structure? At the very basic level, any theory of large-scale structure and galaxy formation must be able to reproduce the visual appearance of the large-scale galaxy distribution. For this reason the first result of a redshift survey is essentially a map of the galaxy distribution in space. More than for the sometimes complicated statistical analyses that can be computed from them, these maps are what redshift surveys become usually famous for (many of us certainly remember the Coma region ``homunculus'' of the first CfA2 slice [11]). For this reason and possibly because this responds to the need of human beings to ``see'' where they stand within the Universe, we like so much to produce ``cone'' or ``wedge'' diagrams: something that was just a picture over the sky vault, for the first time is seen in its almost real spatial distribution thanks to the newly measured distances. Such a feeling has probably something in common with that of ancient explorers, when they discovered a new piece of territory not previously marked on the maps.
2.1. From 2D Photometric Galaxy Catalogues to Redshift Surveys
However, there is at least one major difference to this romantic view. In fact, when we start a redshift survey, we inevitably have to know in advance that a galaxy is there, with its right ascension, declination and apparent magnitude or flux in some band of the electromagnetic spectrum. A necessary prerequisite for any redshift survey is, in other words, the availability of a photometric catalogue, from which an apparent-magnitude (or flux) limited sample can be extracted. This introduces an unavoidable prejudicial selection effect that determines how our survey will trace the large-scale distribution of matter. In this paper, we shall come back several times to this concept, which is becoming more and more important now that large redshift surveys are starting to explore depths to which the issues of galaxy evolution can no longer be reasonably ignored.
The CfA1
[12],
CfA2 [2] and
Perseus-Pisces
[3]
redshift surveys,
for example, were all possible in their era because Fritz Zwicky
and collaborators had previously
constructed a catalogue of galaxy positions and magnitudes
down to a photographic magnitude mph
 15.7 over the whole
Northern hemisphere
[13].
When, for example, the Southern Sky Redshift Survey (SSRS, to
mB 14.5 and SSRS2,
to mB 15.5,
see [9]) -
which aimed at being the southern equivalent of the
CfA survey - was started, a major difficulty involved the
construction of a ``quasi-Zwicky'' magnitude-limited sample
homogeneous to the northern one from the catalogues available in the
South (essentially the ESO-Uppsala diameter-limited catalogue,
[14])
(2) .
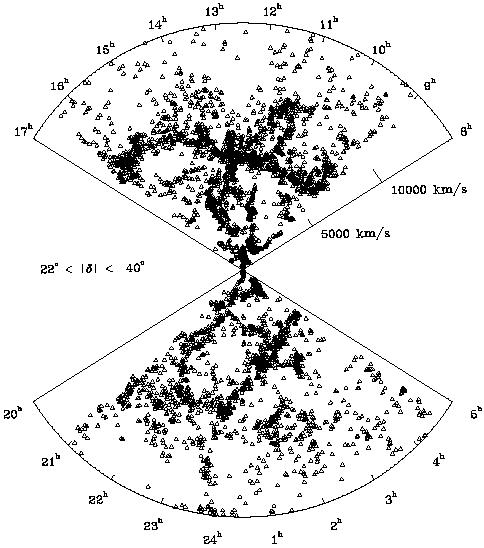
The matching of the two surveys (CfA2 and SSRS2), produced a
sample of more than 15,000 galaxies with measured redshift which still is the
most representative description of the details of the large-scale
distribution of bright galaxies within the local
r ~ 100 h-1 Mpc volume. This can be
appreciated from the cone
diagram of Figure 1, where a 18° slice
through these combined data is reproduced from
[9].
15.7 over the whole
Northern hemisphere
[13].
When, for example, the Southern Sky Redshift Survey (SSRS, to
mB 14.5 and SSRS2,
to mB 15.5,
see [9]) -
which aimed at being the southern equivalent of the
CfA survey - was started, a major difficulty involved the
construction of a ``quasi-Zwicky'' magnitude-limited sample
homogeneous to the northern one from the catalogues available in the
South (essentially the ESO-Uppsala diameter-limited catalogue,
[14])
(2) .
The matching of the two surveys (CfA2 and SSRS2), produced a
sample of more than 15,000 galaxies with measured redshift which still is the
most representative description of the details of the large-scale
distribution of bright galaxies within the local
r ~ 100 h-1 Mpc volume. This can be
appreciated from the cone
diagram of Figure 1, where a 18° slice
through these combined data is reproduced from
[9].
|
Figure 1. Composite cone diagram showing the distribution of galaxies with mB < 15.5 in a 18° degree thick slice from the combined CfA2 and SSRS2 redshift surveys (from [9]). The structure spanning the whole aperture of the Northern cone is the famous Great Wall. |
The cosmological importance of large, homogeneously-selected photometric catalogues of galaxies was certainly first appreciated (or at least first translated into a concrete effort), by the British astronomical community (3) . At the end of the eighties two different groups in the UK started independently to scan, analyse and calibrate through dedicated CCD photometry the IIIa-J plates of the UK-Schmidt survey. The two projects used the Automated Plate Measuring (APM) Machine in Cambridge and the COSMOS machine in Edinburgh, respectively, and their final products are represented by the well-known APM galaxy catalogue [16] and Edinburgh-Durham Southern Galaxy Catalogue (EDSGC), [17]. The realization of a similar catalogue in the Northern hemisphere has not been possible till the present, due to the lower depth of the Palomar survey plates, but is now becoming a reality with the completion and analysis of the deeper POSSII survey [18].
The APM catalogue covers 1.3 sr in the Southern hemisphere (185 Schmidt
plates), while the EDSGC is limited to the 60 Schmidt plates around the South
Galactic Pole. Both catalogues
are complete to bJ
20.5, i.e. about 5 magnitudes
deeper than the
Zwicky catalogue (whose photometric band is not too dissimilar to
the bJ), and still represent excellent and not yet
exploited databases for fairly deep, wide-area redshift surveys.
Not only are 2D galaxy catalogues fully important as source lists
for redshift surveys, but they also bear significant statistical
information on large-scale structure studies per se.
One important example of the results obtained directly from the two
digitised catalogues discussed above is the angular correlation
function w( )
[16,
19].
These measures were
largely responsible for killing the once fashionable standard CDM
model (where by ``standard'' one meant
)
[16,
19].
These measures were
largely responsible for killing the once fashionable standard CDM
model (where by ``standard'' one meant
 = 1, H0 = 50
km s-1 Mpc-1, and a bias parameter b = 2.5
[20] - see
Section 3.2 for definitions -).
First redshift surveys based on the two catalogues started relatively early,
in particular sparsely sampled surveys, which represented a compromise
between the wish to exploit the large areas available and the amount of
telescope time needed to cover them spectroscopically.
This is the case of the Stromlo-APM survey
and the Durham-UKST survey, from which scientific
results have been produced until very recently.
= 1, H0 = 50
km s-1 Mpc-1, and a bias parameter b = 2.5
[20] - see
Section 3.2 for definitions -).
First redshift surveys based on the two catalogues started relatively early,
in particular sparsely sampled surveys, which represented a compromise
between the wish to exploit the large areas available and the amount of
telescope time needed to cover them spectroscopically.
This is the case of the Stromlo-APM survey
and the Durham-UKST survey, from which scientific
results have been produced until very recently.
The Stromlo-APM survey includes 1797 redshifts, for galaxies selected
- one out of every twenty - over the whole APM catalogue down to
bj = 17.15, observed using traditional
single-slit spectroscopy (see e.g.
[21]).
The Durham-UKST survey instead, measured redshifts for~ 2500 galaxies,
selecting one in three objects with magnitude brighter than
bj 17 from
the smaller area of the EDSGC (see e.g.
[80]).
This survey was constructed using FLAIR at the UK Schmidt
Telescope, which is a fibre optic system capable of collecting the
light of ~ 50 galaxies over the area of a Schmidt plate and
bringing it into the slit of a conventional spectrograph standing on
the dome floor
[22].
2.2. The Era of Multi-Object Spectroscopy
Indeed, one very specific aspect that made these 2D catalogues particularly attractive for redshift surveys, was the parallel development of fibre-optic spectrographs, capable of observing several tens of galaxy spectra over typical areas of half a degree in diameter. The first successful examples of these instruments were mounted at the Cassegrain focus of 4 m class telescopes: following the pioneering work of the eighties (see [23] for a review), relevant examples at the time were FOCAP and then AUTOFIB at the Anglo-Australian Telescope, and OPTOPUS at the ESO 3.6 m telescope [24]. The density of fibres on the sky provided by these instruments corresponded to around 100-200 deg-2. These figures are matched by the average number counts of galaxies on the sky for blue limiting magnitudes ~ 19 - 19.5, i.e. well within the limits of the EDSGC and APM catalogues.
This reasoning was at the origin of the ESO Slice Project (ESP) redshift survey, which used the ESO Optopus fibre coupler to observe all objects in the EDSGC down to bJ = 19.4 within a thin strip of ~ 1° × 26°, constructing an 85% redshift-complete sample of 3348 galaxies. The step forward in depth was gigantic, with respect to the Zwicky-based surveys, nearly 4 magnitudes, which lead to an effective survey depth (4) corresponding to a luminosity distance of ~ 600 h-1 Mpc. A pictorial view of the large-scale distribution of galaxies in the ESP is shown in the cone diagram of Figure 2. The survey and the main results obtained from its analyses have been largely discussed in a series of papers [26, 27, 28, 29, 30, 31, 32]. I shall summarise the main results obtained on galaxy clustering in the ESP survey in Section 5.

|
Figure 2. The distribution of galaxies within the 1-degree slice of the ESP survey (the gap around 23h corresponds to a region that was not observed). |
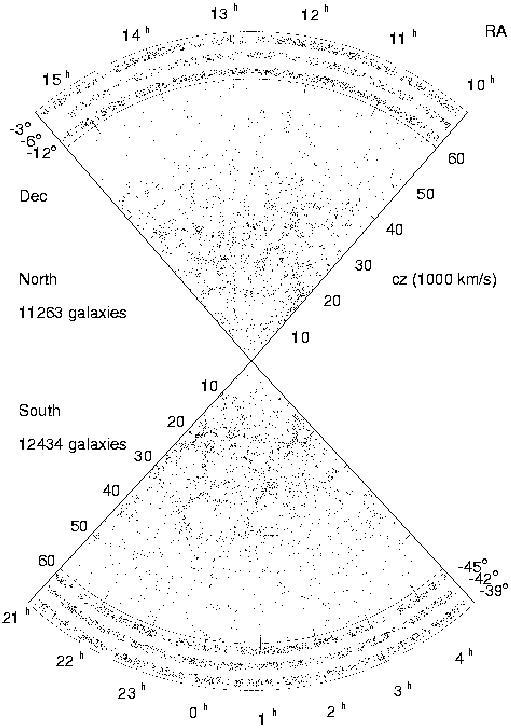
Also based on intensive use of a multi-object fibre spectrograph, is the largest redshift survey completed to date, i.e. the Las Campanas Redshift Survey (LCRS [33]), which represents the best existing compromise between depth and angular aperture. This redshift catalogue is slightly less deep than the ESP (r < 17.7, roughly corresponding to bJ ~ 18.8 for a typical mean galaxy colour), but covers six slices of ~ 80° × 1.5°, for a total of ~ 26, 000 redshifts. Unlike most of the aforementioned surveys, the photometric parent sample for the LCRS was constructed anew from a specifically performed CCD drift-scan survey in the r band.
One peculiarity of the LCRS is that the selection of the target galaxies was subject not only to a cut in apparent magnitude, but also to a selection in surface brightness within the aperture of the used fibres. It is now clear (Dalcanton, private comm.), that this selection favours bulge-dominated galaxies, preferentially excluding the irregular galaxies that represent the main population at faint luminosities. This has a clear effect on the galaxy luminosity function as measured from the LCRS, showing up in an abnormally flat faint end [34], (see [27] for comparison to other surveys). On the other hand, the global clustering properties do not seem to be significantly affected by this selection, as judged from the comparison of its two-point correlation function with those of the ESP and Stromlo-APM surveys ([32], see also Figure 9 hereafter). The double cone diagram showing the large-scale distribution of galaxies in the six LCRS slices is reproduced in Figure 3.
|
Figure 3. The famous double-cone diagram from the Las Campanas Redshift Survey. Both cones show galaxies projected from three adjacent RA slices of 1.5° each [33]. |
The advantages of multi-object fibre spectroscopy have been
pushed to the extreme with the construction of the 2-degree-Field (2dF)
spectrograph for the prime focus of the Anglo-Australian Telescope
[35].
This instrument is able to accommodate 400 automatically
positioned fibres over a 2-degree-diameter field. This implies
a density of fibres on the sky of ~ 130 deg-2, and an optimal
match to the galaxy counts for a magnitude similar to that of
the ESP survey, bJ
19.5. The striking difference is that
with such an area yield, a number of redshifts as in the ESP survey
(although not distributed over a strip) can be collected in~ 10
exposures, i.e. slightly more than one night of telescope time with typical 1
hour exposures! It was rather natural, therefore, that a large
redshift survey based on the 2dF spectrograph were proposed by a
UK-Australian team. This survey is now known as the 2dF galaxy redshift
survey, and is based on the APM catalogue, giving us one
further example of how importance of such large
photometric catalogues. Its goal is to measure redshifts for more
than 250,000 galaxies with bJ
19.5. About 4/5 of these lay
within two large areas, 75° × 12.5° and
65° × 7.5° within the South and North Galactic Caps
respectively, which are being fully covered with a honeycomb of 2dF
fields. Another 40000 redshifts will be measured within 100
fields randomly distributed over the APM area, with the goal of
maximising the signal in the power spectrum estimate on very large
scales [36].
In addition, a faint redshift survey of
10,000 galaxies brighter than R = 21 will be performed over selected
fields within the two main strips. The survey is steadily collecting
redshifts, and first results on the luminosity function for different
morphological types (defined through their spectral properties), have
been recently presented
[37].
From the cone diagram of
Figure 4, we can have a visual impression of the
status of the
survey as of March 1999, with a total of 41585 redshifts measured,
(note that the thickness of the slice is not uniform over the RA
range). With the eye trained by the
ESP and LCRS diagrams, one can easily see the structures taking shape
across the survey beams. More details can be found in
[38],
and [39].
See also the 2dF web page at
http://msowww.anu.edu.au/2dFGRS/,
where the diagram of Figure 4 is continuously updated.

|
Figure 4. The distribution of the 41585 galaxies observed so far (Mar ch 1999)in the 2dF survey: like light beams through a smoky room, the 2dF observations are steadily unveiling the details of large-scale structure, at a typical rate of~ 2000 redshifts per observing night. (Courtesy of the 2dF team). |
The most ambitious and comprehensive galaxy survey project currently in progress is without any doubt the Sloan Digital Sky Survey (SDSS). This massive effort is carried on by an American consortium with the participation of Japan. Aim of the project is first of all to observe photometrically the whole northern galactic cap, 30° away from the galactic plane (~ 104 deg2) in five bands, at limiting magnitudes, respectively of u' = 22.3, g' = 23.3, r' = 23.1, i' = 22.3 and z' = 20.8. The expectations are to detect ~ 5 × 10⁷ galaxies and ~ 108 star-like sources among which a subset of 106 AGN candidates can be selected by colour techniques. This has already led, based on the first few hundred deg2 covered since first light (May 1998), to the discovery of several high-redshift (z > 4) quasars, including the highest-redshift quasar known, at z = 5.0 [40]. Using two fibre spectrographs carrying 320 fibres each, the spectroscopic part of the survey will then collect spectra for about 106 galaxies with r' < 18 and 105 AGN's with r' < 19. The spectrographs are still being commissioned at the telescope at the time of writing this paper (Spring 1999).
The capability to isolate photometrically sub-classes of objects
through their colours will be exploited also by selecting a sample of
about 105 ``red'' luminous galaxies with
r' < 19.5. These will be observed spectroscopically
providing a
nearly volume-limited sample of early-type galaxies with a
median redshift
z 0.5, that will be
extremely valuable to study the
evolution of clustering. In Figure 5, using a numerical
simulation, the expected power spectrum
of the whole SDSS spectroscopic galaxy survey (bottom line)
is compared to that corresponding to the subsample of red luminous galaxies
[41].
Note the gain in the clustering signal around the turnover in the power
spectrum (5) .

|
Figure 5. Expected
1 |
It is clear from this short description how the goals of the SDSS are well beyond the pure realisation of a redshift survey for just studying large-scale structure. Indeed, in addition to the immediate scientific results that will be produced by the survey team, it will build an unparalleled photometric and spectroscopic data base whose impact on the scientific community will last for several years. Further details can be found in [42], with a more recent update as of fall 1998, in [41]. See also the SDSS web site at http://www.sdss.org/, where the latest news on the ongoing survey can be found.
2 In a similar fashion, the first attempt to extend the CfA2 survey to fainter magnitudes (r = 16.1), with the 1-degree ``Century Survey'' [15], required the scanning and calibration of red POSS-E plates to build the parent photometric catalogue. Back.
3 In fact, at the same time considerable effort was spent in a similar direction by the Münster group in Germany. This was limited to a smaller area, and used objective-prism plates to measure very low-resolution redshifts for nearly a million galaxies [10]. Back.
4 The survey depth is defined as the maximum distance to which a galaxy of magnitude M*, i.e. the characteristic magnitude in the Schechter form [25] for the luminosity function, is detected within the survey. Back.
5 We shall define and discuss in more detail the power spectrum of clustering in Section 5.3. Back.
 accuracy in the galaxy power
spectrum measured from
the SDSS data. The solid lines give the (input) power spectrum. The bottom
curve is for the 900,000 galaxies expected in the main survey volume to
r' < 18, while the top curve is for the deeper
subset of 100,000 red luminous galaxies with r' <
19.5 (Loveday 1998).
accuracy in the galaxy power
spectrum measured from
the SDSS data. The solid lines give the (input) power spectrum. The bottom
curve is for the 900,000 galaxies expected in the main survey volume to
r' < 18, while the top curve is for the deeper
subset of 100,000 red luminous galaxies with r' <
19.5 (Loveday 1998).