


3.1. Morphology
3.1.1. Optical and infrared morphology
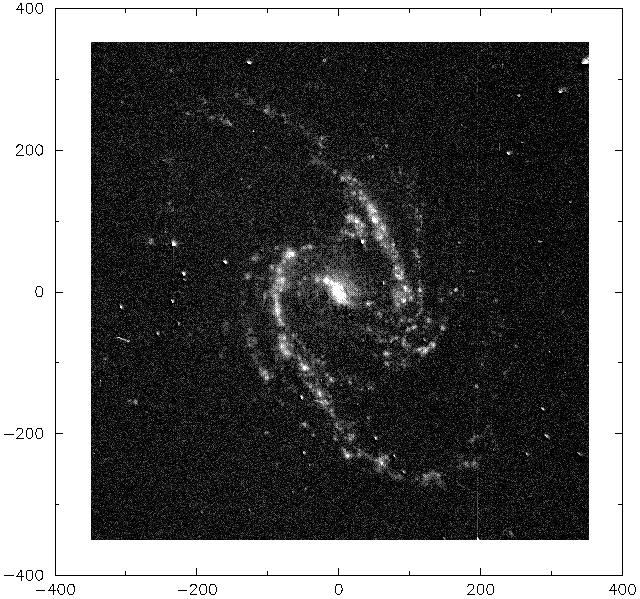
The striking impression given by the optical picture of NGC 1365 (Fig. 1) is due to the strong bar and the regular and symmetric main spiral arms extending from the ends of the bar. From kinematical data Jörsäter and van Moorsel (1995) determined the position angle of the line of nodes to be PA = 220° and the inclination angle between the plane of the galaxy and the plane of the sky to be i = 40°. In accordance with numerous dynamical simulations of spiral galaxies (Sections 3.3 and 3.4) we will assume that the spiral arms are trailing in the rotation of the galaxy. Then, as the NE side of the galaxy is approaching (Fig. 10), the NW side is the near one.
Fig. 3 is a colour picture, based on three exposures in the B, V and R bands obtained with the Unit Telescope 1 (UT1) of the ESO Very Large Telescope (VLT). This figure illustrates the contrast between the young blue stellar population in the arms and the older (yellow) in the bar. In addition, a yellow bulge or lens, engulfing the nuclear region, can be seen elongated by projection effects in the direction of the line of nodes.
The main spiral arms are outlined by numerous star-forming H II
regions. This is well seen in the image of the galaxy obtained in the
H line, emitted from regions of
ionized hydrogen (Fig. 4).
line, emitted from regions of
ionized hydrogen (Fig. 4).
|
Figure 4. Continuum subtracted
H |
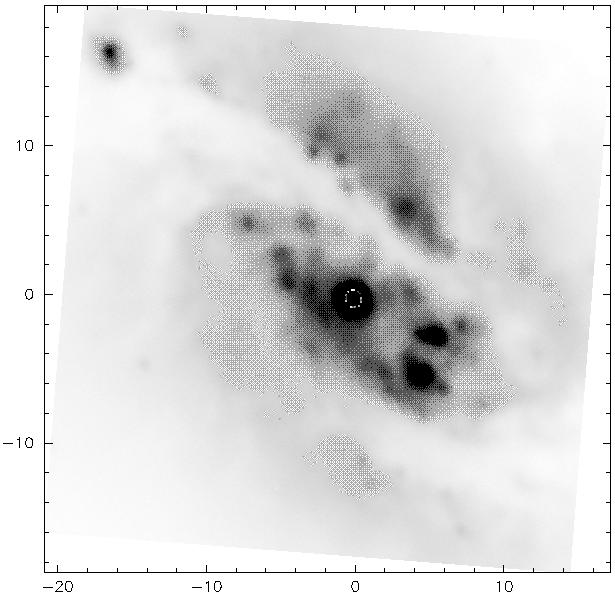
Apart from the gross features the optical picture of NGC 1365 offers many interesting details that call for interpretation and explanation. Dark dust lanes follow the spiral arms, preferably on their inner side, out to some distance from the bar. Particularly strong dust lanes run along the front side of the bar. These dust lanes extend all the way into the nuclear region and to some degree obscure the nucleus (Fig. 5; see also the B - Gunn z colour index image published by Sandqvist et al. 1988).
|
Figure 5. The nuclear region of NGC 1365 obtained in the R-band with the SUSI detector at the ESO New Technology Telescope (NTT). Courtesy M. Tarenghi. |
From these dust lanes narrow wisps of dust extend across the bar, and the whole central body of the galaxy out to some 2' (~ 10 kpc) from the nucleus is interwoven with an intricate system of dark and bright wisps. Bright H II regions are seen along the leading edge of the dust lanes in the bar (primarily on the eastern side) as well as along the spiral arms (Fig. 4).
Secondary arms are seen outside the main spiral arms on both sides. Nevertheless, the outer edge of the optical galaxy is rather well defined at a radius, in the plane of the galaxy, of about 350" or 32 kpc. Close to the edge, the main arms seem to break up and give the impression of `falling back' into the outer arms on the opposite side.
As seen in Fig. 5, the circumnuclear region
abounds with multiple bright condensations that we, following
Morgan (1958),
will call `hot spots'. They are bright in
H and should therefore
be the seat of powerful star formation. Sérsic and Pastoriza
(Sérsic 1968)
concluded that a clear relation exists between the
existence of a bar and the presence of hot spot nuclei. The true nature
of these hot spots, as revealed by the HST, will be discussed in
Section 4.6.
As part of the Ohio-State University Bright Galaxy Imaging Survey,
Frogel and Quillen (priv. comm.) have obtained a mosaic image of
NGC 1365 in the J-band, corresponding to a
wavelength of 1.25 µm
(Fig. 6). The spiral arms seen in this image
correspond to the inner part of the
main optical arms in Fig. 1. This
image was analysed by
P.A.B. Lindblad et
al. (1996)
in terms of bi-symmetrical surface
density Fourier components (see Section 3.4).
It was found
that the surface density of the axisymmetric component closely follows
a power law  0(R) ~
R, where
= -1.35 over
the entire bar region. Curiously enough, the same relation with the
same value of was found to
hold in the Gunn i band for the
barred galaxy NGC 1300
(P.A.B. Lindblad &
Kristen 1996).
0(R) ~
R, where
= -1.35 over
the entire bar region. Curiously enough, the same relation with the
same value of was found to
hold in the Gunn i band for the
barred galaxy NGC 1300
(P.A.B. Lindblad &
Kristen 1996).
|
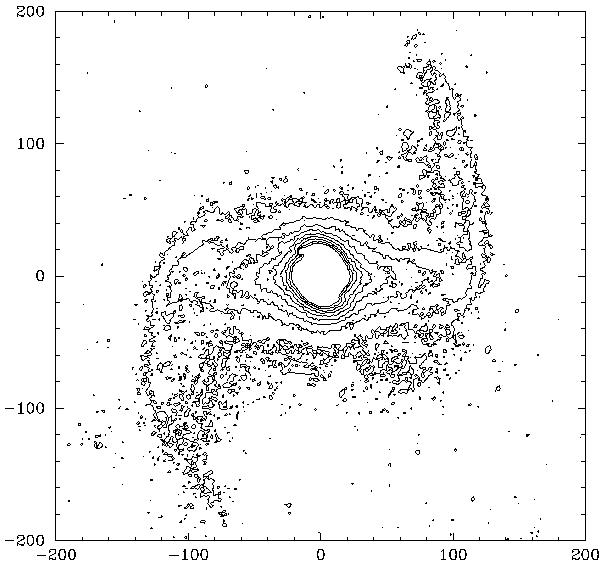
Figure 6. Inclination corrected J-band image of NGC 1365. Courtesy J.A. Frogel and A.C. Quillen (P.A.B. Lindblad et al. 1996). |
A Fourier analysis of the bar shape was also made by Regan and Elmegreen (1997) from a K-band (2.2 µm) image of the galaxy.
H-band (1.6 µm) isophotes for the nuclear region have been published by Jungwiert et al. (1997). They identify a nuclear bar with maximum ellipticity 8" from the nucleus. This feature can also be seen in the K-band image by Regan and Elmegreen and in the colour frame of Fig. 3. We note that the PA of this feature coincides closely with that of the line of nodes and that the ellipticity is similar to that expected from projection of a circular ring in the plane of the galaxy. Thus, it might represent a nuclear bulge or lens with a radius of about 35" (~ 3 kpc) and its existence as an actual bar still has to be confirmed.
Telesco et al. (1993) have published a 10.8 µm isophotal map of the central region. The map reveals a bright infrared peak, that seems to be displaced 2" West of the optical nucleus (towards the dark absorbing lane), and another infrared source one-third as bright as the nucleus and displaced from this by about 7" to the NW.
Moorwood et al. (1998) have recently published a combined Ks (2.16 µm) and L 3.8 µm) image of the central region of the galaxy obtained with the ISAAC cryogenic infrared spectrometer and array camera at the VLT. We will return to a discussion of this image in Section 4.6.
The nuclear region was measured by Frogel et al. (1982) in a number of intermediate bandwidth filters between 8 and 13 µm. They found an absorption feature centered near 9.6 µm attributed to silicate particles, confirming the presence of significant amounts of dust.
NGC 1365 is a moderately strong infrared source as
observed with the
Infrared Astronomical Satellite (IRAS) in four wavelength bands. The
total flux densities, measured from co-added maps and expressed in
Janskys (10-26 W m-2 Hz-1), are given in
Table 2
(Rice et al. 1988).
The total far-infrared flux
between 42.5 and 122.5 µm, as estimated by Rice et al., is
FIR = 5.07 x 10⁻¹² W m-2, which
gives a far-infrared
luminosity L(FIR) = 5.4 x 10¹⁰
L .
.
 | Jy |
| 12 µm | 4.42 |
| 25 µm | 13.07 |
| 60 µm | 84.20 |
| 100 µm | 185.40 |