


3.4. Computer Simulations
In the first half of the 1950s, when the forefathers of our modern computers were developed, numerical N-body computations of the evolution of self-gravitating configurations in a galactic potential were begun. Over the following decades the computer codes as well as the computers developed drastically. Due to clever schemes in computing the self-gravitating potential as well as vastly increased speed and memory space of the computers, the number of particles in N-body simulations could be increased by many orders of magnitude. As time went on, more and more sophisticated hydrodynamic codes were also developed to simulate the dynamics of the interstellar medium in galaxies.
To model the interstellar medium in a realistic way is somewhat problematic. Most of the mass is concentrated in cool clouds immersed in a more extended hot gas of low density. The cool clouds may take any shape from cirrus-like to giant molecular clouds, or dense concentrations forming stars only to be dispersed due to the activities of the stars formed. The clouds may not even keep their identity for any extended time.
Some codes treat the collection of cool clouds as a fluid with a sound speed of the same order as the velocity dispersion of the clouds (e.g. Cowie 1980). An alternative view is to treat the cool medium as a number of ballistic, unelastically colliding particles (e.g. Combes & Gerin 1985). Combinations of these two approaches are also used (e.g. Friedli & Benz 1993).
Athanassoula (1992) made a systematic study of gas flow in and around model bars of barred galaxies using a hydrodynamic flux-splitting second-order scheme FS2 (van Albada et al. 1982). In particular, she investigated how the parameters defining the bar and disk potentials influence the existence and shapes of dust lanes along the bar. She finds that the existence of shocks, offset from the bar major axis towards its leading side and with curvatures as observed, requires two ILRs that are not too tightly spaced and that the Lagrangian radius (i.e. corotation distance) has to lie in the interval (1.2 ± 0.2) Rbar, where Rbar is the length of the bar semimajor axis. Along these shocks strong shear opposes star formation.
Numerical hydrodynamic simulations of NGC 1365 were performed by P.A.B. Lindblad (P.A.B. Lindblad 1996; P.A.B. Lindblad et al. 1996). The idea behind those simulations was to rely as far as possible on observed properties of the galaxy when deciding on the input gravitational potential and then, varying ingoing parameters, strive to reproduce the observed morphology and velocity field of the interstellar matter as closely as possible via equations of motion ruled by this gravitational potential and by hydrodynamic forces. The goal was, in the first place, to see if this was at all possible, and if so, to derive values for various free parameters. Among the most important of these are the pattern speed and the shape of the true rotation curve, corresponding to the axisymmetric component of the potential, because they will permit us to identify resonance positions and to draw conclusions about the effects of these resonances on the gas kinematics and the morphology. A fluid hydrodynamic code was adopted where the continuity and momentum equations were solved by the numerical scheme FS2.
The axisymmetric component of the gravitational potential was derived in successive approximations as described below, starting from the observed apparent rotation curve given by Jörsäter and van Moorsel (1995). The shape of the `perturbing' non-axisymmetric component of the potential, due to the bar and spiral arms, was derived from the near infrared J-band image obtained by Frogel and Quillen, shown in Fig. 6, and this component was scaled to fit the axisymmetric component.
The observed properties to be reproduced by the numerical simulations were the gas distribution as given by the H I observations of Jörsäter and van Moorsel (1995) and by the CO line emission from Sandqvist et al. (1995), the gas velocity field as given by Jörsäter and van Moorsel and the actual emission line velocities (not the smoothed field), representing the disk, along the slits as compiled by P.O. Lindblad et al. (1996a), and finally the shapes and positions of the dark dust lanes along the bar.
In principle, the axisymmetric component of the potential in the symmetry plane of a galaxy is given by the rotation curve, defined as the run of circular velocities as a function of distance from the centre. A fundamental difficulty is that in the presence of a strong perturbing potential, as in the bar region, no even nearly circular orbits exist. In the presence of large systematic deviations from circular velocities, azimuthally averaged tangential velocity components will not be a good measure of the underlying axisymmetric potential. Thus, in the present case, the apparent rotation curve of Jörsäter and van Moorsel was taken as basis for the model input rotation curve outside R = 120" (11 kpc). Thereafter, the numerical values describing the inner part of the model true rotation curve, as well as the pattern velocity, were varied in a number of simulations, which included the perturbation from the bar, until the observed velocities in the inner regions and the positions of the dust lanes along the bar were reproduced. The resulting rotation curve is shown in Fig. 13. A crucial item in this procedure is the existence and position of the ILR.

|
Figure 13. The rotation curve for NGC 1365 (thick solid line) and the corresponding angular velocity for a particle in circular orbit (thin solid line). Also are shown the angular pattern velocities for closed orbits with two-fold (dashed), four-fold (dots), and six-fold (dash-dots) symmetries. The positions of the main resonances are indicated as crossings with the straight horizontal line representing a pattern speed of 20 km s-1 kpc-1. From P.A.B. Lindblad et al. (1996). |
Models were tried either with only a bar giving the perturbing potential or both a bar and spiral arm potential, in both cases derived from the IR frame of Frogel and Quillen (Fig. 6). The results showed that the best fit to the observations was obtained by adding the weak spiral potential. In particular, only with this spiral component could the inner main arms be driven through co-rotation. This indicates that these spiral arms have a noticable mass. The best model fit in the simulations is shown as overlay of the model gas density on the total H I map in Fig. 14. In order for the outer arms to extend to the edge of the disk the outermost part of the rotation curve of Jörsäter and van Moorsel (1995) was raised slightly, meaning that the warp found by them was slightly modified.
The main features of the gas distribution given by the H I map are well reproduced by the simulations. The fit is always limited by the fact that the model, due to the computing scheme, is strictly bi-symmetric while the actual galaxy is not. The model also agrees with the total hydrogen map in the relative strength of the two pairs of main outer spiral arms. The central concentration of interstellar gas as shown by the CO observations of Sandqvist et al. (1995) is also reproduced and caused by steady inflow of matter towards the centre.

|
Figure 14. The density contour map of one of the best fit models overlaid on the total H I column density map. The rotation curve of Fig. 13 has been slightly modified. From P.A.B. Lindblad et al. (1996). |
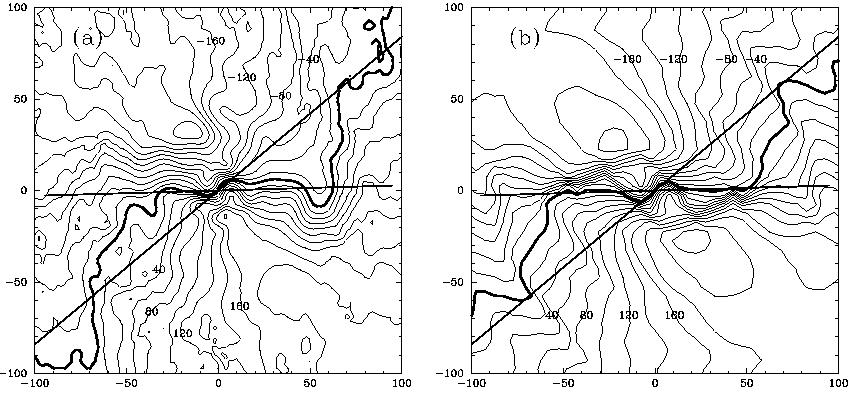
The model velocity field is compared with the observed field in Fig. 15. As can be seen the observed field is rather well represented by the model, in particular the twisted features representing non-circular motions caused by the perturbing action of the bar and the associated resonances. As pointed out above, the observed velocity field has been smoothed in the procedure and the sharp velocity gradients along the bar in the model velocity field are more representative of the actual gradients observed along the slits in the optical spectra.
|
Figure 15. Comparison between the observed velocity field in NGC 1365 (a) and that given by the model (b). The orientations of the bar axis in PA 92° and the minor axis of the galaxy in PA 130° are shown as straight lines. From P.A.B. Lindblad et al. (1996). |
The information given by these simulations may be summarized as follows:
ILR at R  30" (2.7 kpc)
0.25 Rbar
30" (2.7 kpc)
0.25 Rbar
Corotation at R 160"
(14 kpc) 1.31
Rbar
OLR at R 240" (22 kpc)
2.0 Rbar
The position of the corotation agrees with the condition Rcorot = (1.2 ± 0.2) Rbar derived by Athanassoula for barred spirals in general.
With reference to the possibility suggested by Sellwood and Sparke (1988), mentioned in Section 3.3, that the pattern speed of the spiral arms could be lower than that of the bar in this galaxy, a few remarks are in place. In the simulations reported here the gas is not self-gravitating and a self-supporting spiral density wave could not develop. The spiral potential derived from the J-band image, and introduced in order to drive the spiral arms through co-rotation, is kept fixed relative to the bar throughout the computations. The simulations therefore do not rule out the simultaneous existence of different pattern velocities.
Where the main optical spiral arms cross the minor axis of the galaxy the observations show the radial velocities to be directed inwards. The classical picture of density wave streaming in trailing spiral arms then requires corotation for the spiral arms to fall outside this crossing point. With corotation at R = 1.31 Rbar this condition is now fulfilled for the bar pattern velocity while it would not be for corotation at the end of the bar as assumed by Sellwood and Sparke. Further, the attachement of the spiral arms to the bar in the J-band image (Fig. 6) gives a definite impression that those arms are driven by the bar and keep the same pattern speed. Thus, the simulations show that there is no need to introduce the concept of different pattern velocities for bar and spiral arms in the galaxy NGC 1365. In this case the bar is strong. It may well be possible that in the case of a weaker bar a self-sustained spiral structure can be found with a pattern speed differing from that of the bar.
The ends of the outer arms, that both in the optical and H I images bend inwards towards the symmetric arm on the other side, are not traced in the simulations. Particularly at the eastern side one may get the impression from the optical picture that at the edge of the disk they split up into material arms which, due to the deceleration caused by the symmetric arm on the other side, fall inwards and even shoot forward before joining this arm.
The asymmetric extension to the north of the western outer edge seen in the H I cannot be reproduced in the simulations. There may be a possibility that this extension has something to do with the fuzzy little satellite that appears 500" NW from the centre.
 yr-1
occured. The question
naturally arises whether this inflow could possibly feed the active
nucleus residing in the centre of the galaxy - a problem that has been
studied by
Friedli & Benz (1993)
with numerical simulations. As pointed out also by
Sellwood and Wilkinson
(1993),
the angular momentum
must be further reduced by several orders of magnitude in order for the
gas to reach the central engine.
yr-1
occured. The question
naturally arises whether this inflow could possibly feed the active
nucleus residing in the centre of the galaxy - a problem that has been
studied by
Friedli & Benz (1993)
with numerical simulations. As pointed out also by
Sellwood and Wilkinson
(1993),
the angular momentum
must be further reduced by several orders of magnitude in order for the
gas to reach the central engine.