


4.3. High Excitation Outflow Cone
4.3.1. Line Splitting
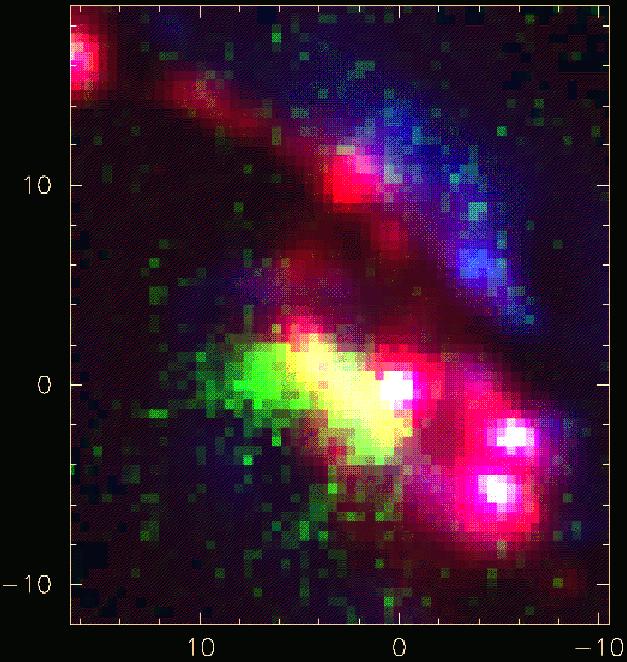
In Fig. 16 the nuclear region of
NGC 1365 was presented in
three different ways: a. continuum subtracted
H + [N II]
 6548,
6583, b. continuum
subtracted [O III]
5007, and c. broad
band Johnson B. These three
frames have been combined in Fig. 19 into a
colour picture of the nuclear region of NGC 1365, where
the blue component is derived from the Johnson B image, the green and
red from the narrow-band continuum-subtracted [OIII]
5007 and
H images respectively. There is
a clear difference in the
distributions of H and [O
III]. Both H and [O III] are
strong at the nucleus, while H
is dominating in the
circumnuclear hot spots and the H II regions along the northern edge
of the strong dust lane entering the nuclear region from the bar. The
[O III], on the other hand, shows a broad one-sided extension to the SE
from the nucleus centered roughly along the minor axis of the galaxy.
6548,
6583, b. continuum
subtracted [O III]
5007, and c. broad
band Johnson B. These three
frames have been combined in Fig. 19 into a
colour picture of the nuclear region of NGC 1365, where
the blue component is derived from the Johnson B image, the green and
red from the narrow-band continuum-subtracted [OIII]
5007 and
H images respectively. There is
a clear difference in the
distributions of H and [O
III]. Both H and [O III] are
strong at the nucleus, while H
is dominating in the
circumnuclear hot spots and the H II regions along the northern edge
of the strong dust lane entering the nuclear region from the bar. The
[O III], on the other hand, shows a broad one-sided extension to the SE
from the nucleus centered roughly along the minor axis of the galaxy.
|
Figure 19. Combined colour picture of the
nuclear region of NGC 1365,
where blue colour represents continuum B-band, red
H |
As mentioned already in Section 3.2,
M.M. Phillips et
al. (1983)
pointed out this extension of the [O III]
emission and also discovered that the [O III] lines were split into two
components, where the stronger component gave a velocity field differing
from that of H . One
of possible models suggested by them implied
that the double lines represented high excitation gas streaming out from
the nucleus along the surface of a hollow cone aligned with the rotation
axis of the galaxy.
. One
of possible models suggested by them implied
that the double lines represented high excitation gas streaming out from
the nucleus along the surface of a hollow cone aligned with the rotation
axis of the galaxy.
Using a Boksenberg Image Photon Counting System on the ESO 3.6-m telescope,
Jörsäter et
al. (1984a)
confirmed the peculiar velocities
given by the [O III] lines and showed that the high excitation [Ne III]
3868 and He II
4686 also shared the peculiar
velocities. However, from the few spectra available they could not
propose a very plausible model.
With the TAURUS scanning Fabry-Perot interferometer on the
Anglo-Australian telescope,
Edmunds et al. (1988)
confirmed the
splitting of the [O III] 5007
line. They suggested that one of
the components shared the velocity field of the
H disk and that
the other represented bipolar outflow from the nuclear region directed
out from the galactic plane. From a number of slit spectra
Jörsäter and
Lindblad (1989)
mapped the two velocity fields in the nuclear region. Also
Storchi-Bergman and
Bonatto (1991)
mapped the nuclear [O III] distribution.
Considering that the NW side of the galaxy is the near one, the shape of the [O III] emission region as shown in Fig. 19 is suggestive of a cone-like structure with its apex at the nucleus and extending out of the plane being projected against the far side of the galaxy. The velocities connected with this structure then give an outward motion from the nucleus within this cone.
The splitting of the [O III] lines in the nuclear region of NGC 1365
is demonstrated in Fig. 20, where the
spectrograph slit has been placed over the hot spot L1
(Fig. 16) in a position angle of
332°, such that the right
side of Fig. 20 corresponds to the NW side of
the galaxy. The
negative velocities towards the NW and the positive towards SE, shared
by [O III] and H,
represent the disk velocity field, while the
velocity components, positive towards NW and negative towards SE, only
shown by [O III], represent the outflow cone.

|
Figure 20. Radial velocities along a slit passing over the hot spot L1 (see Fig. 16) with a position angle 332°. The distance scale has its zero point at L1 and is increasing in the direction PA = 332&176;. The zero point of velocity is +1630 km s-1. From P.O. Lindblad et al. (1996b). |
In the circumnuclear region two separate velocity fields are thus distinguished:
A comparison of Fig. 11 and Fig. 21 shows the obvious differences between the two fields.
High excitation emission regions, characterized by strong [O III] line radiation, and with asymmetric morphology are nowadays frequently observed around AGNs. The velocity fields of these emission regions often differ markedly from those of lower excitation regions. Their shapes sometimes suggest a cone or a double cone with its apex at the nucleus. Wilson and Tsvetanov (1994) present a list of 11 Seyfert galaxies with such ionization cones. It is generally believed that the ionizing radiation from the nucleus is confined to within this cone - in the frame of the unified picture - by an obscuring torus.
Analysis of the peculiar motions in such regions have generally led to the conclusion that they give evidence of outflow motion within the cone away from the active nucleus (e.g. Morris et al. 1985; Storchi-Bergman et al. 1992; Maiolino et al. 1994). If the cone has such an orientation and opening angle that it intersects with the main plane of the galaxy, it may however create what is called an extended narrow line region (ENLR), or more appropriately extended emission line region (EELR), confined to the plane, where the motions will agree with the motions of the galactic rotation (Unger et al. 1987).