


Our own Galaxy and the Sun were the first cosmic radio sources to be detected due the work of K. Jansky, G. Reber, G. Southworth, and J. Hey in the 1930s and 1940s. Several other regions in the sky had been found to emit strong discrete radio emission, but in these early days the angular resolution of radio telescopes was far too poor to uniquely identify the sources with something ``known'', i.e. with an optical object, as there were simply too many of the latter within the error box of the radio position. It was not until 1949 that [Bolton et al. (1949)] identified three further sources with optical objects. They associated Tau A with the ``Crab Nebula'', a supernova remnant in our Galaxy, Vir A with M 87, the central galaxy in the Virgo cluster, and Cen A with NGC 5128, a bright nearby elliptical galaxy with a prominent dust lane. By 1955, with the publication of the ``2C'' survey ([Shakeshaft et al. (1955)]) the majority of radio sources were still thought to be Galactic stars, albeit faint ones, since no correlation with bright stars was observed. However, in the previous year, the bright radio source Cyg A had been identified with a very faint (~ 16m) and distant (z = 0.057) optical galaxy ([Baade & Minkowski (1954)]).
Excellent accounts of early radio astronomy can be found in the volumes by Hey (1971, 1973), [Graham-Smith (1974), Edge & Mulkay (1976)], [Sullivan III (1982)], Sullivan III (1984), [Kellermann & Sheets (1984), Robertson (1992)], and in [Haynes et al. (1996)], the latter two describing the Australian point of view. The growth in the number of discrete source lists from 1946 to the late 1960s is given in Appendix 4 of [Pacholczyk (1970)]. Many of the major source surveys carried out during the late 1970s and early 1980s (6C, UTR, TXS, B2, MRC, WSRT, GB, PKS, S1-S5) are described in [Jauncey (1977)]. The proceedings volume by [Condon & Lockman (1990)] includes descriptions of several large-scale surveys in the continuum, HI, recombination lines, and searches for pulsars and variable sources.
3.2. Radio Source Nomenclature: The Good, the Bad and the Ugly
As an aside, Appendix 4 of [Pacholczyk (1970)] explains the difficulty (and liberty!) with which radio sources were designated originally. In the early 1950s, with only a few dozen radio sources known, one could still afford to name them after the constellation in which they were located followed by an upper case letter in alphabetic sequence, to distinguish between sources in the same constellation. This method was abandoned before even a couple of sources received the letter B. Curiously, even in 1991, the source PKSB1343-601 was suggested a posteriori to be named ``CenB'' as it is the second strongest source in Centaurus ([McAdam (1991)]). Apparently the name has been adopted (see [Tashiro et al. (1998)]). Sequential numbers like 3C NNN were used in the late 1950s and early 1960s, sorting the sources in RA (of a given equinox, like B1950 at that time and until rather recently). But when the numbers exceeded a few thousand, with the 4C survey ([Pilkington & Scott (1965)] and [Gower et al. (1967)]) a naming like 4C DD.NN was introduced, where DD indicates the declination strip in which the source was detected and NN is a sequence number increasing with RA of the source, thus giving a rough idea of the source location (although the total number of sources in one strip obviously depends on the declination). A real breakthrough in naming was made with the Parkes (PKS) catalogue ([Bolton et al. (1964)]) where the ``IAU convention'' of coordinate-based names was introduced. Thus e.g. a name PKS 1234-239 would imply that the source lies in the range RA = 12h34m ... 12h35m and DEC =-23°54' ... -24°0'. Note that to construct the source name the exact position of the source is truncated, not rounded. An even number of digits for RA or DEC would indicate integer hours, minutes or seconds (respectively of time and arc), while odd numbers of digits would indicate the truncated (i.e. downward-rounded) tenth of the unit of the preceding pair of digits. Since the coordinates are equinox-dependent and virtually all previous coordinate-based names were based on B1950, it has become obligatory to precede the coordinate-based name with the letter J if they are based on the J2000 equinox. Thus e.g. PKS B0000-506 is the same as PKS J0002-5024, and the additional digit in DEC merely reflects the need for more precision nowadays. Vice versa, the lack of a fourth digit in the B1950 name reflects the recommendation to never change a name of a source even if its position becomes better known later. The current sensitivity of surveys and the resulting surface density of sources implies much longer names to be unique. Examples are NVSS B102023+252903 or FIRST J102310.0+251352 (which are actually the same source!). Authors should follow IAU recommendations for object names (Section 8.8). The origin of existing names, their acronyms and recommended formats can be traced with the on-line ``Dictionary of Nomenclature of Celestial Objects'' (vizier.u-strasbg.fr/cgi-bin/Dic; [Lortet et al. (1994)]). A query for the word ``radio'' (option ``Related to words'') will display the whole variety of naming systems used in radio astronomy, and will yield what is perhaps the most complete list of radio source literature available from a single WWW site. Authors of future radio source lists, and project leaders of large-scale surveys, are encouraged to consult the latter URL and register a suitable acronym for their survey well in advance of publication, so as to guarantee its uniqueness, which is important for its future recognition in public databases.
Radio surveys may be categorised into imaging and discrete source surveys. Imaging surveys were mostly done with single dishes and were dedicated to mapping the extended emission of our Galaxy (e.g. [Haslam et al. (1982)], [Dwarakanath & Udaya Shankar (1990)]) or just the Galactic plane ([Reich et al. (1984)], [Jonas et al. (1985)]). Only some of them are useful for extracting lists of discrete sources (e.g. [Reich et al. (1997)]). The semi-automatic procedure of source extraction implies that the derived catalogues are usually limited to sources with a size of at most a few beamwidths of the survey. The highest-resolution radio imaging survey covering the full sky, and containing Galactic foreground emission on all scales, is still the 408MHz survey ([Haslam et al. (1982)]) with HPBW ~ 50'. Four telescopes were used and it has taken 15 years from the first observations to its publication. Its 1.4GHz counterpart in the northern hemisphere ([Reich (1982)], [Reich & Reich (1986)]) is being completed in the south with data from the 30-m dish at Instituto Argentino de Radioastronomía, Argentina.
The discrete source surveys may be done either with interferometers or with single dishes. Except for the most recent surveys (FIRST, NVSS and WENSS, see Section 3.7) the interferometer surveys tend to cover only small parts of the sky, typically a single field of view of the array, but often with very high sensitivities reaching a few µJy in the deepest surveys. The source catalogues extracted from discrete source surveys with single dishes depend somewhat on the detection algorithm used to find sources from two-dimensional maps. There are examples where two different source catalogues were published, based on the same original maps. Both the ``87GB'' ([Gregory & Condon (1991)]) and ``BWE'' ([Becker et al. (1991)]) catalogues were drawn from the same 4.85GHz maps ([Condon et al. (1989)]) obtained with the Green Bank 300-ft telescope. The authors of the two catalogues (published on 510 pages of the same volume of ApJS), arrived at 54,579 and 53,522 sources, respectively. While the 87GB gives the peak flux, size and orientation of the source, the BWE gives the integrated flux only, plus a spectral index between 1.4 and 4.85GHz from a comparison with another catalogue. Thus, while being slightly different, both catalogues complement each other. The same happened in the southern hemisphere, using the same 4.85GHz receiver on the Parkes 64-m antenna: the ``PMN'' ([Griffith et al. (1994)]) and ``PMNM'' catalogues ([Gregory et al. (1994)]) were constructed from the same underlying raw scan data, but using different source extraction algorithms, as well as imposing different limits in both signal-to-noise for catalogue source detection, and in the maximum source size. The larger size limit for sources listed in the PMN catalogue, as compared to the northern 87GB, becomes obvious in an all-sky plot of sources from both catalogues: the Galactic plane is visible only in the southern hemisphere ([Tasker & Wright (1993)]), simply due to the large number of extended sources near the plane which have been discarded in the northern catalogues ([Becker et al. (1991)]). [Baleisis et al. (1998)] have also found a 2%-8% mismatch between 87GB and PMN. Eventually, a further coverage of the northern sky made in 1986 (not available as a separate paper) has been averaged with the 1987 maps (which were the basis for 87GB) to yield the more sensitive GB6 catalogue ([Gregory et al. (1996)]). Thus, a significant difference in source peak flux density between 87GB and GB6 may indicate variability, and [Gregory et al. (1998)] have indeed confirmed over 1400 variables.
If single-dish survey maps (or raster scans) are sufficiently large, they may be used to reveal the structure of Galactic foreground emission and discrete features like e.g. the ``loops'' or ``spurs'' embedded in this emission. These are thought to be nearby supernova remnants, an idea supported by additional evidence from X-rays (Egger & Aschenbach 1995) and older polarisation surveys ([Salter (1983)]). Surveys of the linear polarisation of Galactic emission will not be dealt with here. As pointed out by [Salter & Brown (1988)], an all-sky survey of linear polarisation, at a consistent resolution and frequency, is still badly needed. No major polarisation surveys have been published since the compendium of [Brouw & Spoelstra (1976)], except for small parts of the Galactic plane ([Junkes et al. (1987)]). This is analogous to a lack of recent surveys for discrete source polarisation (Section 2.6). Apart from helping to discern thermal from non-thermal features, polarisation maps have led to the discovery of surprising features which are not present in the total intensity maps ([Wieringa et al. (1993b)], [Gray et al. (1998)]). Although the NVSS (Section 3.7) is not suitable to map the Galactic foreground emission and its polarisation, it offers linear polarisation data for ~ 2 million radio sources. Many thousands of them will have sufficient polarisation fractions to be followed up at other frequencies, and to study their Faraday rotation and depolarisation behaviour.
3.4. Surveys from Low to High Frequencies: Coverage and Content
There is no concise list of all radio surveys ever made. Purton & Durrell (1991) used 233 different articles on radio source surveys, published 1954-1991, to prepare a list of 386 distinct regions of sky covered by these surveys (cats.sao.ru/doc/SURSEARCH.html). While the source lists themselves were not available to these authors, the list was the basis for a software allowing queries to determine which surveys cover a given region of sky. A method to retrieve references to radio surveys by acronym has been mentioned in Section 3.2. In Section 4.1 a quantitative summary is given of what is available electronically.
In this section I shall present the ``peak of the iceberg'':
in Table 1, I have listed the largest surveys of
discrete radio sources
which have led to source catalogues available in electronic form.
The list is sorted by frequency band (col. 1), and the emphasis is
on finder surveys with more than ~ 800 sources and more
than ~ 0.3 sources/deg2. However, some other
surveys were included if they constitute a significant contribution
to our knowledge of the source population at a given frequency,
like e.g. re-observations of sources originally found at other frequencies.
It is supposedly complete for source catalogues with
 2000 entries,
whereas below that limit a few source lists may be missing for not
fulfilling the above criteria.
Further columns give the acronym of the survey or observing instrument,
the year(s) of publication, the approximate range of RA and DEC covered
(or Galactic longitude l and latitude b for Galactic plane
surveys), the angular resolution in arcmin,
the approximate limiting flux density in mJy, the total number of sources
listed in the catalogue, the average surface density of sources
per square degree, and a reference number
which is resolved into its ``bibcode'' in the Notes to the table.
Three famous series of surveys are excluded from
Table 1, as
they are not contiguous large-area surveys, but are dedicated to many
individual fields, either for Galactic or for cosmological studies
(e.g. source counts at faint flux levels).
These are the source lists from various individual pointings of the
interferometers at DRAO Penticton (P), Westerbork (W) and the
Cambridge One-Mile telescope (5C).
2000 entries,
whereas below that limit a few source lists may be missing for not
fulfilling the above criteria.
Further columns give the acronym of the survey or observing instrument,
the year(s) of publication, the approximate range of RA and DEC covered
(or Galactic longitude l and latitude b for Galactic plane
surveys), the angular resolution in arcmin,
the approximate limiting flux density in mJy, the total number of sources
listed in the catalogue, the average surface density of sources
per square degree, and a reference number
which is resolved into its ``bibcode'' in the Notes to the table.
Three famous series of surveys are excluded from
Table 1, as
they are not contiguous large-area surveys, but are dedicated to many
individual fields, either for Galactic or for cosmological studies
(e.g. source counts at faint flux levels).
These are the source lists from various individual pointings of the
interferometers at DRAO Penticton (P), Westerbork (W) and the
Cambridge One-Mile telescope (5C).
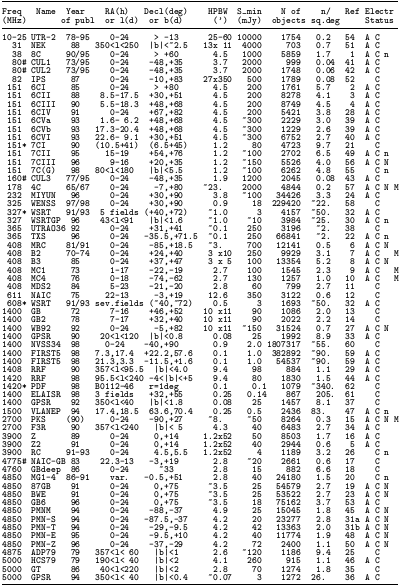
|
| (1) A total of 66 surveys are listed with altogether
3,058,035 entries.
See the explanations and references in the Notes to this Table. |
|
Notes to Table 1. #: not a finder survey, but re-observations of previously catalogued sources. *: circular field, central coordinates and radius are given. The catalogue electronic status is coded as follows: A: available from ADC/CDS (Section 4.1); C: (all of them!) searchable simultaneously via CATS (Section 4.2); N: fluxes are in NED; n: source positions are in NED (cf. Section 4.3); M: included in MSL (Section 4.1). An update of this table is kept at cats.sao.ru/doc/MAJOR_CATS.html. |
Both single-dish and interferometer surveys are included in Table 1. While interferometers usually provide much higher absolute positional accuracy, there is one major interferometer survey (TXS at 365MHz; [Douglas et al. (1996)], utrao.as.utexas.edu/txs.html), for which one fifth of its ~ 67,000 catalogued source positions suffer from possible ``lobe-shifts''. These sources have a certain likelihood to be located at an alternative, but precisely determined position, about 1' from the listed position. It is not clear a priori which of the two positions is the true one, but the ambiguity can usually be solved by comparison with other sufficiently high resolution maps (see Fig. B1 of [Vessey & Green (1998)] for an example). For a reliable cross-identification with other catalogues these alternative positions obviously have to be taken into account.
The angular resolution of the surveys tends to increase with observing
frequency, while the lowest flux density detected tends to decrease
(but increase again above ~ 8GHz). In fact, until recently the
relation between observing frequency,
 , and limiting flux density,
Slim, of large-scale surveys between 10MHz and 5GHz followed
rather closely the power-law spectrum of an average extragalactic radio
source,
S ~ -0.7. This
implied a certain bias against the detection
of sources with rare spectra, like e.g. the ``compact steep spectrum'' (CSS)
or the ``GHz-peaked spectrum'' (GPS) sources
([O'Dea (1998)]).
With the new, deep, large-scale radio surveys like WENSS, NVSS and
FIRST (Section 3.7), with a sensitivity of 10-50
times better than
previous ones, one should be able to construct much larger samples
of these cosmologically important type of sources
(cf. [Snellen
et al. (1996)]).
A taste of some cosmological applications possible with these new
radio surveys has been given in the proceedings volume by
[Bremer et
al. (1998)].
, and limiting flux density,
Slim, of large-scale surveys between 10MHz and 5GHz followed
rather closely the power-law spectrum of an average extragalactic radio
source,
S ~ -0.7. This
implied a certain bias against the detection
of sources with rare spectra, like e.g. the ``compact steep spectrum'' (CSS)
or the ``GHz-peaked spectrum'' (GPS) sources
([O'Dea (1998)]).
With the new, deep, large-scale radio surveys like WENSS, NVSS and
FIRST (Section 3.7), with a sensitivity of 10-50
times better than
previous ones, one should be able to construct much larger samples
of these cosmologically important type of sources
(cf. [Snellen
et al. (1996)]).
A taste of some cosmological applications possible with these new
radio surveys has been given in the proceedings volume by
[Bremer et
al. (1998)].
Table 1 also shows that there are no appreciable source surveys at frequencies higher than 5GHz, mainly for technical reasons: it takes large amounts of telescope time to cover a large area of sky to a reasonably low flux limit with a comparatively small beam. New receiver technology as well as new scanning techniques will be needed. For example, by continuously (and slowly) slewing with all elements of an array like the VLA, an adequately dense grid of phase centres for mosaicing could be simulated using an appropriate integration time. More probably, the largest gain in knowledge about the mm-wave radio sky will come from the imminent space missions for microwave background studies, MAP and PLANCK (see Section 8.3). Currently there is no pressing evidence for ``new'' source populations dominating at mm waves (cf. sect.3.3 of [Condon et al. (1995)]), although some examples among weaker sources were found recently ([Crawford et al. (1996)], [Cooray et al. (1998)]). Surveys at frequencies well above 5GHz are thus important to quantify how such sources would affect the interpretation of the fluctuations of the microwave background. Until now, these estimates rely on mere extrapolations of source spectra at lower frequencies, and certainly the information content of the surveys in Table 1 has not at all been fully exploited for this purpose.
Table 1 is an updated version of an earlier one ([Andernach (1992)]) which listed 38 surveys with ~ 450,000 entries. In 1992 I speculated that by 2000 the number of measured flux densities would have quadrupled. The current number (in 1998!) is already seven times the number for 1992.
3.5. Optical Identification Content
The current information on sources within our Galaxy is summarized in Section 3.6. The vast majority of radio sources more than a few degrees away from the Galactic plane are extragalactic. The latest compilation of optical identifications of extragalactic radio sources dates back to 1983 ([Véron-Cetty & Véron (1983)], hereafter VV83) and lists 14,585 entries for 10,173 different sources, based on 917 publications. About 25% of these are listed as ``empty'', ``blank'' or ``obscured'' fields (EF, BF, or OF), i.e. no optical counterpart has been found to the limits of detection. The VV83 compilation has not been updated since 1983, and is not to be confused with the ``Catalogue of Quasars and Active Galactic Nuclei'' by the same authors. Both compilations are sometimes referred to as the (``well-known'') ``Véron catalogue'', but usually the latter is meant, and only the latter is being updated ([Véron-Cetty & Véron (1998)] or ``VV98''). The only other (partial) effort of a compilation similar to VV83 was PKSCAT90 ([Otrupcek & Wright (1991)]), which was restricted to the 8263 fairly strong PKS radio sources and, contrary to initial plans, has not been updated since 1990. It also lacks quite a few references published before 1990.
For how many radio sources do we know an optical counterpart? From Table 1 we may very crudely estimate that currently well over 2 million radio sources are known (~ 3.3 million individual measurements are available electronically). A compilation of references (not included in VV83) on optical identifications of radio sources maintained by the present author currently holds 1#1560 references dealing with a total of ~ 56,000 objects. This leads the author to estimate that an optical identification (or absence thereof) has been reported for ~ 20-40,000 sources. Note that probably quite a few of these will either occur in more than one reference or be empty fields. Most of the information contained in VV83 is absent from pertinent object databases (Section 4.3), given that these started including extragalactic data only since 1983 (SIMBAD) and 1988 (NED). However, most of the optical identifications published since 1988 can be found in NED. Moreover, numerous optical identifications of radio sources have been made quietly (i.e. outside any explicit publication) by the NED team. Currently (May 98) NED contains ~ 9,800 extragalactic objects which are also radio sources. Only 57% of these have a redshift in NED. Even if we add to this some 2-3,000 optically identified Galactic sources (Section 3.6) we can state fairly safely that of all known radio sources, we currently know the optical counterpart for at most half a percent, and the distance for no more than a quarter percent. The number of counterparts is likely to increase by thousands once the new large radio survey catalogues (WENSS, NVSS, FIRST), as well as new optical galaxy catalogues, e.g. from APM (www.ast.cam.ac.uk/~apmcat), SuperCOSMOS (www-wfau.roe.ac.uk/sss/) or SDSS (Section 3.7.3), become available. Clearly, more automated identification methods and multifibre spectroscopy (like e.g. 2dF, FLAIR, and 6dF, all available from www.aao.gov.au/) will be the only way to reduce the growing gap between the number of catalogued sources and the knowledge about their counterparts.
3.6. Galactic Plane Surveys and Galactic Sources
Some of the major discrete source surveys of the Galactic plane are included in Table 1 (those for which a range in l and b are listed in columns 4 and 5, and several others covering the plane). Lists of ``high''-resolution surveys of the Galactic radio continuum up to 1987 have been given in [Kassim (1988)] and [Reich (1991)]. Due the high density of sources, many of them with complex structure, the Galactic plane is the most difficult region for the preparation of discrete source catalogues from maps. The often unusual shapes of radio continuum sources have led to designations like the ``snake'', the ``bedspring'' or ``tornado'', the ``mouse'' (cf. [Gray (1994a)]) or a ``chimney'' ([Normandeau et al. (1996)]). For extractions of images from some of these surveys see Section 6.3.
3.6.1. What kind of discrete radio sources can be found in our Galaxy?
Of the 100,000 brightest radio sources in the sky, fewer than 20 are stars.
A compilation of radio observations of ~ 3000 Galactic stars has been
maintained until recently by
[Wendker (1995)].
The electronic version is available from ADC/CDS
(catalogue #2199, Section 4.1) and
includes flux densities for about 800
detected stars and upper limits for the rest.
This compilation is not being updated any more. The most recent
push for the detection of new radio stars has just come from
a cross-identification of the FIRST and NVSS catalogues with star catalogues.
In the FIRST survey region the number of known radio stars has
tripled with a few dozen FIRST detections (S
1mJy at 1.4GHz,
[Helfand et
al. (1997)]),
and 50 (mostly new) radio stars were found in the NVSS
([Condon et
al. (1997)]),
many of them radio variable.
A very complete WWW page on Supernovae (Sne), including SNRs, is offered by Marcos J. Montes at rsd-www.nrl.navy.mil/7212/montes/sne.html. It provides links to other supernova-related pages, to catalogues of SNe and SNR, to individual researchers, as well as preprints, meetings and proceedings on the subject. D.A. Green maintains his ``Catalogue of Galactic Supernova Remnants'' at www.mrao.cam.ac.uk/surveys/snrs/. The catalogue contains details of confirmed Galactic SNRs (almost all are radio SNRs), and includes bibliographic references, together with lists of other possible and probable Galactic SNRs. From a Galactic plane survey with the RATAN-600 telescope ([Trushkin (1996)]) S. Trushkin derived radio profiles along RA at 3.9, 7.7, and 11.1GHz for 70 SNRs at cats.sao.ru/doc/Atlas_snr.html (cf. [Trushkin (1996)]). Radio continuum spectra for 192 of the 215 SNRs in Green's catalogue ([Trushkin (1998)]) may be displayed at cats.sao.ru/cats_spectra.html.
Planetary nebulae (PNe), the expanding shells of stars in a late stage
of evolution, all emit free-free radio radiation. The deepest
large-scale radio search of PNe has been performed by
[Condon & Kaplan (1998)],
who cross-identified the ``Strasbourg-ESO Catalogue of Galactic
Planetary Nebulae''
(SESO, available as ADC/CDS #5084) with the NVSS catalogue. To do
this, some of the poorer optical positions in SESO for the 885 PNe north
of  = -40° had to be
re-measured on the Digitized Sky Survey (DSS;
archive.stsci.edu/dss/dss_form.html).
The authors detect 680 (77%) PNe brighter than about
S(1.4GHz) = 2.5mJy/beam.
A database of Galactic Planetary Nebulae is maintained at Innsbruck
(ast2.uibk.ac.at/).
However, the classification of PNe
is a tricky subject, as shown by several publications over the past
two decades (e.g.
[Kohoutek
(1997)],
[Acker et al. (1991)],
or [Acker & Stenholm (1990)]).
Thus the presence in a catalogue should not be taken as ultimate proof of
its classification.
= -40° had to be
re-measured on the Digitized Sky Survey (DSS;
archive.stsci.edu/dss/dss_form.html).
The authors detect 680 (77%) PNe brighter than about
S(1.4GHz) = 2.5mJy/beam.
A database of Galactic Planetary Nebulae is maintained at Innsbruck
(ast2.uibk.ac.at/).
However, the classification of PNe
is a tricky subject, as shown by several publications over the past
two decades (e.g.
[Kohoutek
(1997)],
[Acker et al. (1991)],
or [Acker & Stenholm (1990)]).
Thus the presence in a catalogue should not be taken as ultimate proof of
its classification.
HII regions are clouds of almost fully ionised hydrogen found throughout most late-type galaxies. Major compilations of HII regions in our Galaxy were published by [Sharpless (1959)] (N = 313) and [Marsalkova (1974)] (N = 698). A graphical tool to create charts with objects from 17 catalogues covering the Galactic Plane, the Milky Way Concordance (www.nmt.edu/~pbarnes/concord/), has already been mentioned in my tutorial in this volume. Methods to find candidate HII regions based on IR colours of IRAS Point Sources have been given in [Hughes & MacLeod (1989)] and Wood & Churchwell (1989), and were further exploited to confirm ultracompact HII regions (UCHII) via radio continuum observations ([Kurtz et al. (1994)]) or 6.7GHz methanol maser searches ([Walsh et al. (1997)]). [Kuchar & Clark (1997)] merged six previous compilations to construct an all-sky list of 1048 Galactic HII regions, in order to look for radio counterparts in the 87GB and PMN maps at 4.85GHz. They detect about 760 HII regions above the survey threshold of ~ 30mJy (87GB) and ~ 60mJy (PMN). These authors also point out the very different characteristics of these surveys, the 87GB being much poorer in extended Galactic plane sources than the PMN, for the reasons mentioned above (Section 3.3).
The ``Princeton Pulsar Group''
(pulsar.princeton.edu/)
offers basic explanations of the pulsar phenomenon, a calculator
to convert between dispersion measure and distance for user-specified
Galactic coordinates, software for analysis of pulsar timing data,
links to pulsar researchers, and even audio-versions of the pulses of a
few pulsars. The largest catalogue of known pulsars, originally
published with 558 records by
[Taylor et
al. (1993)]
is also maintained and searchable there (with currently 706 entries).
Pulsars have very steep radio spectra (e.g.
[Malofeev
(1996)],
or astro-ph/9801059,
9805241),
are point-like and polarised, so that pulsar candidates can be found
from these criteria in large source surveys
([Kouwenhoven et al. (1996)]).
Data on pulsars, up to pulse profiles of individual pulsars,
from dozens of different papers can be found at the
``European Pulsar Network''
(www.mpifr-bonn.mpg.de/div/pulsar/data/).
They have developed a flexible data format for exchange of pulsar data
([Lorimer et al. (1998)]),
which is now used in
an on-line database of pulse profiles as well as an interface for
their simultaneous observations of single pulses. The database can
be searched by various criteria like equatorial and/or Galactic
coordinates, observing frequency, pulsar period and dispersion measure (DM).
Further links on radio pulsar resources have been compiled at
pulsar.princeton.edu/rpr.shtml, including
many recent papers on pulsar research.
[Kaplan et
al. (1998)]
have used the NVSS to search for phase-averaged radio emission from the pulsars
north of
2000 = -40° in the
[Taylor et al. (1993)]
pulsar catalogue. They identify 79 of these pulsars with a flux
of S(1.4GHz)
2.5mJy, and 15 of
them are also in the WENSS source catalogue.
An excellent description of the various types of Galactic radio sources, including masers, is given in several of the chapters of [Verschuur & Kellermann (1988)].
Last, but not least, Galactic plane radio sources can point us to
galaxies and clusters in the ``Zone of Avoidance'' (ZOA).
In fact, in a large number of surveys for discrete radio sources,
the Galactic plane does not show any excess number density of
(usually compact) sources, e.g. in TXS
([Douglas et al. (1996)])
or BWE
([Becker et
al. (1991)]).
In a 2.7GHz survey of the
region -3°<  <240°, | b| < 5°, with the
Effelsberg 100-m telescope, the density of unresolved sources
(
<240°, | b| < 5°, with the
Effelsberg 100-m telescope, the density of unresolved sources
( 1' intrinsic size)
was not found to vary with Galactic latitude
([Fürst et al. (1990)]).
At much higher resolution (5''), using the VLA to cover the area
-10°< <40°, |
b| < 1.8°, a concentration
of compact sources (size
20'') towards the Galactic
plane becomes noticeable, but only for |b| <0.4°
([Helfand et al. (1992)]).
[Becker et
al. (1994)]
have shown that at 5GHz this
distribution has a width of only 10'-15'. Most of the
extragalactic sources will be far too optically faint to be ever
identified. Two notable counter-examples are the prototype
``head-tail'' radio source 3C129 (z = 0.021;
[Miley et al. (1972)]),
now known to be a member of the Perseus supercluster of galaxies
([Hauschildt (1987)]),
and ``CentaurusB'' (see Section 3.2).
Other examples are two tailed radio
sources, PKSB1610-608 and PKSB1610-605 in Abell cluster A3627,
which is thought to be the central clump of the ``Great Attractor''
([Kraan-Korteweg et al. (1997)]).
A typical wide-angle tailed (WAT) radio
source (G 357.30+01.24) has been found very close to the Galactic
centre, indicating the presence of a cluster of galaxies in that
direction
([Gray
(1994b)]).
Due to the extreme optical
obscuration, there is little hope of optically identifying
this cluster and determining its distance.
1' intrinsic size)
was not found to vary with Galactic latitude
([Fürst et al. (1990)]).
At much higher resolution (5''), using the VLA to cover the area
-10°< <40°, |
b| < 1.8°, a concentration
of compact sources (size
20'') towards the Galactic
plane becomes noticeable, but only for |b| <0.4°
([Helfand et al. (1992)]).
[Becker et
al. (1994)]
have shown that at 5GHz this
distribution has a width of only 10'-15'. Most of the
extragalactic sources will be far too optically faint to be ever
identified. Two notable counter-examples are the prototype
``head-tail'' radio source 3C129 (z = 0.021;
[Miley et al. (1972)]),
now known to be a member of the Perseus supercluster of galaxies
([Hauschildt (1987)]),
and ``CentaurusB'' (see Section 3.2).
Other examples are two tailed radio
sources, PKSB1610-608 and PKSB1610-605 in Abell cluster A3627,
which is thought to be the central clump of the ``Great Attractor''
([Kraan-Korteweg et al. (1997)]).
A typical wide-angle tailed (WAT) radio
source (G 357.30+01.24) has been found very close to the Galactic
centre, indicating the presence of a cluster of galaxies in that
direction
([Gray
(1994b)]).
Due to the extreme optical
obscuration, there is little hope of optically identifying
this cluster and determining its distance.
3.7. Modern Large-Scale Discrete Source Surveys: NVSS, FIRST, WENSS and SUMSS
Some of the first large-scale contiguous surveys with interferometers had become available in the 1980s. These were made with arcmin resolution at low frequencies where the large fields of view required only a few pointings (e.g. 6C or 8C; www.mrao.cam.ac.uk/surveys/). Only in the 1990s, however, has the increase in computing power allowed such surveys to be made at even sub-arcmin resolution with the most powerful interferometers like the VLA and the WSRT, requiring up to a quarter of a million pointings. Four ongoing or recently finished surveys in this category are described below.
3.7.1. The ``WENSS'' Survey at 325-350MHz
The ``Westerbork Northern Sky Survey''
(WENSS; www.strw.leidenuniv.nl/wenss)
is a radio survey made with the WSRT
(www.nfra.nl/wsrt/index.htm)
from late 1990 to 1996, at frequencies 325 and 610MHz
( 92 and 49cm).
The entire sky north of declination +30° has been covered with
~ 6000 pointings, using a central frequency of 325MHz below
= 74°,
and 350MHz for the polar region. Only 2000 square degrees (~ 20% of the sky
north of +30°) were mapped at 610MHz, and for the time being only
the 325MHz data have been made available to the public.
At 325MHz the resolution is 54" × 54"
csc(), and the
positional accuracy for strong sources is 1.5".
The limiting flux density is ~ 18 mJy (5
92 and 49cm).
The entire sky north of declination +30° has been covered with
~ 6000 pointings, using a central frequency of 325MHz below
= 74°,
and 350MHz for the polar region. Only 2000 square degrees (~ 20% of the sky
north of +30°) were mapped at 610MHz, and for the time being only
the 325MHz data have been made available to the public.
At 325MHz the resolution is 54" × 54"
csc(), and the
positional accuracy for strong sources is 1.5".
The limiting flux density is ~ 18 mJy (5
 ) at both frequencies.
The final products of WENSS, a 325-MHz atlas of 6° × 6° maps
centred on the new POSS plate positions (5° grid)
as well as a source catalogue are now available. FITS maps
can be drawn from the anonymous ftp server at
ftp://vliet.strw.leidenuniv.nl/pub/wenss/HIGHRES/.
A postage stamp server for extraction of smaller images is
planned for the near future.
Also total intensity maps at a lower resolution of 4.2' will soon be
made available.
Ionospheric instabilities make the generation of polarisation maps
(Stokes Q, U and V) formidably difficult and their production is not
currently foreseen.
) at both frequencies.
The final products of WENSS, a 325-MHz atlas of 6° × 6° maps
centred on the new POSS plate positions (5° grid)
as well as a source catalogue are now available. FITS maps
can be drawn from the anonymous ftp server at
ftp://vliet.strw.leidenuniv.nl/pub/wenss/HIGHRES/.
A postage stamp server for extraction of smaller images is
planned for the near future.
Also total intensity maps at a lower resolution of 4.2' will soon be
made available.
Ionospheric instabilities make the generation of polarisation maps
(Stokes Q, U and V) formidably difficult and their production is not
currently foreseen.
Presently there are two source catalogues at 325MHz.
The main catalogue contains 211,235 sources for 28° <
<76° .
The polar catalogue contains 18,341 sources above 74° .
These can be browsed at the URL www.strw.leidenuniv.nl/wenss/search.html.
A detailed description of the survey and the contents of the
source lists are given in
[Rengelink et al. (1997)].
Due to its low frequency and sensitivity to extended structure the WENSS survey is well-suited to detect very extended or low surface brightness objects like giant radio galaxies (cf. [Schoenmakers et al. (1998)]), cluster haloes, and nearby galaxies. Comparing WENSS with other surveys at higher frequencies allows one to isolate candidates for high-redshift radio galaxies, GHz-peaked spectrum (GPS) sources, flat spectrum sources (e.g. high-redshift quasars), and pulsars.
3.7.2. The ``NRAO VLA Sky Survey'' at 1.4GHz (NVSS)
The VLA has been used from 1993 to 1997 to map the entire sky north
of = -40° (82% of the
sky) in its most compact (D)
configuration, giving an angular resolution of 45" at 1.4GHz.
About 220,000 individual snapshots (phase centres) have been observed.
They were of a mere 23.5sec duration each, except at low elevation
when they were increased to up to 60 sec to make up for the
loss of sensitivity due to ground radiation and air mass.
A detailed description is given in
[Condon et al. (1998)]
(ftp://www.cv.nrao.edu/pub/nvss/paper.ps).
The principal data products are:
The NVSS is accessible from www.cv.nrao.edu/~jcondon/nvss.html, and is virtually complete at the time of writing. The latest version of the NVSS catalogue (#34, May 98) is a single 152Mb FITS file with 1.8 × 10⁶ sources. It can be downloaded via anonymous ftp, but users interested in exploiting the entire catalogue may consider requesting a tape copy from NRAO. The publicly available program NVSSlist can extract selected portions of the catalogue very rapidly and is easily installed on the user's local disk for extensive cross-identification projects.
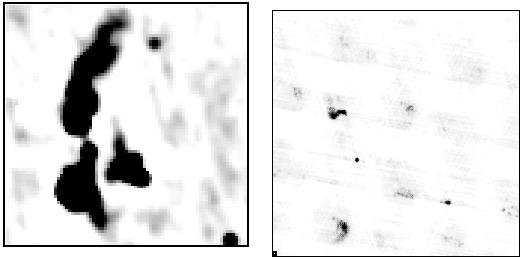
The catalogue can also be browsed at www.cv.nrao.edu/NVSS/NVSS.html and a ``postage stamp server'' to extract NVSS images is available at www.cv.nrao.edu/NVSS/postage.html. Images are also available from Skyview (skyview.gsfc.nasa.gov/), but they neither are as up-to-date as those at NRAO, nor do thay have the same FITS header (Section 6.2). As always, care must be taken in the interpretation of these images. Short integration times and poor uv-coverage can cause grating residuals and limited sensitivity to extended structure (see Fig. 4).

|
Figure 4. Reality and ``ghosts'' in radio maps of 1.5° × 1.5° centred on the radio galaxy 3C449. Left: a 325MHz WENSS map shows the true extent (~ 23') of 3C449. Right: The 1.4GHz NVSS map shows additional weak ghost images extending up to ~ 40', both north and south of 3C449. This occurs for very short exposures (here 23 sec) when there is extended emission along the projection of one of the VLA ``arms'' (here the north arm). Note that neither map shows any indication of the extended foreground emission found at 1.4GHz coincident with an optical emission nebula stretching from NE to SW over the entire area shown (Fig. 4c of Andernach et al. 1992). However, with longer integrations, the uv-coverage of interferometers is sufficient to show the feature (Leahy et al. 1998). |
3.7.3. The ``FIRST'' Survey at 1.4GHz
The VLA has been used at 1.4GHz
( = 21.4cm) in its
B-configuration for another large-scale survey at 5" resolution.
It is called FIRST (``Faint Images of the Radio Sky at Twenty-centimeters'')
and is designed to produce the radio equivalent of the Palomar Observatory Sky
Survey over 10,000 square degrees of the North Galactic Cap.
An automated mapping pipeline produces images with 1.8" pixels and
a typical rms noise of 0.15 mJy. At the 1 mJy source detection
threshold, there are ~ 90 sources per square degree, about a third of
which have resolved structure on scales from 2"-30".
Individual sources have 90% confidence error circles of radius < 0.5" at the 3 mJy level and 1'' at the survey threshold. Approximately 15% of the sources have optical counterparts at the limit of the POSS-I plates (E ~ 20.0), and unambiguous optical identifications are achievable to mv ~ 24. The survey area has been chosen to coincide with that of the Sloan Digital Sky Survey (SDSS; www-sdss.fnal.gov:8000/). This area consists mainly of the north Galactic cap (|b| > + 30°) and a smaller region in the south Galactic hemisphere. At the mv ~ 24 limit of SDSS, about half of the optical counterparts to FIRST sources will be detected.
The homepage of FIRST is sundog.stsci.edu/. By late 1997 the survey had covered about 5000 square degrees. The catalogue of the entire region (with presently ~ 437,000 sources) can be searched interactively at sundog.stsci.edu/cgi-bin/searchfirst. A postage stamp server for FIRST images (presently for 3000 square degrees) is available at third.llnl.gov/cgi-bin/firstcutout. For 1998 and 1999, the FIRST survey was granted enough time to cover an additional 3000 square degrees.
The availability of the full NVSS data products has reduced the enthusiasm of parts of the community to support the finishing of FIRST's goals. However, only the FIRST survey (and less so the NVSS) provides positions accurate enough for reliable optical identifications, particularly for the cosmologically interesting faint and compact sources. On the other hand, in Figure 5 I have shown an extreme example of the advantage of NVSS for studies of extended sources. In fact, the Figure shows the complementary properties of NVSS and FIRST. A very extended source, perhaps just recognisable with NVSS, will be broken up by FIRST into apparently unrelated components. Thus, it would be worthwhile to look into the feasibility of merging the uv data of NVSS and FIRST to create maps at 10"-15" resolution in the region covered by both surveys.
|
Figure 5. 1.4GHz maps of the radio galaxy 3C 40 (PKS B0123-016). Left: NVSS map of 20' × 20'. The point-like component at the gravity centre of the radio complex coincides with NGC 547, a dominant dumb-bell galaxy in the core of the A194 galaxy cluster (cf. Fig. 2a in my tutorial); the head-tail like source ~ 5' due SW is NGC 541. Right: FIRST map of 12' × 12': only the strongest parts of each component are detected and show fine structure, but appear unrelated. The radio core of NGC 547 is unresolved. Some fainter components appear to be artefacts. |
3.7.4. The ``SUMSS'' 843MHz Survey with ``MOST''
Since 1994 the ``Molonglo Observatory Synthesis Telescope'' (MOST) has been upgraded from the previous 70' field of view to a 2.7° diameter field of view. As MOST's aperture is almost filled, the image contains Fourier components with a wide range of angular scales, and has low sidelobes. In mid-1997, the MOST started the ``Sydney University Molonglo Sky Survey'' (SUMSS; [Hunstead et al. (1998)]). The entire sky south of DEC = -30° and |b| > 10° will be mapped at 843MHz, a total of 8000 square degrees covered by 2713 different 12-h synthesis field centres. It complements northern surveys like WENSS and NVSS, and it overlaps with NVSS in a 10° strip in declination (-30° to -40°), so as to allow spectral comparisons. SUMSS is effectively a continuation of NVSS to the southern hemisphere (see Table 2). However, with its much better uv coverage it surpasses both WENSS and NVSS in sensitivity to low surface brightness features, and it can fill in some of the ``holes'' in the uv plane where it overlaps with NVSS. The MOST is also being used to perform a Galactic plane survey (Section 8).
| WENSS | SUMSS | NVSS | FIRST | |
| Frequency | 325 MHz | 843 MHz | 1400 MHz | 1400 MHz |
| Area (deg2) | 10,100 | 8,000 | 33,700 | 10,000 |
| Resolution (") | 54 × 54
csc()
| 43 × 43
csc()
| 45 | 5 |
| Detection limit | 15 mJy | <5 mJy | 2.5 mJy | 1.0 mJy |
| Coverage |
> + 30°
|
< - 30°,
|b| > 10°
|
> - 40°
| |b| > 30°,
> - 12°
|
| Sources/deg2 | 21 | >40 | 60 | 90 |
| No. of sources | 230,000 | 320,000 | 2,000,000 | 900,000 |
SUMSS positions are uncertain by no more than 1" for sources brighter than 20mJy, increasing to ~ 2" at 10 mJy and 3-5" at 5mJy, so that reliable optical identifications of sources close to the survey limit may be made, at least at high Galactic latitude. In fact, the identification rate on the DSS (Section 3.6) is ~ 30% down to bJ ~ 22 ([Sadler (1998)]). Observations are made only at night, so the survey rate is ~ 1000 deg2 per year, implying a total period of 8 years for the data collection. The south Galactic cap (b < -30°) should be completed by mid-2000. The release of the first mosaic images (4° × 4°) is expected for late 1998. The SUMSS team at Univ. Sydney plans to use the NVSS WWW software, so that access to SUMSS will look similar to that for NVSS. For basic information about MOST and SUMSS see www.physics.usyd.edu.au/astrop/SUMSS/.