


In 1986, the CfA survey [de Lapparent et al. 1985] was the `state-of-the-art', but this contained redshifts of only around 2000 galaxies with a maximum recession velocity of 15 000 km s-1. The Las Campanas survey contains around six times as many galaxies, and goes out to a velocity of 60 000 km s-1 [Shectman et al. 1996]. At present, redshifts of around 105 galaxies are available. The next generation of redshift surveys, prominent among which are the Sloan Digital Sky Survey [Gunn & Weinberg 1995] of about one million galaxy redshifts and an Anglo-Australian collaboration using the two-degree field (2DF) [Colless 1998]; these surveys exploit multi-fibre methods which can obtain 400 galaxy spectra in one go, and will increase the number of redshifts by about two orders of magnitude over what is currently available.
Quantitative measures of spatial clustering obtained from these data sets offer the simplest method of probing P(k), assuming that these objects are related in some well-defined way to the mass distribution and this, through the transfer function, is one way of constraining cosmological parameters.
3.2. The Galaxy Power-spectrum
Although the traditional tool for studying galaxy clustering is
the two-point correlation function,
 (r)
[Peebles 1980],
defined by
(r)
[Peebles 1980],
defined by
| (23) |
the (small) joint probability of finding two galaxies in the
(small) volumes dV1 and dV2
separated by a distance r when
the mean number-density of galaxies is n. Most modern analyses
concentrate instead upon its Fourier transform, the power-spectrum
P(k). This is especially useful because it is the power-spectrum
which is predicted directly in cosmogonical models incorporating
inflation and dark matter. For example, Peacock & Dodds have
recently made compilations of power-spectra of different kinds of
galaxy and cluster redshift samples and, for comparison, a
deprojection of the APM w( )
[Peacock & Dodds
1996].
Within the
(considerable) observational errors, and the uncertainty
introduced by modelling of the bias, all the data lie roughly on
the same curve. A consistent picture thus seems to have emerged in
which galaxy clustering extends over larger scales than is
expected in the standard CDM scenario. Considerable uncertainty
nevertheless remains about the shape of the power spectrum on very
large scales.
)
[Peacock & Dodds
1996].
Within the
(considerable) observational errors, and the uncertainty
introduced by modelling of the bias, all the data lie roughly on
the same curve. A consistent picture thus seems to have emerged in
which galaxy clustering extends over larger scales than is
expected in the standard CDM scenario. Considerable uncertainty
nevertheless remains about the shape of the power spectrum on very
large scales.
3.3. The abundances of objects
In addition to their spatial distribution, the number-densities of
various classes of cosmic objects as a function of redshift can be
used to constrain the shape of the power-spectrum. In particular,
if objects are forming by hierarchical merging there should be
fewer objects of a given mass at high z and more objects with
lower mass. This can be made quantitative fairly simply, using an
analytic method
[Press &
Schechter 1974].
Although this kind of argument can be
applied to many classes of object
[Ma et al. 1997],
it potentially
yields the strongest constraints when applied to galaxy clusters.
At the moment, results are controversial, but the evolution of
cluster numbers with redshift is such sensitive probe of
 so that future studies of
high-redshift clusters may
yield more definitive results
[Eke et al. 1996,
Blanchard et
al. 1999].
so that future studies of
high-redshift clusters may
yield more definitive results
[Eke et al. 1996,
Blanchard et
al. 1999].
It is evident from Figure 1 that, although the three non-SCDM models are similar at z = 0, differences between them are marked at higher redshift. This suggests the possibility of using measurements of galaxy clustering at high redshift to distinguish between models and reality. This has now become possible, with surveys of galaxies at z ~ 3 already being constructed [Steidel et al. 1998]. Unfortunately, the interpretation of these new data is less straightforward than one might have imagined. If the galaxy distribution is biased at z = 0 then the bias is expected to grow with z [Davis et al. 1985]. If galaxies are rare peaks now, they should have been even rarer at high z. There are also many distinct possibilities as to how the bias might evolve with redshift [Moscardini et al. 1998]. Theoretical uncertainties therefore make it difficult to place stringent constrains on models, although with more data and better theoretical modelling, high-redshift clustering measurements will play a very important role in forthcoming years.
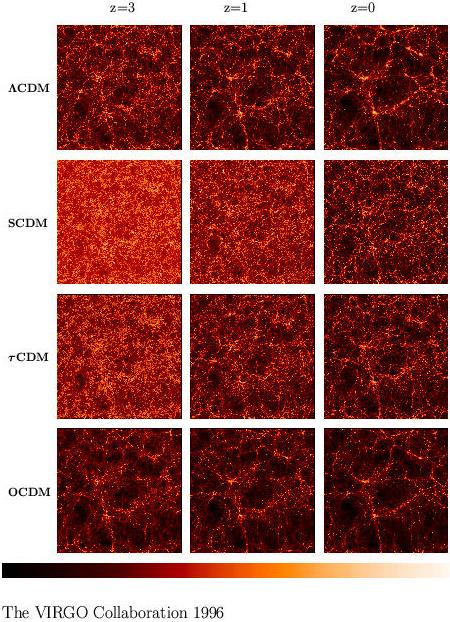
|
Figure 1. Some of the candidate models described in the text, as simulated by the Virgo consortium. Notice that SCDM shows very different structure at z = 0 than the three alternatives shown. The models also differ significantly at different epochs. These simulat ions show the distribution of dark matter only. |
The galaxy power-spectrum has rightly played a central role in the development of this subject, but the information it contains is in fact rather limited. In more precise terms, it is called a second-order statistic as it contains information equivalent to the second moment (i.e. variance) of a random variable. Higher-order statistics would be necessary to provide a complete statistical description of clustering pattern and these generally require large, well-sampled data sets [Sahni & Coles 1985]. One particularly promising set of descriptors emerge from the realisation [Coles & Frenk 1991, Bernardeau 1994, Colombi et al. 1996] that higher-order moments grow by gravitational instability in a manner that couples directly to the growth of the variance. This offers the prospect of being able to distinguish between genuine clustering produced by gravity and clustering induced by bias.
There are various ways in which it is possible to use information about the velocities of galaxies to constrain models [Strauss & Willick 1995]. Probably the most useful information pertains to large-scale motions, as small-scale data populate the highly nonlinear regime.
The basic principle is that velocities are induced by fluctuations
in the total mass, not just the galaxies. Comparing measured
velocities with measured fluctuations in galaxies with measured
fluctuations in galaxy counts, it is possible to constrain both
and b. From
equations (11)-(13) it emerges that
| (24) |
which demonstrates that the velocity flow associated with the
growing mode in the linear regime is curl-free, as it can be
expressed as the gradient of a scalar potential function. Notice
also that the induced velocity depends on
. This is the
basis of a method for estimating
which is known as POTENT
[Dekel
1994].
Since all matter gravitates, not just the luminous
material, there is a hope that methods such as this can break the
degeneracy between clustering induced by gravity and that induced
statistically, by bias.
These methods are prone to error if there are errors in the velocity estimates. Perhaps a more robust approach is to use peculiar motion information indirectly, by the effect they have on the distribution of galaxies seen in redshift-space (i.e. assuming total velocity is proportional to distance). The information gained this way is statistical, but less prone to systematic error [Heavens & Taylor 1995].
Another class of observations that can help break the degeneracy between models involves gravitational lensing. The most spectacular forms of lensing are those producing multiple images or strong distortions in the form of arcs. These require very large concentrations of mass and are therefore not so useful for mapping the structure on large scales. However, there are lensing effects that are much weaker than the formation of multiple images. In particular, distortions producing a shearing of galaxy images promise much in this regard [Kaiser & Squires 1993]. With the advent of new large CCD detectors, this should soon be realised [Mellier 1999], although present constraints are quiet weak.
3.8. The Cosmic Microwave Background
I have so far avoided discussion of the cosmic microwave
background, but this probably holds the key to unlocking many of
the present difficulties in large-scale structure models. Although
the COBE data
[Smoot et al. 1992]
do not constrain the shape of the matter
power spectrum on scales of direct relevance to structures we can
see in the galaxy distribution, finer-scale maps will do so in the
near future. ESA's Planck Explorer and NASA's MAP experiment will
measure the properties of matter fluctuations in the linear
without having to worry about the confusion caused by
non-linearity and bias when galaxy counts are used. It is hoped
that measurements of particular features in the angular power-spectrum
of the fluctuations
[Hu & Sugiyama
1995]
measured by these experiments will
pin down the densities of CDM, HDM, baryons and vacuum energy (i.e.
 )
as well as fixing and
H. Experiments such as BOOMERANG
and MAXIMA are already leading to interesting results, but these
are discussed elsewhere in this volume.
)
as well as fixing and
H. Experiments such as BOOMERANG
and MAXIMA are already leading to interesting results, but these
are discussed elsewhere in this volume.