


We are just entering the era of panchromatic studies of galaxies. While there are still large gaps for individual galaxies, through a wide range of new receiver technologies and space-based observations, we have now made measurements of galaxies from radio waves to gamma rays.
I illustrate the total continuum power output over ten orders of
magnitude of frequency for a range of galaxy types in
Figure 1.
The figure shows a log-log plot of  f against
frequency. The
results for "typical" elliptical and spiral galaxies are based on
measurements of several objects spanning different wavelengths.
Unusual galaxies like M87 and M82 tend to be better observed, but I
caution that the data are particularly sparse in the ultraviolet
through soft x-ray portions of the spectrum as well as the millimeter
and submillimeter wavelengths, so some uncertain extrapolations have
been used.
f against
frequency. The
results for "typical" elliptical and spiral galaxies are based on
measurements of several objects spanning different wavelengths.
Unusual galaxies like M87 and M82 tend to be better observed, but I
caution that the data are particularly sparse in the ultraviolet
through soft x-ray portions of the spectrum as well as the millimeter
and submillimeter wavelengths, so some uncertain extrapolations have
been used.

|
Figure 1. The power output from galaxies as a function of frequency. The top axis is labeled with the corresponding wavelength. |
Recall that the total power output is
 f
d =
f
d(log).
Thus the relative power output in any feature can be
"eyeballed" from the figure by multiplying its log-width
f
d =
f
d(log).
Thus the relative power output in any feature can be
"eyeballed" from the figure by multiplying its log-width
 (log) times its height
f.
This shows that spirals
and irregulars like M82 produce comparable amounts of power in the
submillimeter to far-infrared portion of the spectrum as in the optical.
(log) times its height
f.
This shows that spirals
and irregulars like M82 produce comparable amounts of power in the
submillimeter to far-infrared portion of the spectrum as in the optical.
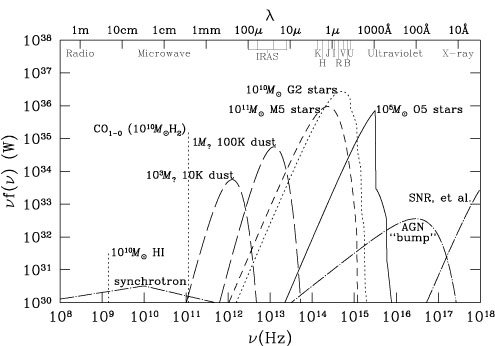
As a guide to interpreting these spectra, I display some possible components in Figure 2. For example, note how a small total mass of O-stars can produce as much power output as 105-106 times more matter in the form of solar-type or M-dwarf stars. Note that several orders of magnitude less mass in the form of red giant G or M stars would produce similar power outputs. The art of modeling the optical portion of the spectrum is to reproduce the shape of the optical portion of the spectrum with a plausible distribution of stellar types. Deriving an actual mass of stellar material is non-trivial since large masses of late type dwarfs can be added with little change in the total power output.
|
Figure 2. Power output from several sources of galactic emission. Most of the curves are labeled according to the solar masses of material producing the emission. The dust emission depends in such a complex way on the grain sizes and compositions that only relative masses (labeled in terms of M?) are shown for two temperatures. Sources of non-thermal emission are shown unscaled just to indicate their relative shapes. Vious of the wavebands commonly observed are labeled along the top axis. |
The large power output from spirals and irregulars in the submillimeter and far-infrared appears to be explained by dust. This is really just reprocessed starlight. The mass of dust producing this major component of the power output is not easy to determine, depending as it does on the size and composition of the dust grains. Note also how a large mass of very cold dust (like the M stars) can be hidden within the total emission. Actually, the mass of dust is not itself believed to be a very significant fraction of the total mass of a galaxy. However the dust is likely associated with molecular clouds that may represent a significant component of the galaxies.
Radio and x-ray emission from galaxies is generally a relatively small fraction of the total power output. It is likely produced by thermal (free-free) emission from HII regions and synchrotron emission from supernova remnants. There may also be components associated with active galactic nuclei. These forms of emission are in various ways connected with stars, star formation, and star death, and are basically correlated with stellar content, except in galaxies like M87 where an AGN and associated jets may produce an exceptionally large non-thermal output.
Even most line emission is closely tied to stars and star formation. Many lines are observed, and each is an important probe of a galaxy's interstellar medium (or outer atmospheres of stars), but these spectral lines ultimately rely on the power produced by starlight to put the atoms in the upper level of the transition. One example shown in Figure 2 is the CO1-0 line. Like the dust, CO is a surrogate tracer for the major mass component of molecular clouds H2. It is a strong line, but it is also difficult to interpret since it depends on the temperature, density, and clumpiness of the gas, and consequently on the relative location of the gas and the stars that power the transition (see, for example, Puget 1989, Stein & Soifer 1983, Telesco 1988). To further complicate matters, in other galaxies - especially those that have undergone little star formation - the enrichment of the interstellar gas in heavy elements may differ.
Last of all, note the 21 cm transition in Figure 2. The strength shown here is for a typical Doppler-broadened line width, which is invisibly narrow on this graph. Although the integrated power involved is small, the line is the simplest tracer of this major component of galaxies' composition. What makes the 21-cm line so simple to interpret is that its excitation temperature is only a fraction of a degree Kelvin. The intergalactic background x-ray radiation can keep the line thermalized (Deguchi & Watson 1985), so it is almost always found with the same ("geometric") fraction of atoms in the upper level of the hyperfine transition, and collisions do not alter that ratio. Therefore the emission in the line is directly proportional to the number of atomic hydrogen atoms, regardless of their temperature or density. Since starlight is not necessary to power the 21 cm line, and since hydrogen is a primordial element, the 21 cm line measures something completely independent of stars.