


3.2. Galalxy formation
Understanding galaxy formation is a much more difficult problem than understanding the evolution of the dark matter distribution. In the CDM theory, galaxies form when gas, initially well mixed with the dark matter, cools and condenses into emerging dark matter halos. In addition to gravity, a non-exhaustive list of the processes that now need to be taken into account includes: the shock heating and cooling of gas into dark halos, the formation of stars from cold gas and the evolution of the resulting stellar population, the feedback processes generated by the ejection of mass and energy from evolving stars, the production and mixing of heavy elements, the extinction and reradiation of stellar light by dust particles, the formation of black holes at the centres of galaxies and the influence of the associated quasar emission. These processes span an enormous range of length and mass scales. For example, the parsec scale relevant to star formation is a factor of 108 smaller than the scale of a galaxy supercluster.
The best that can be done with current computing techniques is to model the evolution of dark matter and gas in a cosmological volume with resolution comparable to a single galaxy. Subgalactic scales must then then be regarded as "subgrid" scales and followed by means of phenomenological models based either on our current physical understanding or on observations. In the approach known as "semi-analytic" modelling (White & Frenk 1991), even the gas dynamics is treated phenomenologically using a simple, spherically symmetric model to describe the accretion and cooling of gas into dark matter halos. It turns out that this simple model works suprisingly well as judged by the good agreement with results of full N-body/gas-dynamical simulations (Benson et al. 2001b, Helly et al. 2002, Yoshida et al. 2002).
The main difficulty encountered in cosmological gas dynamical simulations arises from the need to suppress a cooling instability present in hierarchical clustering models like CDM. The building blocks of galaxies are small clumps that condense at early times. The gas that cools within them has very high density, reflecting the mean density of the Universe at that epoch. Since the cooling rate is proportional to the square of the gas density, in the absence of heat sources, most of the gas would cool in the highest levels of the mass hierarchy leaving no gas to power star formation today or even to provide the hot, X-ray emitting plasma detected in galaxy clusters. Known heat sources are photoionisation by early generations of stars and quasars and the injection of energy from supernovae and active galactic nuclei. These processes, which undoubtedly happened in our Universe, belong to the realm of subgrid physics which cosmological simulations cannot resolve. Different treatments of this "feedback" result in different amounts of cool gas and can lead to very different predictions for the properties of the galaxy population. This is a fundamental problem that afflicts cosmological simulations even when they are complemented by the inclusion of semi-analytic techniques. In this case, the resolution of the calculation can be extended to arbitrarily small mass halos, perhaps allowing a more realistic treatment of feedback. Although they are less general than full gasdynamical simulations, simulations in which the evolution of gas is treated semi-analytically make experimentation with different prescriptions relatively simple and efficient (Kauffmann, White & Guiderdoni 1993, Somerville & Primack 1999, Cole et al. 2000)
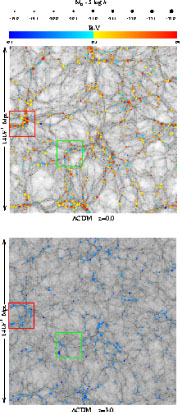 |
Figure 6. A slice 10
h-1 Mpc thick of a simulation of a cubic region
of side 141 h-1 Mpc in the
|
The outcome of an N-body dark matter simulation in a
 CDM universe
in which the visible properties of the galaxies have been calculated using
the semi-analytic model of
Cole et al. (2000)
is illustrated in
Fig. 6
(Benson et al. 2001a).
Galaxies form mostly
along the filaments delineated by the dark matter. Red
galaxies predominate in the most massive dark matter halos, just as
observed in real galaxy clusters. This segregation is a natural outcome of
hierarchical clustering from CDM initial conditions. It reflects the fact
that the progenitors of rich clusters form substantially earlier than a
typical dark matter halo of the same mass.
Fig. 7 shows the
galaxy luminosity function which describes the abundance of galaxies of
different luminosities. The theoretical predictions, shown by the line,
agree remarkably well with the observations but this should not be regarded
as a spectacular success of the theory because the free parameters in the
semi-analytic star formation and feedback model have been tuned to achieve
as good a match as possible to this specific observational dataset. In
particular, the feedback model has been tuned to produce a relatively flat
function at the faint end.
CDM universe
in which the visible properties of the galaxies have been calculated using
the semi-analytic model of
Cole et al. (2000)
is illustrated in
Fig. 6
(Benson et al. 2001a).
Galaxies form mostly
along the filaments delineated by the dark matter. Red
galaxies predominate in the most massive dark matter halos, just as
observed in real galaxy clusters. This segregation is a natural outcome of
hierarchical clustering from CDM initial conditions. It reflects the fact
that the progenitors of rich clusters form substantially earlier than a
typical dark matter halo of the same mass.
Fig. 7 shows the
galaxy luminosity function which describes the abundance of galaxies of
different luminosities. The theoretical predictions, shown by the line,
agree remarkably well with the observations but this should not be regarded
as a spectacular success of the theory because the free parameters in the
semi-analytic star formation and feedback model have been tuned to achieve
as good a match as possible to this specific observational dataset. In
particular, the feedback model has been tuned to produce a relatively flat
function at the faint end.
 |
Figure 7. The galaxy luminosity function. The symbols show the number of galaxies per unit volume and per unit magnitude measured in various surveys, as a function of galaxy magnitude (open circles: Zucca et al. 1997; open squares: Loveday et al. 1992; thick error bars: Norberg et al. 2001b). The solid line shows the predictions of the semi-analytic model of Cole et al. (2000). |
Having fixed the model parameters by reference to a small subset of the
data such as the galaxy luminosity function, we can ask whether the same
model accounts for other basic observational data. The galaxy
autocorrelation function,
 gal(r), in
the simulations is plotted in
Fig. 2 above. On large scales, it
follows
dm(r)
quite closely, but on small scales it dips below the mass autocorrelation
function. This small scale "antibias" has also been seen in
N-body/gasdynamical simulations of the
CDM cosmology
(Pearce et al. 1999,
2001,
Dave et al. 1999),
and in dark matter simulations
that resolve individual galactic halos
(Klypin et al. 1999).
The galaxy autocorrelation function in the simulations of
Benson et al. (2000)
agrees remarkably well with the observational data (see also
Kauffmann et al. 1999a).
This is a genuine success of the theory because no model
parameters have been adjusted in this comparison. The differences
between the small-scale clustering of galaxies and dark matter result
from the interplay between the clustering of dark matter halos and the
occupation statistics of galaxies in halos which, in turn, are
determined by the physics of galaxy formation. This conclusion,
discussed in detail by
Benson et al. (2000),
has led to the development
of an analytic formulation known as the "halo model" (e.g.
Seljak 2000,
Peacock & Smith 2000,
Berlind & Weinberg 2002).
gal(r), in
the simulations is plotted in
Fig. 2 above. On large scales, it
follows
dm(r)
quite closely, but on small scales it dips below the mass autocorrelation
function. This small scale "antibias" has also been seen in
N-body/gasdynamical simulations of the
CDM cosmology
(Pearce et al. 1999,
2001,
Dave et al. 1999),
and in dark matter simulations
that resolve individual galactic halos
(Klypin et al. 1999).
The galaxy autocorrelation function in the simulations of
Benson et al. (2000)
agrees remarkably well with the observational data (see also
Kauffmann et al. 1999a).
This is a genuine success of the theory because no model
parameters have been adjusted in this comparison. The differences
between the small-scale clustering of galaxies and dark matter result
from the interplay between the clustering of dark matter halos and the
occupation statistics of galaxies in halos which, in turn, are
determined by the physics of galaxy formation. This conclusion,
discussed in detail by
Benson et al. (2000),
has led to the development
of an analytic formulation known as the "halo model" (e.g.
Seljak 2000,
Peacock & Smith 2000,
Berlind & Weinberg 2002).
Another genuine prediction of the model is the dependence of the strength
of clustering on the luminosity of different subsamples. It can be seen in
Fig. 6 that the brightest galaxies are
concentrated in the
most massive clusters, leading one to suspect that their autocorrelation
function must be stronger than average. This is indeed the case, as
illustrated in Fig. 8 which compares the
variation of the clustering length (defined as the pair separation for which
(r) = 1) of
galaxy samples of different intrinsic luminosity in the simulations of
Benson et al. (2001a)
with the observational data obtained from the 2dFGRS
by Norberg et al. (2001a).
The agreement between theory and observations is
remarkable considering that there are no adjustble parameters in this
comparison. The reason for the strong clustering of bright galaxies is
related to the colour-density relation seen in
Fig. 6: the
brightest galaxies form in the highest peaks of the density distribution
which, in initially Gaussian fields, are more strongly clustered than
average peaks which produce less extreme galaxies.
 |
Figure 8. The correlation length as a
function of the luminosity of
different galaxy subsamples. The correlation length is defined as
the pair separation for which
|
The patch of model universe illustrated in the top panel of
Fig. 6 is shown at the earlier epoch
corresponding to
redshift z = 3 (when the universe was only about 20% of its current
age) in the bottom panel of this figure. The galaxies are now blue,
reflecting the colour of their younger stellar population. There are
fewer galaxies in this plot than in the z = 0 slice. In fact, this is
the epoch when the first substantial population of bright galaxies
formed in the simulation. As
Baugh et al. (1998)
argued, the properties
of these model galaxies resemble those of the "Lyman-break" galaxies
discovered by
Steidel et al. (1996),
even though different models make
somewhat different predictions for their exact properties
(Somerville et al. 2001).
Most models, however, predict that the brightest galaxies
at z = 3 should be strongly clustered
(Kauffmann et al. 1999b)
and, indeed, the models of
Baugh et al. (1998)
correctly
anticipated that the Lyman-break galaxies would have a clustering
length comparable to that of bright galaxies today
(Adelberger et al. 1998).
This too should be regarded as a significant success of this
kind of modelling in the
CDM cosmology. As
Fig. 6 shows, in contrast to the galaxies, the dark
matter is much more weakly clustered at z = 3 than at z = 0,
indicating that galaxies were strongly biased at birth.