


6.3. The Energy Budget of the BLR
While the individual line ratios are the best indicators for the physical conditions in the BLR clouds, a simple energy conservation argument provides another strong constraint on the models.
Consider optically thick clouds absorbing only ionizing
radiation, and no
reddening by dust. The total energy emitted by the clouds is simply the
energy absorbed by them, which is the product of the ionizing radiation and
the covering factor. Photoionization calculations for the BLR indicate
that the
emitted L flux is
not very different from the "Case B flux" mentioned earlier,
whereby each absorbed ionizing photon results in one L**
photon. In this case
the number of L
photons is the product of the number of ionizing photons
and the covering factor. Combining the two we have a simple
observational way to measure the mean energy of an ionizing photon,
flux is
not very different from the "Case B flux" mentioned earlier,
whereby each absorbed ionizing photon results in one L**
photon. In this case
the number of L
photons is the product of the number of ionizing photons
and the covering factor. Combining the two we have a simple
observational way to measure the mean energy of an ionizing photon,
 (in Ryd.):
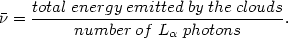
| (63) |
This is a most important information about the shape of the Lyman continuum that cannot be obtained by direct observations of the Lyman continuum.
The integrated flux emitted by the BLR clouds is not easy to measure since
some of it is in broad spectral features, such as the "small
2000-4000Å bump",
the Paschen continuum and several infrared lines. It is estimated to be
5-9 times
the L intensity
which means, according to the above relation,
 4 - 7 Ryd.
To illustrate this further assume that the ionizing continuum is a simple
power-law in energy,
L =
C-
=
C- ,
extending up to a cut-off frequency
cut,
where is in Rydberg and
C is a constant. The mean energy of an ionizing photon is
,
extending up to a cut-off frequency
cut,
where is in Rydberg and
C is a constant. The mean energy of an ionizing photon is
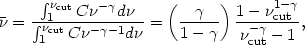
| (64) |
where we have assumed
 1,0. This expression should
be compared with (63) to obtain the value of
. For
example, for cut =
10 Ryd, which is consistent
with the observational constraints mentioned in
chapter 4, we get
0. This
is in conflict with the observations that show a typical observed slope,
at a rest wavelength of 1000Å, of about
= 0.6 and
an even steeper slope at shorter
wavelengths. The discrepancy has been named "the energy budget problem".
1,0. This expression should
be compared with (63) to obtain the value of
. For
example, for cut =
10 Ryd, which is consistent
with the observational constraints mentioned in
chapter 4, we get
0. This
is in conflict with the observations that show a typical observed slope,
at a rest wavelength of 1000Å, of about
= 0.6 and
an even steeper slope at shorter
wavelengths. The discrepancy has been named "the energy budget problem".
There are several suggested solutions to this problem. First, only the soft
(
 10 Ryd) Lyman
continuum photons have been considered here while high
energy photons are observed in almost all AGNs. Such photons hardly interact
with the gas unless the column density is much greater than
1023 cm-2. Very
thick clouds have been suggested, in which a large fraction of the high
energy
continuum is absorbed by the gas. Thick clouds can also absorb the infrared
continuum, which helps too. Second, the models may be wrong, in particular
the assumption about the number of
L photons and its
relation to the
ionizing flux. Also, the observed lines may come from two distinct parts
of the BLR
(the surface of the central disk?). Third, the above argument makes use
of the
intrinsic properties of AGNs, but the observed fluxes may be different
from the intrinsic fluxes. For example, reddening by dust can change the
observed line ratio and the inferred mean photon energy. None of these
explanations is entirely satisfactory and it is likely that the real
solution involves some combination of all.
10 Ryd) Lyman
continuum photons have been considered here while high
energy photons are observed in almost all AGNs. Such photons hardly interact
with the gas unless the column density is much greater than
1023 cm-2. Very
thick clouds have been suggested, in which a large fraction of the high
energy
continuum is absorbed by the gas. Thick clouds can also absorb the infrared
continuum, which helps too. Second, the models may be wrong, in particular
the assumption about the number of
L photons and its
relation to the
ionizing flux. Also, the observed lines may come from two distinct parts
of the BLR
(the surface of the central disk?). Third, the above argument makes use
of the
intrinsic properties of AGNs, but the observed fluxes may be different
from the intrinsic fluxes. For example, reddening by dust can change the
observed line ratio and the inferred mean photon energy. None of these
explanations is entirely satisfactory and it is likely that the real
solution involves some combination of all.
A somewhat related problem is the ratio of the high and low excitation
lines. Generally speaking, much of the "soft" ionizing flux
(
20 Ryd.) is converted
to recombination and high ionization lines, while the harder photons,
that can
penetrate much deeper, are converted to low excitation lines. It can thus be
argued that the flux ratio of high to low ionization lines is a measure
of the flux
at different wavelengths. One can use it to formulate a "second order energy
budget problem" related to the fact that the observed low excitation
lines of MgII and FeII are too strong relative to
H . This cannot be solved by reddening
but the argument is based, to a large extent, on the observed FeII
lines, that are not well understood.
. This cannot be solved by reddening
but the argument is based, to a large extent, on the observed FeII
lines, that are not well understood.
There are other methods for estimating the shape of the ionizing continuum.
In particular, the equivalent width (EW) of the recombination lines can be
used for that. For example, the "Case B"
L equivalent
width, for a system of
optically thick clouds with a covering factor C(r), around the
above power-law continuum, is:
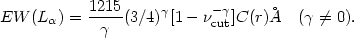
| (65) |
A similar ratio can be calculated for
EW(HeII 1640),
where the integration in
this case is for
1640),
where the integration in
this case is for
 4Ryd. The observed
EW of these two lines can be compared
with this theoretical prediction in order to estimate the continuum
slope around 1-4 Ryd. Alternatively, the EW of the HeII lines, combined
with an assumption on the covering factor, can be used to estimate
L(1640Å)
/ L(228Å)
etc. These arguments cannot be simply used in the disk-like geometry
mentioned in chapter 5.
4Ryd. The observed
EW of these two lines can be compared
with this theoretical prediction in order to estimate the continuum
slope around 1-4 Ryd. Alternatively, the EW of the HeII lines, combined
with an assumption on the covering factor, can be used to estimate
L(1640Å)
/ L(228Å)
etc. These arguments cannot be simply used in the disk-like geometry
mentioned in chapter 5.