


9.3. Observed Line Profiles
The large diversity in line profiles has already been demonstrated in
chapter 2 and several more examples are given in
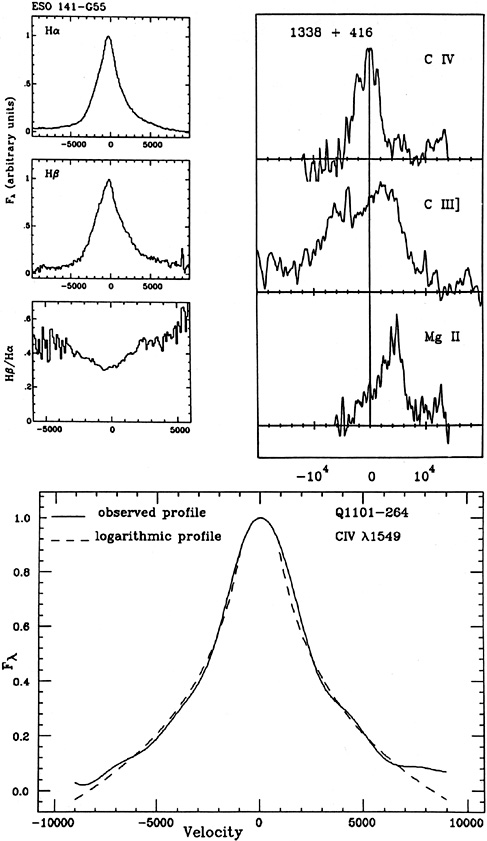
Fig. 23. The broad line profiles of
many objects are smooth and symmetric. Their shape is well fitted, in many
cases, by a logarithmic function
(E
 -log
| -
0|, see
Fig. 23). Profile
differences can be large or small. There are cases of almost identical
profiles for
lines of very different excitation. A likely explanation here is that
the emission
line spectrum of all clouds is the same. There are opposite examples
too, and
a clear trend is still to be found. It has been claimed that the high
excitation
lines are systematically broader than the low excitation lines, but
there are
definitely some exceptions to that. One common trend is observed between
the H
-log
| -
0|, see
Fig. 23). Profile
differences can be large or small. There are cases of almost identical
profiles for
lines of very different excitation. A likely explanation here is that
the emission
line spectrum of all clouds is the same. There are opposite examples
too, and
a clear trend is still to be found. It has been claimed that the high
excitation
lines are systematically broader than the low excitation lines, but
there are
definitely some exceptions to that. One common trend is observed between
the H and
H
and
H line
profiles, where the latter is relatively stronger away from
the line center (see diagram). Another trend is for the
HeI5876 line to be
somewhat broader than
H.
line
profiles, where the latter is relatively stronger away from
the line center (see diagram). Another trend is for the
HeI5876 line to be
somewhat broader than
H.
|
Figure 23. Observed broad line
profiles. Bottom: A symmetric
CIV |
Broad, asymmetric lines are seen in many objects, but no clear tendency for the blue or the red wing to be stronger. Some line profiles are bumpy, and their shape varies in time. The best known examples are some steep spectrum radio sources whose line profiles are extremely broad and disturbed. It has been suggested that the lines are emitted in an edge-on, disk-like system, with axis parallel to the direction of the radio jet.
Finally, there is a clear tendency for the high excitation lines in luminous AGNs to be systematically blue-shifted relative to the low excitation lines. The effect can be large, up to 3000 km s-1, and seems to increase with luminosity. The few detailed studies of this phenomenon suggest that the systemic redshift is given by the low excitation lines. An example is shown in Fig. 23.
As for the narrow lines, the profiles are smooth with a clear tendency for the blue wing of some lines to be stronger. The blue asymmetry is most noticeable in lines of higher excitation and/or critical de-excitation density. This part of the line originates in high density, fast moving NLR clouds. The phenomenon is observed in most Seyfert 1 and Seyfert 2 galaxies.