


The interpretation of what we are seeing is straightforward. The portion of a galaxy projecting onto a pixel might have ni stars of luminosity Li (Figure 4).
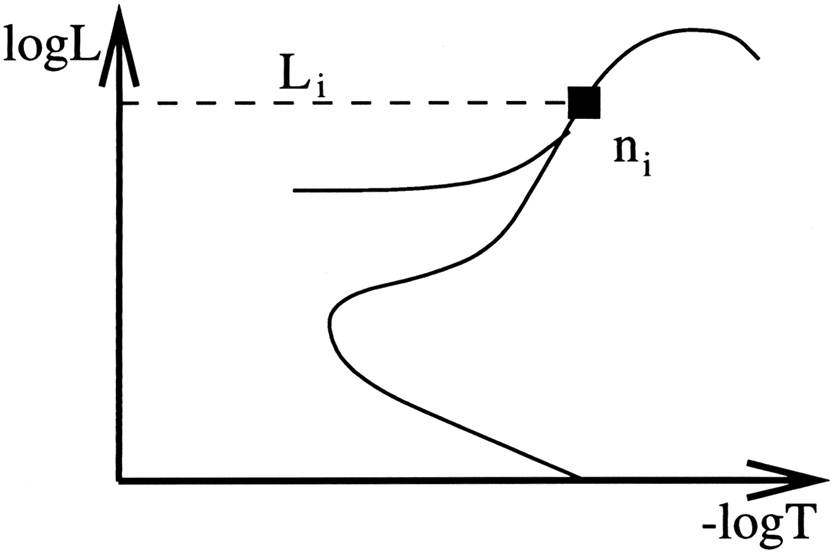 |
Figure 4. An HR diagram, showing a contributor to the SBF sum. |
Over many samples, Poisson statistics imply that each star contributes a
luminosity variance of Li2, so the total
luminosity variance is
 2 =
2 =
 ni
Li2. The mean total luminosity
within the pixel is just
g =
niLi, so we are therefore
measuring the second moment of the luminosity function divided by the first:
ni
Li2. The mean total luminosity
within the pixel is just
g =
niLi, so we are therefore
measuring the second moment of the luminosity function divided by the first:
 |
(2.3) |
 varies as a function of
color, and depends on stellar population. It is therefore not a
perfect "standard candle" (although its total range of variation is much
less than most
objects which are called standard candles!), but it does vary in a
predictable way. We
have concentrated on the I band because the original models we
calculated using the Revised Yale Isochrones indicated that:
varies as a function of
color, and depends on stellar population. It is therefore not a
perfect "standard candle" (although its total range of variation is much
less than most
objects which are called standard candles!), but it does vary in a
predictable way. We
have concentrated on the I band because the original models we
calculated using the Revised Yale Isochrones indicated that:
 is the brightest
 in the optical.
is nearly a
one-parameter family.
has a very small
scatter with respect to its trend with (V - I).
has a very small
overall variation with population.
in the optical.
is nearly a
one-parameter family.
has a very small
scatter with respect to its trend with (V - I).
has a very small
overall variation with population.
Worthey has subsequently computed better models which confirm items 1-3
above, but we have found that the slope of
I is steeper
than we had thought, with a total
change of about 1 mag over the full range of early-type galaxy stellar
population. His
models are illustrated in Figure 5. Note how the
age and metallicity are
degenerate in the optical, but become distinct in the IR.
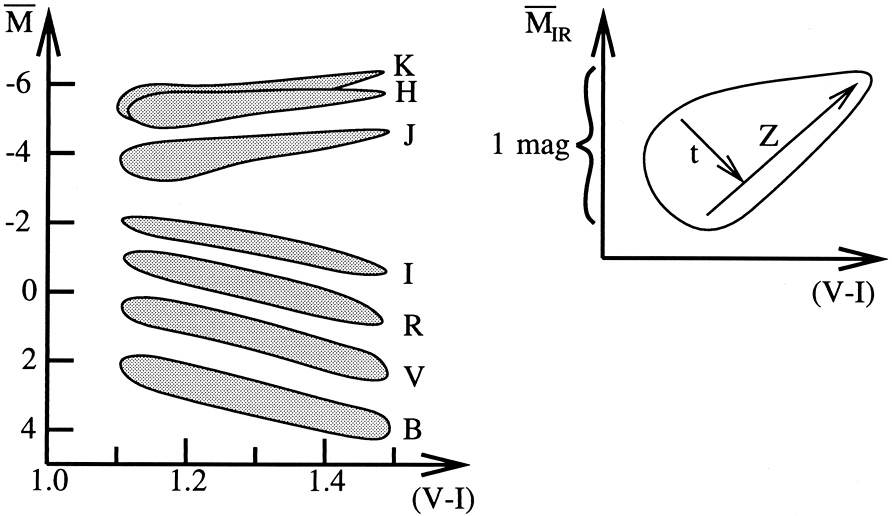 |
Figure 5. SBF luminosity derived from theoretical models (left) and a blowup of how SBF depends on metallicity and age in the IR. |
There is an abrupt change in the behavior of
in the IR, which
arises because the
stars at the tip of the RGB, which have the highest bolometric
luminosity, are shrouded
in the optical and have a lower flux in the optical than stars lower
down the RGB. The IR is potentially better for SBF but
To summarize the SBF method then, the measurement is repeatable and
perfectible.
Given a suitable system and sufficient photons, resolution, and
calibration, it is possible
to measure  to arbitrary
accuracy, certainly better than 10 percent. The interpretation
also has a solid foundation. Models of stellar populations depend on
metallicity, age,
IMF, post-RGB evolution, etc. The constraints we can measure include
distance independent quantities such as colors, fluctuation colors, and
line strengths. If the distance
is known, we can add to this list fluctuation absolute magnitudes as
well. The models
and constraints meet in a library of isochrones which are combined to
form a luminosity
function and spectral energy distribution. Integration of the SED yields
. Both
empirical and theoretical work in the I band at least indicates that
I can be
constrained to
to arbitrary
accuracy, certainly better than 10 percent. The interpretation
also has a solid foundation. Models of stellar populations depend on
metallicity, age,
IMF, post-RGB evolution, etc. The constraints we can measure include
distance independent quantities such as colors, fluctuation colors, and
line strengths. If the distance
is known, we can add to this list fluctuation absolute magnitudes as
well. The models
and constraints meet in a library of isochrones which are combined to
form a luminosity
function and spectral energy distribution. Integration of the SED yields
. Both
empirical and theoretical work in the I band at least indicates that
I can be
constrained to
 0.05 mag by
measurement of just the (V - I) color.
0.05 mag by
measurement of just the (V - I) color.