Copyright © 1997 by Annual Reviews. All rights reserved
| Annu. Rev. Astron. Astrophys. 1997. 35:
389-443 Copyright © 1997 by Annual Reviews. All rights reserved |


5.2. The Hubble Deep Field
The Hubble Deep Field (HDF) project (Williams et al 1996) and related Keck spectroscopic programs (Steidel et al 1996c, Illingworth et al 1996, Cohen et al 1996, Lowenthal et al 1997) have already given a tremendous boost to studies of the universe beyond the limits of the 4-m telescope redshift surveys. The investment of a large amount of HST Director's Discretionary time enabled the first comprehensive multicolor study of a deep field with WFPC-2. The relatively poor efficiency of HST blueward of 500 nm had previously prevented even the most adventurous workers from attempting deep UV and blue imaging in normal guest observer allocations. Furthermore, the public availability of the HDF image has led to a rapid delivery of scientific results concerning the nature and redshift distribution of galaxies well beyond spectroscopic limits.
The most striking result, from a consideration of the high surface
density of B = 28 galaxies in ground-based data (cf
Metcalfe et al 1995b,
1996)
(Figure 5a), is the large
fraction of blank sky in the HDF image. This simple observation
reflects the fact that the bulk of the I > 25 population has very small
angular sizes, continuing trends identified first in the MDS
(Mutz et al 1994
Roche et al 1996a). Another result that represents a continuation of MDS
work is the increasing proportion of faint irregular structures from I =
22 to I = 25
(Abraham et al 1996a).
Although the widely distributed HDF color images emphasize irregularity via
blue features that sample the rest-frame UV, the morphological analysis of
Abraham et al is based on the F814W image, which, at z
 1-1.5, is equivalent
to rest-frame U or B. Beyond I = 25, the resolution is insufficient for
detailed study; indeed,
Colley et al (1996)
raise the important question of the definition of a galaxy in this regime.
The small angular sizes and high abundance compared to z < 1 LF
estimators, together with the declining slope of the counts
(Figure 5a), suggest that many
of these sources may be subgalactic components at an early stage of
formation.
1-1.5, is equivalent
to rest-frame U or B. Beyond I = 25, the resolution is insufficient for
detailed study; indeed,
Colley et al (1996)
raise the important question of the definition of a galaxy in this regime.
The small angular sizes and high abundance compared to z < 1 LF
estimators, together with the declining slope of the counts
(Figure 5a), suggest that many
of these sources may be subgalactic components at an early stage of
formation.
The availability of images in four passbands, supplemented by deep ground-based data at infrared wavelengths (Cowie 1996), has led to a surge of interest in estimating redshifts from colors. In its most elementary form, a set of discontinuities (Lyman or Ca II 4000-Å break) is located in individual galaxies via imaging through a set of filters. The HDF observing strategy was chosen to extend earlier work by Guhathakurta et al (1990), Steidel & Hamilton (1992) and isolate those sources whose Lyman limit discontinuities are redshifted into the optical. Similar techniques have also been used via ground-based images to detect higher redshift sources around QSOs (Giallongo et al 1996). The validity of the technique is reviewed comprehensively by Madau et al (1996) in the context of what is known about the UV SEDs of galaxies and the attenuation of UV light by intervening HI clouds. They claim the strategy is robust to quite considerable uncertainties in the precise shape of the SEDs near the Lyman limit and possible effects of dust.
Lists of candidate high z galaxies in the HDF selected on the basis of
the Lyman discontinuity were first published by
Abraham et al (1996a),
Clements & Couch
(1996),
but most of the progress has been achieved through spectroscopic
exploitation of the technique in the HDF and other fields using the Keck
telescope
(Steidel et al 1996a,
b,
1997,
Giavilisco et al 1996,
Lowenthal et al 1997).
The spectra demonstrate a success rate of 100% for the selection of high
z sources using the Lyman limit; not a single redshift has been confirmed
outside the expected range. The Keck surveys are still in progress but
already
provide a significant constraint on the proportion of R < 25 star-forming
galaxies beyond z = 2.3 (the redshift corresponding to the limit entering
the F300W filter). These results have offered a valuable glimpse at the
nature of a population of galaxies with 2.3 < z < 3.5, and perhaps
the most significant results are their relatively modest star-formation
rates (SFR, 1-6 Mo year-1) and volume densities
comparable to those of local L* galaxies
( 8 ×
10-4 h3 Mpc-3)
(Steidel et al 1996a,
b,
Madau et al 1996).
(However, note that these figures refer to a
 = 1,
= 1,
 = 0 world model
and would be much larger if
<< 1.) Comparable SFR for high z galaxies have been estimated from
independent studies by
Ebbels et al (1996),
Djorgovski et al
(1996),
Hu & McMahon (1996).
The weak emission lines in these high z star-forming galaxies may explain
the null results of many years of primeval galaxy searching based on the
assumption of intense photoionized Lyman
= 0 world model
and would be much larger if
<< 1.) Comparable SFR for high z galaxies have been estimated from
independent studies by
Ebbels et al (1996),
Djorgovski et al
(1996),
Hu & McMahon (1996).
The weak emission lines in these high z star-forming galaxies may explain
the null results of many years of primeval galaxy searching based on the
assumption of intense photoionized Lyman
 emission
(Djorgovski & Thompson
1992).
emission
(Djorgovski & Thompson
1992).
A minimum signal-to-noise ratio in the UV-optical SED is required to convincingly detect the presence or otherwise of the Lyman limit, and thus the question remains as to whether a larger fraction of the sources fainter than R = 25 have higher redshift. As the longest wavelength band (F814W) still samples the rest-frame UV at z > 4, only star-forming objects above some threshold can be visible at high z in the HDF. To eliminate a large population of sources with low SFR would require K-band imaging to much deeper limits than are currently possible (Cowie 1996, Moustakas et al 1997).
The multicolor HDF data has also been analyzed by numerous workers with respect to various template SEDs in an attempt to secure statistical redshift distributions (Table 2). The critical uncertainty in these studies is the form of the UV SED sampled by the optical HDF data for z > 2. Lanzetta et al (1996) grafted large aperture optical SEDs from Coleman et al (1980) with much smaller aperture UV data from Kinney et al (1996), whereas the other workers generally adopted model SEDs in the UV. Gwyn & Hartwick (1996) used model SEDs throughout. With the exception of Gwyn & Hartwick, all fitting thus far was done on the basis of present-day SEDs in the (unjustified) hope that an evolving SED must somehow move along the locus of those observed today. Although Bershady (1995) discussed this assumption in the context of six-color low z data, it remains unclear what systematic effects this will have at high z with four-color data sampling the UV.
| Reference | Magnitude limit | Template SED |
| Gwyn & Hartwick (1996) | I814 < 28 | Bruzual-Charlot models |
| Lanzetta et al (1996) | I814 < 28 | z = 0 observed + Ly 1
1 |
| Mobasher et al (1996) | I814 < 28 | z = 0 observed |
| Sawicki et al (1997) | I814 < 27 | z = 0 observed + UV models +
Ly |
| Cowie (1996) | H + K < 22.5 | z = 0 observed |
| 1 Lyman limit. | ||
A further difference among the observers is the aperture they have used to measure the colors. Sawicki et al (1997) determined an "optimum aperture" that varies for each source; Gwyn & Hartwick (1996) used a fixed aperture of 0.2 arcsec, whereas Mobasher et al (1996) experimented with apertures of 0.5-3 arcsec depending on magnitude. Given the signal/noise and irregular structure of the images, it seems reasonable to expect that the results obtained may depend on the chosen aperture (FDA Hartwick, private communication).
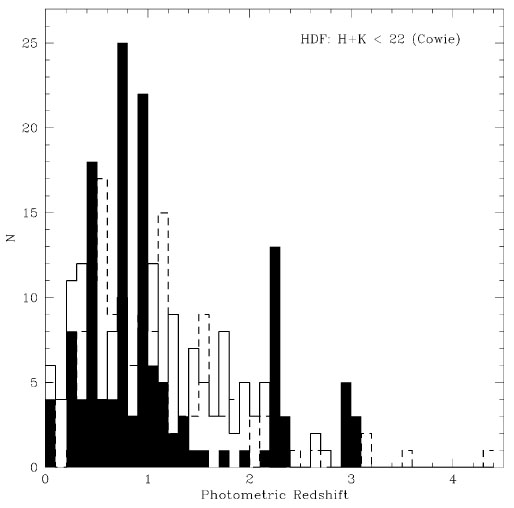
As an illustration of the uncertainties arising from analyses that differ only in the aperture, fitting algorithm, and template SEDs used, the redshift estimates of Mobasher et al (1996), Lanzetta et al (1996), Cowie (1996) are compared in Figure 9. Cowie (1996) tabulates redshifts for a significant sample of K < 20 galaxies from the compilations of groups at the California Technical Institute (Caltech) and the University of Hawaii. When compared with the photometric redshifts, the agreement is only satisfactory for the optical + infrared data analyzed by Cowie; a surprising fraction of spectroscopically confirmed low z galaxies are considered to be at high z by Lanzetta et al (Figure 9). Nonetheless, for the H + K < 22 sample discussed by Cowie (1996), the distribution of photometric redshifts obtained by Mobasher et al and Lanzetta et al are quite similar (Figure 9). Cowie's distribution reveals a somewhat unphysical gap for 1 < z < 2, with what seems like an artificial peak coincident with the location of the Lyman limit at the F300W filter.
 |
 |
 |
 |
Figure 9. A study of various photometric redshift catalogs available for the HDF (see Table 2). (a) Photometric redshifts for three groups compared with currently available Keck spectroscopic values. Note that Cowie's (1996) estimates take advantage of deep infrared photometry. (b) Distribution of photometric redshifts to a limit of H + K < 22 [Cowie: filled, Lanzetta et al (1996): solid line, Mobasher et al (1996): dashed line]. (c) A comparison of photometric redshifts to I < 26. (d) Distribution of photometric redshifts to I < 26 (Mobasher et al: shaded, Lanzetta et al: solid line). |
|
I = 26 is a convenient deeper limit, as
it represents that faintest I magnitude at which the signal-to-noise ratios
for virtually all sources exceed
3 in F300W.
Figure 9 compares the redshift estimates of
Mobasher et al
(1996),
Lanzetta et al (1996)
to this limit. Systematic differences are clearly present with effects
similar to those seen in Figure 9. Nonetheless,
again the overall distributions agree remarkably well
(Figure 9).
Of course, agreement between the various workers does not necessarily imply
that the results are correct. Systematic errors could be introduced by the
effects of dust, inaccurate UV SED slopes, or very strong emission lines.
In this context, that the mean slope of the rest-frame UV SED for the
Steidel et al (1996b)
galaxies with z > 2.3 is less steep than the models predict is worrisome.
Dust appears to be an unlikely explanation given the weak HI
content. However,
in delineating the overall fraction of faint galaxies with z < 1, 2, and
3, the photometric redshift techniques appear to give sensible results.
in F300W.
Figure 9 compares the redshift estimates of
Mobasher et al
(1996),
Lanzetta et al (1996)
to this limit. Systematic differences are clearly present with effects
similar to those seen in Figure 9. Nonetheless,
again the overall distributions agree remarkably well
(Figure 9).
Of course, agreement between the various workers does not necessarily imply
that the results are correct. Systematic errors could be introduced by the
effects of dust, inaccurate UV SED slopes, or very strong emission lines.
In this context, that the mean slope of the rest-frame UV SED for the
Steidel et al (1996b)
galaxies with z > 2.3 is less steep than the models predict is worrisome.
Dust appears to be an unlikely explanation given the weak HI
content. However,
in delineating the overall fraction of faint galaxies with z < 1, 2, and
3, the photometric redshift techniques appear to give sensible results.
Several key points have emerged from these early studies.
First, notwithstanding the uncertainties, both the lensing and HDF
photometric redshift data point to a low mean redshift
(z 1-2) for the I
26 population. The addition of near-infrared photometry to the HDF data
appears to make the agreement with the lensing results even more
convincing (Connolly et al 1997).
Second, there is the small physical size (2-4 h-1
kpc) of the faint star-forming population. Given that the bulk of the
integrated
light in the number counts arises from brighter systems with z < 1
(Section 3.1), the faint population beyond
the number count break appears to represent
an era of initial star formation at modest redshift z < 2. The complex
morphology of many of the higher z luminous systems
(Abraham et al 1996a,
Giavilisco et al
1996),
and the large ages inferred for spheroidal populations, at least in
clusters
(Bower et al 1992,
Ellis et al 1996b),
supports the suggestion that bulges form early and disk galaxies
assemble by gradual infall and accretion
(Cowie 1988,
Baugh et al 1996).
Specific cases where galaxies may be assembling in this way at high
redshift have been proposed by
Pascarelle et al (1996).
However, as with the z < 1 data, to make the connection with local systems, some reliable stable physical property such as mass is required. In fact, little is presently known about the dynamics of the most distant systems. Attempts to estimate masses from absorption line profiles are limited by a poor understanding of whether line broadening is due to shocks or turbulent motions. Examination of gravitationally magnified samples (cf Yee et al 1996, Ebbels et al 1996, Williams & Lewis 1996) will be particularly profitable as the boost of 2-3 mag will enable very detailed line studies.