Copyright © 1996 by Annual Reviews. All rights reserved
| Annu. Rev. Astron. Astrophys. 1996. 34:
461-510 Copyright © 1996 by Annual Reviews. All rights reserved |


Given that the most reliable indicator of a globular cluster's age is its turnoff luminosity, the determination of precise distances to these systems is arguably the single most crucial observational input into the evaluation of accurate ages (see, e.g. Renzini 1991, Chaboyer 1995, Bolte & Hogan 1995). Nearly everything that we know about GC distances is based on two standard candles - namely, the nearby subdwarfs and the RR Lyrae variable stars. Thanks to the development of the Hubble Space Telescope (HST), we will soon be able to add white dwarfs to this very short list. These stars have the advantage of being essentially free of metallicity and convection complications (cf Fusi Pecci & Renzini 1979), and local white dwarf calibrators are much more numerous than subdwarfs. Although we can anticipate that the fitting to white dwarf cooling sequences will involve a number of difficulties (some unanticipated), it is encouraging that the first HST results, for M4 by Richer et al (1995), indicate a distance very similar to the one adopted by Richer & Fahlman (1984) on the assumption that MV(HB) = 0.84. These results lead to their determination of an age of 13-15 Gyr for this cluster. We also recognize the potential of direct astrometric methods (see Cudworth & Peterson 1988, Rees 1992) and the existence of a number of other approaches (e.g. using the RGB tip magnitude) to constrain cluster distances. We, however, restrict the present discussion to the two classical distance calibrators.
The nearby subdwarfs - metal-poor stars with halo kinematics whose orbits have brought them near enough to the Sun for them to have measurable trignometric parallaxes - play two critical roles in the measurement of GC ages. First, with well-determined values of MV, these objects provide a direct test of the model predictions for the position of the zero-age main-sequence as a function of [Fe/H] in the low-metallicity regime. Second, under the (testable) assumption that the subdwarfs are local versions of the unevolved main-sequence stars in globular clusters, they can be used to tie the cluster distances directly into the most reliable distance scale that exists in extra-Solar-system astronomy (that defined by trignometric parallaxes).
The recognition of the importance of the subdwarfs and
of their relation to the RR Lyraes and the halo GCs is itself an interesting
story (see the review by
Sandage 1986).
An important landmark was
Sandage's (1970)
identification of eight subdwarfs with sufficiently good
 measures for them to be useful for deriving the distances to GCs. He also
used them to calibrate the absolute magnitude of the horizontal branch at
the position of the instability strip in M3, M15, and M92.
Carney (1979),
Laird, Carney &
Latham (1988)
improved the [Fe/H] determinations of that sample. In the pre-CCD era of
photometry, however, the subdwarfs were of limited usefulness for
establishing the Population II distance scale because of fairly large
random and (in retrospect)
scale errors in the measurement of faint main-sequence cluster stars [see,
e.g. Figure 4 in
Fahlman, Richer &
VandenBerg (1985)
and Figure 30 in
Stetson & Harris
(1988)].
CMDs derived from CCD data, beginning in the mid-1980s, made the adoption
of a subdwarf-based distance scale a much more viable alternative to purely
HB-based distance estimates. With CCDs and 4-m telescopes, the main
sequences of nearby clusters could be defined very accurately down to
MV ~ 10 (e.g. see Figure 36 in
Stetson & Harris
1988).
In the CCD era, the limiting factors in the derivation of cluster distances
via subdwarf fitting became the scatter in the Population II main-sequence
fiducial defined by the subdwarfs and the lingering uncertainties in the
reddening and color calibrations of the cluster data.
measures for them to be useful for deriving the distances to GCs. He also
used them to calibrate the absolute magnitude of the horizontal branch at
the position of the instability strip in M3, M15, and M92.
Carney (1979),
Laird, Carney &
Latham (1988)
improved the [Fe/H] determinations of that sample. In the pre-CCD era of
photometry, however, the subdwarfs were of limited usefulness for
establishing the Population II distance scale because of fairly large
random and (in retrospect)
scale errors in the measurement of faint main-sequence cluster stars [see,
e.g. Figure 4 in
Fahlman, Richer &
VandenBerg (1985)
and Figure 30 in
Stetson & Harris
(1988)].
CMDs derived from CCD data, beginning in the mid-1980s, made the adoption
of a subdwarf-based distance scale a much more viable alternative to purely
HB-based distance estimates. With CCDs and 4-m telescopes, the main
sequences of nearby clusters could be defined very accurately down to
MV ~ 10 (e.g. see Figure 36 in
Stetson & Harris
1988).
In the CCD era, the limiting factors in the derivation of cluster distances
via subdwarf fitting became the scatter in the Population II main-sequence
fiducial defined by the subdwarfs and the lingering uncertainties in the
reddening and color calibrations of the cluster data.
Table 1 contains our compilation of relevant data
for all stars in the 1991 edition of the Yale Trigonometric Parallax
Catalogue with  /
< 0.5 and spectroscopic
measures of [Fe/H]
/
< 0.5 and spectroscopic
measures of [Fe/H]  -1.3. This list includes the original eight stars from
Sandage (1970)
minus HD 140283, which appears to be an evolved star
(Magain 1989,
Dahn 1994),
plus an additional eight stars, which generally have large
values. The tabulated
values were taken from the Yale Catalogue; the apparent colors and
magnitudes are from the compilation given in the Hipparcos Input Catalogue
(Turon et al 1992).
The absolute magnitudes were calculated from the usual equation:
MV = V + 5 +
5log().
Because trignometric parallax measurements are subject to a Malmquist-like
bias, arising from the coupling of the measuring errors with the steep slope
of the true parallax distribution, there is a tendency for the observed
parallaxes to be larger than their actual values. (This is true in the
statistical sense
for entire catalogues as well as for individual measurements.) The resultant
so-called Lutz-Kelker (or L-K) corrections
(Lutz & Kelker
1973)
were determined to compensate for this effect. To be specific, we have
applied the correction
-1.3. This list includes the original eight stars from
Sandage (1970)
minus HD 140283, which appears to be an evolved star
(Magain 1989,
Dahn 1994),
plus an additional eight stars, which generally have large
values. The tabulated
values were taken from the Yale Catalogue; the apparent colors and
magnitudes are from the compilation given in the Hipparcos Input Catalogue
(Turon et al 1992).
The absolute magnitudes were calculated from the usual equation:
MV = V + 5 +
5log().
Because trignometric parallax measurements are subject to a Malmquist-like
bias, arising from the coupling of the measuring errors with the steep slope
of the true parallax distribution, there is a tendency for the observed
parallaxes to be larger than their actual values. (This is true in the
statistical sense
for entire catalogues as well as for individual measurements.) The resultant
so-called Lutz-Kelker (or L-K) corrections
(Lutz & Kelker
1973)
were determined to compensate for this effect. To be specific, we have
applied the correction  MV =
-5.43( /
)2
- 25.51( /
)4, according to
the formulation of
Hanson (1979),
who used the distribution of proper motions of objects in the parallax
catalogues to estimate the magnitudes of the L-K corrections. This
expression for
MV is strictly valid only for
/
< 0.33. (The
always-negative L-K corrections are added to the MV
values because the true luminosities are larger than the uncorrected
estimates.)
MV =
-5.43( /
)2
- 25.51( /
)4, according to
the formulation of
Hanson (1979),
who used the distribution of proper motions of objects in the parallax
catalogues to estimate the magnitudes of the L-K corrections. This
expression for
MV is strictly valid only for
/
< 0.33. (The
always-negative L-K corrections are added to the MV
values because the true luminosities are larger than the uncorrected
estimates.)
| ID | [Fe/H] | V | B - V | (") |
(") |
MV |
(MV) |
MV(L-K) | (B - V)-2.14 |
| HD 7808 | -1.78 | 9.746 | 1.008 | 0.0663 | 0.0126 | 8.854 | 0.412 | 8.624 | 0.974 |
| HD 19445 | -2.08 | 8.053 | 0.475 | 0.0252 | 0.0052 | 5.060 | 0.448 | 4.783 | 0.471 |
| HD 25329 | -1.34 | 8.506 | 0.863 | 0.0548 | 0.0047 | 7.200 | 0.186 | 7.159 | 0.800 |
| HD 64090 | -1.73 | 8.309 | 0.621 | 0.0405 | 0.0023 | 6.346 | 0.123 | 6.328 | 0.591 |
| HD 74000 | -2.20 | 9.62 | 0.43 | 0.0155 | 0.0048 | 5.572 | 0.672 | 4.816 | 0.434 |
| HD 84937 | -2.12 | 8.324 | 0.421 | 0.0280 | 0.0064 | 5.560 | 0.496 | 5.206 | 0.420 |
| HD 103095 | -1.36 | 6.442 | 0.754 | 0.1127 | 0.0016 | 6.702 | 0.031 | 6.701 | 0.693 |
| HD 134439 | -1.4 | 9.066 | 0.770 | 0.0365 | 0.0025 | 6.877 | 0.149 | 6.851 | 0.714 |
| HD 134440 | -1.52 | 9.445 | 0.850 | 0.0365 | 0.0025 | 7.256 | 0.149 | 7.230 | 0.804 |
| HD 149414 | -1.39 | 9.597 | 0.736 | 0.0281 | 0.0035 | 6.841 | 0.270 | 6.750 | 0.679 |
| HD 194598 | -1.34 | 8.345 | 0.487 | 0.0194 | 0.0014 | 4.784 | 0.157 | 4.755 | 0.424 |
| HD 201891 | -1.42 | 7.370 | 0.508 | 0.0325 | 0.0027 | 4.929 | 0.180 | 4.891 | 0.462 |
| HD 219617 | -1.4 | 8.160 | 0.481 | 0.0280 | 0.0055 | 5.396 | 0.426 | 5.148 | 0.431 |
| BD+66 268 | -2.06 | 9.912 | 0.667 | 0.0216 | 0.0026 | 6.584 | 0.261 | 6.500 | 0.661 |
| BD+11 4571 | -3.6 | 11.170 | 1.060 | 0.0316 | 0.0047 | 8.668 | 0.323 | 8.536 | 1.080 |
The last column in Table 1 contains the predicted color that each star would have if its metallicity were [Fe/H] = -2.14 (chosen to illustrate the subdwarf-fitting procedure for the specific case of M92). At a fixed mass, main-sequence stars of different [Fe/H] will encompass a range in color and MV; consequently, to define a fiducial for distance determinations by the main-sequence fitting technique using subdwarfs, it has become common practice to derive a mono-metallicity subdwarf sequence. This is obtained by correcting the color of each subdwarf, at its observed MV, by the difference between the predicted colors of stars with the [Fe/H] of the subdwarf and that of the cluster itself. Thus, the model colors are used only differentially. Bi-cubic interpolation through a table of B - V colors at different [Fe/H] and MV values, generated from the Bergbusch & VandenBerg (1992) isochrones, was used to generate the color corrections: These take into account the dependence of radius on metallicity at fixed luminosity as well as purely atmospheric line blanketing effects.
Figure 7 shows how well 16 Gyr,
[ /Fe] = 0.3 isochrones
for [Fe/H] = -1.31, -1.71, and -2.14 (from
VandenBerg et al 1996
5)
coincide with the positions of the local subdwarfs on the
color-magnitude plane. We have plotted all of the stars in
Table 1
(specifically, the data in the fourth, eighth, and ninth columns) whose
metallicities fall within ± 0.15 dex of the isochrone [Fe/H]
values. The agreement is about as good as one could hope for. Note, in
particular, how well the models satisfy
the constraint provided by the best of the subdwarfs (HD 103095, also called
Groombridge 1830) and that the lower metal abundance subdwarfs tend to be
displaced from those of higher Z in roughly the direction and
amount suggested by the theory.
/Fe] = 0.3 isochrones
for [Fe/H] = -1.31, -1.71, and -2.14 (from
VandenBerg et al 1996
5)
coincide with the positions of the local subdwarfs on the
color-magnitude plane. We have plotted all of the stars in
Table 1
(specifically, the data in the fourth, eighth, and ninth columns) whose
metallicities fall within ± 0.15 dex of the isochrone [Fe/H]
values. The agreement is about as good as one could hope for. Note, in
particular, how well the models satisfy
the constraint provided by the best of the subdwarfs (HD 103095, also called
Groombridge 1830) and that the lower metal abundance subdwarfs tend to be
displaced from those of higher Z in roughly the direction and
amount suggested by the theory.
 |
Figure 7. Comparison of the
CMD locations of the nearby subdwarfs, whose properties are in the
fourth, eighth, and ninth columns of Table 1, with
VandenBerg et al
(1996)
isochrones. The closed circles, open circle, and closed triangles represent
those subdwarfs whose tabulated [Fe/H] values are within ± 0.15
dex of those of the three isochrones; namely, -1.31, -1.71, and
-2.14, respectively. All of the isochrones assume
[ |
A main-sequence fit of M92 to the subdwarfs, using the data in the
eighth, ninth, and tenth columns of Table 1 for
those stars with
(MV)
< 0.3 mag, is illustrated in Figure 8. When a
foreground reddening of 0.02 mag (see
Stetson & Harris
1988)
is assumed, an apparent distance modulus of 14.65 mag is obtained. The
VandenBerg et al
(1996)
isochrones, for the indicated parameters, have simply been overlayed on this
figure, i.e. no color adjustments of any kind have been applied to them.
[Their temperature and color scales are very close to those of the
Bergbusch &
VandenBerg (1992)
calculations, which were used to produce the B - V data in
the last column of our table.] One has the impression that
a small redward color shift should be applied to the isochrones at the
fainter magnitudes, but what differences exist are clearly small.
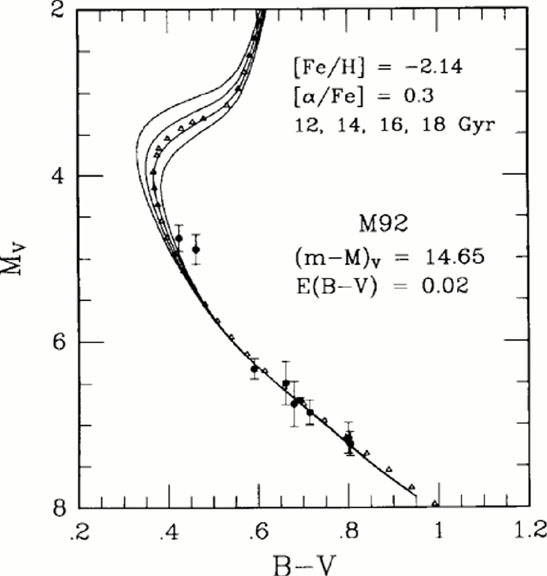 |
Figure 8. Main-sequence fit of the
Stetson & Harris
(1988)
M92 main-sequence fiducial (open triangles) to the subdwarfs
(closed circles), after the colors of the latter have been
adjusted to compensate for differences between their [Fe/H] values and
that of the cluster (see text). These revised colors are as given in
the last column of Table 1. Only those data for
which |
An age of 15.5-16 Gyr is indicated from
the observed location of the turnoff and subgiant branch relative to their
theoretical counterparts. Allowing for helium diffusion would reduce this
estimate to  15 Gyr (see Section 2.2.1), which
should not be in error by more than ± 1.5
Gyr due to chemical composition uncertainties (see
Section 2.4). According
to Section 2.1.3, it is possible that deficiencies in convection theory
could contribute a small age uncertainty, but other than this minor
concern, remaining uncertainties in stellar physics should have little
impact. Assuming no systematic error in the distance scale defined by
the L-K corrected trigonometric parallax
measures, the M92 distance modulus error is dominated by three terms [see
Stetson & Harris
(1988)
for a more complete discussion of the errors associated with the subdwarf
fit]. There is a goodness-of-fit term, which we approximate with the RMS
vertical scatter (after correcting the colors to [Fe/H] = -2.14)
of the subdwarf distribution around the distance-modulus-adjusted M92
main-sequence; a term for the uncertainty in the reddening towards M92,
15 Gyr (see Section 2.2.1), which
should not be in error by more than ± 1.5
Gyr due to chemical composition uncertainties (see
Section 2.4). According
to Section 2.1.3, it is possible that deficiencies in convection theory
could contribute a small age uncertainty, but other than this minor
concern, remaining uncertainties in stellar physics should have little
impact. Assuming no systematic error in the distance scale defined by
the L-K corrected trigonometric parallax
measures, the M92 distance modulus error is dominated by three terms [see
Stetson & Harris
(1988)
for a more complete discussion of the errors associated with the subdwarf
fit]. There is a goodness-of-fit term, which we approximate with the RMS
vertical scatter (after correcting the colors to [Fe/H] = -2.14)
of the subdwarf distribution around the distance-modulus-adjusted M92
main-sequence; a term for the uncertainty in the reddening towards M92,
 |
and a term for the uncertainty in the [Fe/H] value for M92 stars,
![\begin{displaymath}
\delta [Fe / H] \times \frac{\partial M_V}{\partial (B - V)} \times
\frac{\partial (B - V)}{\partial [Fe / H]} .
\end{displaymath}](Equations/eq1x.gif) |
If we take E(B
- V) ~ 0m.02 and
[Fe/H] ~ 0.2 dex, then
these three terms added in quadrature give
(m - M) ~
0m.16, which translates into an uncertainty in the age of ~
2.0 Gyr (68% confidence interval). The
[Fe/H] term enters the
age uncertainty a second time because Mbol(TO) has an
[Fe/H] dependence, and the formal observational uncertainty in
the age that we derive for M92, assigning no errors to the models and
assuming the subdwarf distances have no systematic errors, is 2.2
Gyr.
5 We make fairly extensive use of these
calculations in this study,
obviously because they are immediately at hand, but also because they
represent the most up-to-date models presently available. In particular,
they employ opacities for the adopted
/ Fe number abundance
ratios and are not based on the renormalization of scaled-solar-mix
calculations, as has been advocated by
Salaris et al
(1993).
Their procedure does appear to work well at low Z values, but not
for Z < 0.002 (or so) according to
VandenBerg et al
(1996; also see
Weiss, Peletier
& Matteucci 1995):
At high Z, the RGB location becomes insensitive to
[ / Fe]. Importantly, as
shown by
VandenBerg
(1992),
Salaris et al, and the three lowermost curves in Figure 1 of this paper,
virtually identical results are obtained when completely independent
codes employing similar physics are used.
Back.