


Observational cosmology, like most other physical sciences, is technology driven. With each new generation of telescope and with each improvement in the photographic process, astronomers probed further into the Universe, cataloguing its contents.
Early on, Edward Fath used the Mount Wilson 60" telescope to photograph Kapteyn's selected areas. That survey showed inhomogeneities that were later analyzed by Bok (1934) and Mowbray (1938) who demonstrated statistically, using counts in cells, that the galaxy distribution was nonuniform. About this time, Carpenter (1938) noticed that small objects tend to be dense while vast objects tend to be tenuous. He plotted a remarkable relationship between scale and density ranging all the way from the Universe, through galaxies and stellar systems to planets and rock, as it has been explained in Sect. III.D.2. This was perhaps the first example of a scaling relationship in cosmology.
By 1930, the Shapley/Ames catalog of galaxies revealed the Virgo cluster as the dominant feature in the distribution of bright galaxies. It was already clear from that catalog that the Virgo Cluster was part of an extended and rather flattened supercluster. This notion was hardly discussed except by de Vaucouleurs who thought that this was indeed a coherent structure whose flattening was due to rotation.
The Lick Survey of the sky provided extensive plate material that was later to prove one of the key data sets for studies of galaxy clustering. The early isoplethic maps drawn by Shane and Wirtanen (1954) provided the first cartographic view of cosmic structure. Their counts of galaxies in cells was to provide Rubin (1954) and Limber (1954) with the stimulus to introduce the two point clustering function as a descriptor of cosmic structure.
But it was the Palomar Sky Survey using the new 48" Schmidt telescope that was to provide the key impetus in understanding the clustering of galaxies. Zwicky and his collaborators at Caltech systematically cataloged the position and brightness of thousands of brighter galaxies on these plates, creating what has become known as the "Zwicky Catalog". Abell (1958) made a systematic survey for rich clusters of galaxies and drew up a catalog listing thousands of clusters. This has become simply known as the "Abell catalog". Fig. 4 shows a modern image of the cluster Abell 1689 obtained by the ACS camera aboard of the Hubble Space Telescope (HST). A catalog of galaxy redshifts noting the clusters to which galaxies belonged was published in 1956 by Humason et al. (1956).
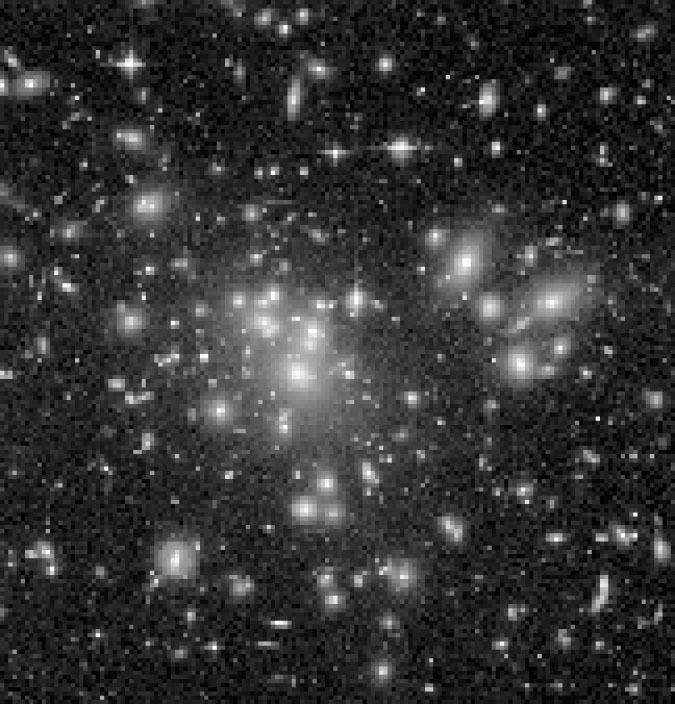 |
Figure 4. The cluster of galaxies Abell 1689 at redshift z = 0.18 seen by the HST with its recently installed Advanced Camera for Surveys (ACS). The arcs observed amongst hundreds of galaxies conforming the cluster are multiple images of far-away individual galaxies whose light has been amplified and distorted by the total cluster mass (visible and dark) acting as a huge gravitational lens, (image courtesy of NASA, N. Benitez (JHU), T. Broadhurst (The Hebrew University), H. Ford (JHU), M. Clampin (STScI), G. Hartig (STScI), G. Illingworth (UCO/Lick Observatory), and the ACS Science Team, and ESA). |
The first map of the sky revealing widespread clustering and super-clustering of galaxies came from the Lick survey of galaxies undertaken by Shane and Wirtanen (1967) using large field plates from the Lick Observatory. This was, or anyhow should have been, the definitive database. It was the subject of statistical analysis by Neyman et al. (1953), which was a major starting point for what have subsequently become known as Neyman-Scott processes in the statistics literature. Ironically, although these processes have become a discipline in their own right, they have since that time played only a minor role in astronomy.
Scott in the IAU Symposium 15 (Scott, 1962) mentions that there are clearly larger structures to be seen in these counts, as Shane and Wirtanen (1954) had already noted. They spoke of "larger aggregations" or "clouds" as being rather general features. The Lick survey was later to play an important role in Peebles' systematic assault on the problem of galaxy clustering. Peebles obtained from Shane the notes containing the original counts in 10'×10' cells and computerized them for his analysis. The counts in 1 degree cells had been used first by Vera Cooper-Rubin (as Vera Rubin was then known) to study galaxy clustering in terms of correlation functions, a task set by her adviser George Gamow. Rubin did this at a time when there were no computers. It was Totsuji and Kihara (1969) who first did this on a computer and published the first two-point correlation function as we now know it with the power law that has dominated much of cosmology for the past three decades and more 4.
2. Palomar Observatory sky survey
The two main catalogs of clusters derived from the Palomar Observatory Sky Survey (POSS) were that of Abell (1958) and that of Zwicky and his collaborators (Zwicky et al., 1961-1968).
Abell went on immediately to say that there was significant higher
order clustering in his data, giving, in 1958, a scale for
superclustering of 24
(H0 / 180)-1 Mpc. In 1961 at a meeting
held in connection with the Berkeley IAU Abell published
(Abell, 1961)
a list of these "super-clusters", dropped the
Hubble constant to 75 km s-1 Mpc-1 and estimated
masses of 1016 - 1017
M with
velocity dispersions in the
range 1000-3000 km s-1. At about the same time,
van den Bergh (1961)
remarks that Abell's most distant clusters
(distance class 6 having redshifts typically around 50,000 km
s-1) show structure on the sky on a scale of some 20°,
corresponding to 100 Mpc, for his H0 = 180 km
s-1
Mpc-1, or about 300 Mpc using current values.
with
velocity dispersions in the
range 1000-3000 km s-1. At about the same time,
van den Bergh (1961)
remarks that Abell's most distant clusters
(distance class 6 having redshifts typically around 50,000 km
s-1) show structure on the sky on a scale of some 20°,
corresponding to 100 Mpc, for his H0 = 180 km
s-1
Mpc-1, or about 300 Mpc using current values.
Zwicky explicitly and repeatedly denied the existence of higher order structure (Zwicky and Rudnicki 1963, 1966, Zwicky and Berger, 1965, Zwicky and Karpowicz, 1966). Some of his "clusters" were on the order of 80 Mpc across (for H0 less than 100), had significant substructure, and would to any other person have looked like superclusters! Herzog, one of Zwicky's collaborators in the cluster catalog, found large aggregates of clusters in the catalog and had the temerity to say so publicly in a Caltech astronomy colloquium. He was offered "political asylum" at UCLA by George Abell. Karachentsev (1966) also reported finding large aggregates in the Zwicky catalog.
Up until about 1960 most of those involved seemed to envisage a definite hierarchy of structures: galaxies (perhaps binaries and small groups), clusters and superclusters. Kiang remarked that the existing data were best described by continuous, "indefinite", clustering: quite different from the clustering hierarchy as understood at the time (Kiang, 1961, Kiang and Saslaw, 1969). Kiang, incidentally, bridged a critical era in data processing, using "computers" (i.e., poorly paid non-PhD labour, mostly women after the style of Shapley) and later on real computers (Atlas). Flin et al. (1974) came independently to the same conclusion, and in his presentation at IAU Symposium 63 was scolded by Kiang for not having read the literature.
The later investigation by Peebles and Hauser (1974) using the power spectrum of the cluster distribution showed superclustering quite conclusively: clusters of galaxies are not randomly distributed and as they are correlated they are themselves clustered. Later analyses revealed a variation of cluster clustering with cluster richness.
Nevertheless, there still remained mysteries to be cleared up: the level measured for clustering of clusters was far in excess of what would be expected on the basis of the measured clustering of the galaxies from which they are built. Many solutions have been proposed to explain this anomaly, including the argument that the Abell catalog is too subjective and biased. However, the phenomenon still persists in cluster catalogs constructed by machine scans of photographic plates.
4 BJ "discovered" this paper at the time of writing his Review of Modern Physics article (Jones, 1976) while perusing the Publications of the Astronomical Society of Japan in the Institute of Theoretical Astronomy Library in Cambridge. There do not appear to be any citations prior to that time. Back.