


3.4. Galaxy clustering
The power spectrum of density perturbations depends on the nature of the
dark matter. Within the Cold Dark Matter model, the shape of the power
spectrum depends primarily on the primordial power spectrum and on the
combination
 m
h which determines the
horizon scale at matter-radiation equality, with a subdominant dependence on
the baryon density. The matter distribution is most easily probed by
observing the galaxy distribution, but this must be done with care as
the galaxies do not perfectly trace the dark matter
distribution. Rather, they are a `biased' tracer of the dark matter. The
need to allow for such bias is emphasized by the observation that
different types of galaxies show bias with respect to each
other. Further, the observed 3D galaxy distribution is in redshift
space, i.e., the observed redshift is the sum of the Hubble expansion
and the line-of-sight peculiar velocity, leading to linear and
non-linear dynamical effects which also
depend on the cosmological parameters. On the largest length scales, the
galaxies are expected to trace the location of the dark matter, except for a
constant multiplier b to the power spectrum, known as the linear bias
parameter. On scales smaller than 20 h-1 Mpc or so,
the clustering pattern is `squashed' in the radial direction due to
coherent infall, which depends on the parameter
m
h which determines the
horizon scale at matter-radiation equality, with a subdominant dependence on
the baryon density. The matter distribution is most easily probed by
observing the galaxy distribution, but this must be done with care as
the galaxies do not perfectly trace the dark matter
distribution. Rather, they are a `biased' tracer of the dark matter. The
need to allow for such bias is emphasized by the observation that
different types of galaxies show bias with respect to each
other. Further, the observed 3D galaxy distribution is in redshift
space, i.e., the observed redshift is the sum of the Hubble expansion
and the line-of-sight peculiar velocity, leading to linear and
non-linear dynamical effects which also
depend on the cosmological parameters. On the largest length scales, the
galaxies are expected to trace the location of the dark matter, except for a
constant multiplier b to the power spectrum, known as the linear bias
parameter. On scales smaller than 20 h-1 Mpc or so,
the clustering pattern is `squashed' in the radial direction due to
coherent infall, which depends on the parameter

 m0.6 / b (on these shorter
scales, more complicated forms of biasing are not excluded by the
data). On scales of a few h-1 Mpc, there is an effect
of elongation along the line of sight
(colloquially known as the `finger of God' effect) which depends on the
galaxy velocity dispersion
m0.6 / b (on these shorter
scales, more complicated forms of biasing are not excluded by the
data). On scales of a few h-1 Mpc, there is an effect
of elongation along the line of sight
(colloquially known as the `finger of God' effect) which depends on the
galaxy velocity dispersion
 p.
p.
3.4.1. The galaxy power spectrum
The 2-degree Field (2dF) Galaxy Redshift Survey is now complete and publicly
available, with nearly 230,000 redshifts.
4
Analyses of a subset of the full data
(containing 160,000 redshifts) measured the power spectrum for
k > 0.02 h Mpc-1 with ~ 10% accuracy, shown
in Figure 3. The measured
power spectrum is well fit by a CDM model with
m
h = 0.18 ± 0.02, and a baryon fraction
b /
m = 0.17
± 0.06
[22].
The pattern of the galaxy clustering in redshift space is fitted by
= 0.49
± 0.09 and velocity dispersion
p = 506
± 52 km s-1
[23];
note that the two are
strongly correlated. Combination of the 2dF data with the CMB indicates
b ~ 1, in agreement with a 2dF-alone analysis of higher-order
clustering statistics. Results for these parameters also depend on the
length scale over which a fit is done, and the selection of the objects by
luminosity, spectral type, or color. In particular, on scales smaller
than 10 h-1 Mpc, different
galaxy types are clustered differently. This `biasing' introduces a
systematic effect on the determination of cosmological parameters from
redshift surveys.
Prior knowledge from simulations of galaxy formation could help, but is
model-dependent. We note that the present-epoch power spectrum is not
sensitive to dark energy, so it is mainly a probe of the matter density.
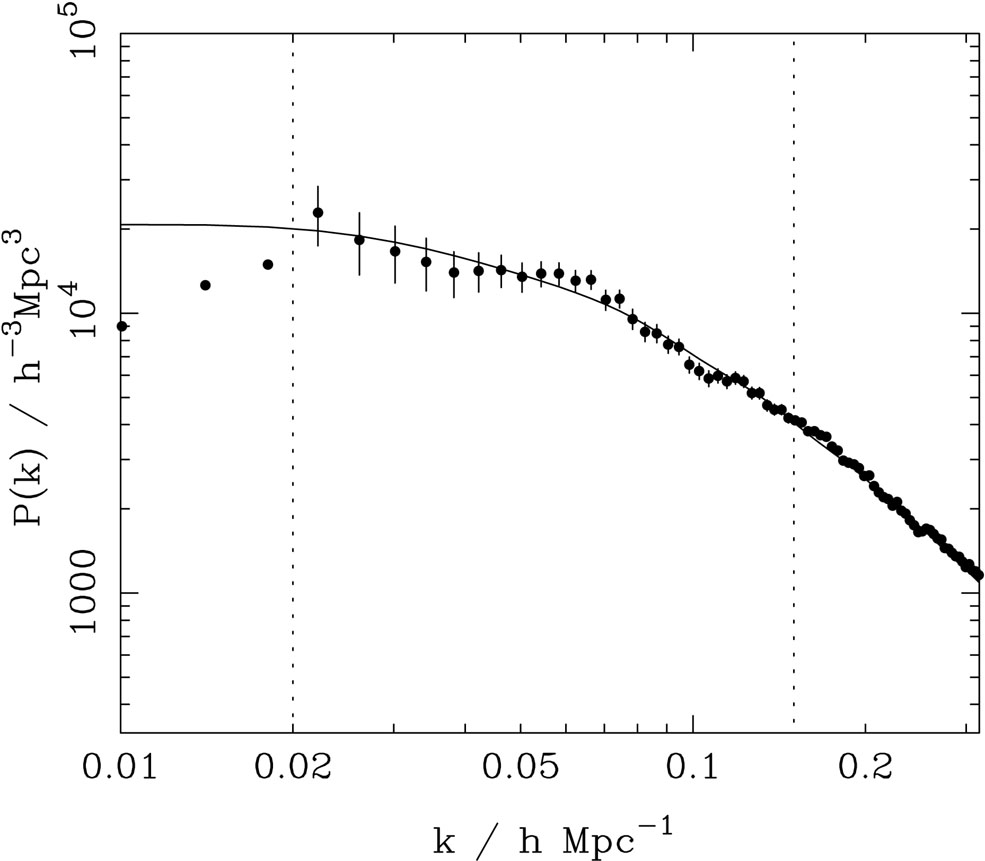 |
Figure 3. The galaxy power
spectrum from the 2dF galaxy redshift survey as derived in
Ref. [22].
This plot shows P(k)
|
The Sloan Digital Sky Survey (SDSS) is a project to image a quarter of
the sky, and to obtain spectra of galaxies and quasars selected from the
imaging data. 5 A maximum
likelihood analysis of early SDSS data by Szalay et al.
[24]
used the projected distribution
of galaxies in a redshift bin around z = 0.33 to find
mh
= 0.18 ± 0.04, assuming a flat
 CDM model with
m = 1 -
=
0.3. The power spectrum of the latest version of SDSS redshift survey
was published as this article was being finalized
[25].
CDM model with
m = 1 -
=
0.3. The power spectrum of the latest version of SDSS redshift survey
was published as this article was being finalized
[25].
3.4.2. Limits on neutrino mass from 2dFGRS
Large-scale structure data can put an upper limit on the ratio
 /
m due to the
neutrino `free streaming' effect
[26].
By comparing the 2dF galaxy power spectrum with a four-component model
(baryons, cold dark matter, a cosmological constant, and massive
neutrinos), it was estimated that
/
m < 0.13
(95% confidence limit), giving
< 0.04 if a concordance
prior of
m = 0.3
is imposed. The latter corresponds to an upper limit of about 2 eV on
the total neutrino mass, assuming a prior of
h
/
m due to the
neutrino `free streaming' effect
[26].
By comparing the 2dF galaxy power spectrum with a four-component model
(baryons, cold dark matter, a cosmological constant, and massive
neutrinos), it was estimated that
/
m < 0.13
(95% confidence limit), giving
< 0.04 if a concordance
prior of
m = 0.3
is imposed. The latter corresponds to an upper limit of about 2 eV on
the total neutrino mass, assuming a prior of
h  0.7
[27].
The above analysis assumes that the primordial power spectrum is adiabatic,
scale-invariant and Gaussian. Potential systematic effects include
biasing of the galaxy distribution
and non-linearities of the power spectrum. Additional cosmological data
sets bring down this upper limit by a factor of two
[28].
The analysis of WMAP+2dFGRS
[7]
derived
h2 < 0.0067 (95% CL).
0.7
[27].
The above analysis assumes that the primordial power spectrum is adiabatic,
scale-invariant and Gaussian. Potential systematic effects include
biasing of the galaxy distribution
and non-linearities of the power spectrum. Additional cosmological data
sets bring down this upper limit by a factor of two
[28].
The analysis of WMAP+2dFGRS
[7]
derived
h2 < 0.0067 (95% CL).
Laboratory limits on absolute neutrino masses from tritium beta decay and especially from neutrinoless double-beta decay should, within the next decade, push down towards (or perhaps even beyond) the 0.1 eV level that has cosmological significance.
4 See http://www.mso.anu.edu.au/2dFGRS. Back.
5 See http://www.sdss.org. Back.

 2(k) / k3, but with
distances measured in redshift space and convolved with the survey
geometry. The solid line shows a linear-theory
2(k) / k3, but with
distances measured in redshift space and convolved with the survey
geometry. The solid line shows a linear-theory