


4.1. Indicators for (Local) AGN and Starbursts
We next discuss the main indicators of optically obscured AGN (hereafter, we use "obscured" to mean that the optical/UV continuum and broad emission line spectrum is not observable) in each wavelength band, and the limits of each technique. Then we try to draw some general conclusions on the possibility of detecting AGN activity in galaxies, now and in the foreseeable future. Two main elements are relevant for the effectiveness of the different indicators: (1) the amount of X-ray absorbing column density NH and optical extinction AV, and (2) the fraction of solid angle covered by the obscuring medium.
 X-rays. If
the X-ray absorbing column density is not
larger than 1025 cm-2, the direct > 10 keV
X-ray emission of
the AGN can penetrate the absorber. In this case, the hard X-ray
emission will be at least an order of magnitude higher than
that of the host galaxy, down to luminosities
~ 1041 ergs s-1.
With arcsecond (Chandra) resolution, the contrast is improved by a
factor of 10 - 100 for z
X-rays. If
the X-ray absorbing column density is not
larger than 1025 cm-2, the direct > 10 keV
X-ray emission of
the AGN can penetrate the absorber. In this case, the hard X-ray
emission will be at least an order of magnitude higher than
that of the host galaxy, down to luminosities
~ 1041 ergs s-1.
With arcsecond (Chandra) resolution, the contrast is improved by a
factor of 10 - 100 for z
 0.1, though
Chandra's effective upper energy bound of ~ 7 keV limits the
detection to
NH < 1023 cm-2 (this limit
moves up to 1024 cm-2 for
objects at redshifts z ~ 1). In these cases, the detection of the AGN
is unambiguous.
0.1, though
Chandra's effective upper energy bound of ~ 7 keV limits the
detection to
NH < 1023 cm-2 (this limit
moves up to 1024 cm-2 for
objects at redshifts z ~ 1). In these cases, the detection of the AGN
is unambiguous.
The contribution of the host galaxy to the hard
X-ray emission is usually modeled by two components: the thermal
emission due to warm interstellar gas (kT ~ 0.1-1 keV),
and the contribution from compact sources (dominated by X-ray binaries)
that, on average, is reproduced by a power law with
 ~ -0.5 to
-0.7, or by a thermal component with kT ~ 20 keV
(Fabbiano 1989).
The luminosity of these components can be of the same order
as - or greater than - that of the obscured AGN
(LX < 1040 ergs s-1 for spirals;
LX ~ 1041 ergs s-1 for
ellipticals and starbursts).
From the observed direct X-ray emission, it is possible to give
a rough estimate to the bolometric emission of the AGN using
the information of the average SED discussed in
Section 2.
Examples of the effectiveness of hard X-ray observations include
ULIRG MKN 231, shown in
Figure 12 (discussed
in Section 3.4 as a BAL quasar), and
NGC 6240,
an ULIRG with no evidence of AGN activity below 20 - 30 keV
(except, perhaps, for some indication from mid-IR coronal lines,
Lutz et al. 2003).
A BeppoSAX observation of NGC 6240 discovered a powerful AGN with a column
density NH > 1024 cm-2 that
showed up at energies E > 20 keV
(Vignati et al. 1999).
~ -0.5 to
-0.7, or by a thermal component with kT ~ 20 keV
(Fabbiano 1989).
The luminosity of these components can be of the same order
as - or greater than - that of the obscured AGN
(LX < 1040 ergs s-1 for spirals;
LX ~ 1041 ergs s-1 for
ellipticals and starbursts).
From the observed direct X-ray emission, it is possible to give
a rough estimate to the bolometric emission of the AGN using
the information of the average SED discussed in
Section 2.
Examples of the effectiveness of hard X-ray observations include
ULIRG MKN 231, shown in
Figure 12 (discussed
in Section 3.4 as a BAL quasar), and
NGC 6240,
an ULIRG with no evidence of AGN activity below 20 - 30 keV
(except, perhaps, for some indication from mid-IR coronal lines,
Lutz et al. 2003).
A BeppoSAX observation of NGC 6240 discovered a powerful AGN with a column
density NH > 1024 cm-2 that
showed up at energies E > 20 keV
(Vignati et al. 1999).
However, despite these impressive examples, this method has so far proved to be useful only in a few cases. A BeppoSAX search for ULIRGs known to host an AGN from other indicators (described below) in the 10 - 100 keV band failed to detect the nuclear activity in most cases (Risaliti et al. 2004, in preparation). This implies that most of these sources are obscured by column densities NH > 1025 cm-2.
If NH > 1025 cm-2, no direct
emission can penetrate the
obscuring medium because multiple Compton scatterings gradually
remove energy from the photons until they can be photoelectrically
absorbed. In this case, the only way to detect the AGN is through
reflected (scattered) emission. The main spectral properties of a
cold reflection dominated AGN are a flat spectrum
( > -1 in
the 2 - 10 keV band) and a prominent iron line (EW > 1 keV)
at ~ 6.4 keV. In principle, two methods can be used to disentangle
the two contributions, based on spatial and spectral analyses,
respectively.
1) High spatial resolution can help to resolve the nuclear region where the AGN emission is dominant. This approach is obviously most useful when used on nearby sources. A case study, which shows both the power and the limitations of this approach, is the Chandra observation of the ULIRG Arp 220. The subarcsecond resolution instruments of Chandra resolved a weak point-like hard X-ray source with luminosity ~ 4 × 1040 ergs s-1 (Clements et al. 2002), which is probably associated with an AGN. No previous spectral analysis was able to disentangle this component from the diffuse X-ray emission because of the orders of magnitude worse spatial resolution. However, even in the Arp 220 case, we cannot rule out that the observed hard emission is due to ~ 10 - 100 X-ray binaries in a region of intense star formation (the size limit for a Chandra point source at the redshift of Arp 220, z = 0.018, is ~ 400 pc).
2) Spectral decomposition of the AGN and starburst components requires high effective area. Recently, an XMM-Newton survey of nearby, bright ULIRGs provided the best X-ray spectra of ULIRGs (Franceschini et al. 2003). The AGN component was clearly detected in 3 out of 8 sources through the high EW 6.4 keV iron line and the flat continuum. However, in the remaining five sources, the case is ambiguous, as the presence of a completely obscured (NH > 1024 cm-2) AGN cannot be ruled out.
Optical/UV.
By definition, optically obscured (type II)
AGN do not show any intrinsic continuum emission in the optical/UV
band. The two main ways to search for AGN in these wavebands
are through scattered (polarized) light and narrow emission line
ratios. Both require that there are some unobscured directions
out of the nucleus.
Scattering by warm electrons has been briefly discussed in Section 3. In the polarized spectrum, broad emission lines can be detected, unambiguously revealing a central AGN.
The main method for classifying narrow emission line objects is through the ratio of emission line fluxes: high ionization lines are expected to be stronger in AGN than in starbursts. The main optical emission lines shown in Figure 10, and listed in the caption, are roughly the same as in a spectrum of a starburst galaxy. In Figure 13, we show a classical diagnostic diagram, first introduced by Veilleux & Osterbrock (1987), in which type II AGN are clearly separated from starbursts. In the same figure, a third class of objects is shown, the so-called LINERs (Low Ionization Emission Line Objects). The origin of their emission (nuclear activity or star formation) is not yet clear.
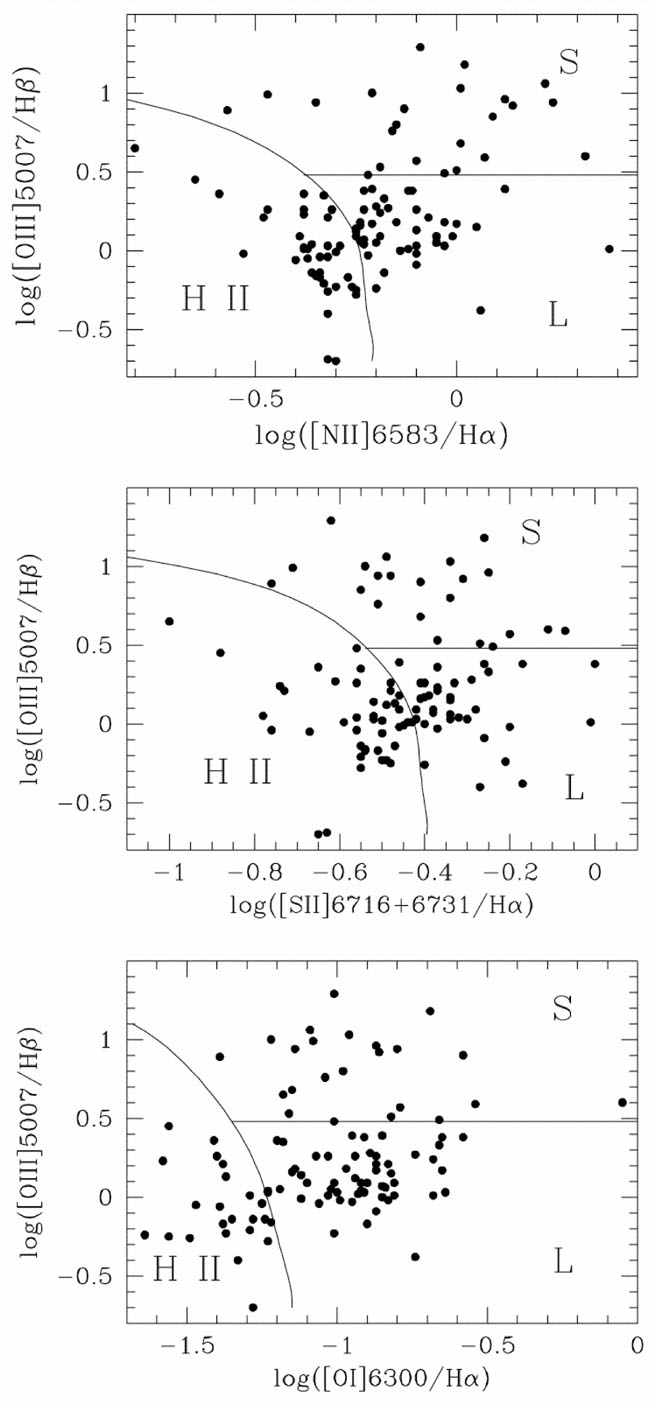 |
Figure 13. Diagnostic diagrams based on narrow emission line ratios for a sample of bright ultraluminous infrared galaxies. Figure from Veilleux, Kim, & Sanders (1999; their Fig. 2). |
Infrared.
A general indicator of AGN activity is a warm IR spectrum.
The IRAS 25 - 60 µm color is rather effective in finding
AGN-powered IR sources (see, for example,
de Grijp et al. 1987).
However, while a high 25 - 60 µm color can be considered
an indicator of AGN activity, independent confirmation is needed.
ISO has enhanced the analytic capability of IR analysis. For example, Laurent et al. (2000) have shown that the ratio between the 12 - 18 µm and the 5 - 8.5 µm emission (these are the ranges of two filters in the ISOPHOT instrument on the ISO satellite) is effective in discriminating the AGN and starburst contributions at redshifts between 0.4 and 1. At a finer level of detail, when low resolution spectroscopy is available, broad emission features in the mid-IR band can be used as effective AGN indicators. For example, the absence of a broad 7.7 µm emission, due to Polycyclic Aromatic Hydrocarbon (PAH) molecules, is believed to be an indicator of AGN emission, both because of the strength of this indicator in control samples and for physical considerations: PAH molecules should be destroyed by the high energy continuum of an AGN.
Finally, higher resolution ISO SWS spectra provide useful
indicators of the relative AGN/starburst contributions. As in the
case of optical lines, high excitation emission lines are tracers
of AGN activity, while strong, low excitation lines are a sign of
starbursting activity. For example, [O IV]
 25.9 µm and
[Ne V]
14.3 µm
are among the strongest high excitation
mid-IR emission lines, while [Ne II]
12.9 µm and
[S III]
18.7 µm
are strong low excitation lines. An example
of the use of these indicators can be found in
Genzel et al. (1998),
where the [O IV] / [Ne II] and [Ne V] / [Ne II] ratios of a sample of
nearby, bright ULIRGs are compared with those of comparison samples
of local AGN and starbursts (see Fig. 14).
The power of this diagnostic is also well illustrated by its application
to the ISO spectrum of the galaxy NGC 6240. This source, as
discussed above, is known from hard X-ray (10 - 100 keV) observations
to host a powerful AGN, but it does not reveal any indication of an AGN
at longer wavelengths, except for a strong [O IV]
25.9 µm
in the ISO SWS spectrum
(Lutz et al. 2003).
All the IR methods
discussed above will be much more effective, and applicable at higher
redshift and/or fainter objects, with the new observations of the
Spitzer Space Telescope.
25.9 µm and
[Ne V]
14.3 µm
are among the strongest high excitation
mid-IR emission lines, while [Ne II]
12.9 µm and
[S III]
18.7 µm
are strong low excitation lines. An example
of the use of these indicators can be found in
Genzel et al. (1998),
where the [O IV] / [Ne II] and [Ne V] / [Ne II] ratios of a sample of
nearby, bright ULIRGs are compared with those of comparison samples
of local AGN and starbursts (see Fig. 14).
The power of this diagnostic is also well illustrated by its application
to the ISO spectrum of the galaxy NGC 6240. This source, as
discussed above, is known from hard X-ray (10 - 100 keV) observations
to host a powerful AGN, but it does not reveal any indication of an AGN
at longer wavelengths, except for a strong [O IV]
25.9 µm
in the ISO SWS spectrum
(Lutz et al. 2003).
All the IR methods
discussed above will be much more effective, and applicable at higher
redshift and/or fainter objects, with the new observations of the
Spitzer Space Telescope.
 |
Figure 14. Diagnostic diagrams based on mid-IR emission lines. Inverted triangles and squares denote sources optically classified as starbursts and AGN, respectively. Circles denote ULIRGs. Figure from Genzel et al. (1998; their Fig. 3). |
Moving to shorter wavelengths, recent observations in the L-band from ground-based telescopes have provided interesting new ways to disentangle AGN and starburst activity: the 3.3 µm PAH emission feature is a starburst indicator (Tokunaga et al. 1991), AGN are characterized by an absorption feature at ~ 3.4 µm due to hydrocarbon dust grains (Pendleton et al. 1994), and the 3 - 4 µm continuum is much steeper in AGN-dominated sources. As examples, we plot in Figure 15 a starburst spectrum (NGC 253, Imanishi & Dudley 2000) and an AGN spectrum (IRAS 19254+7245, Risaliti et al. 2003c).
 |
Figure 15. L-band spectrum of the starburst galaxy NGC 253 (from Imanishi & Dudley 2000; their Fig. 2j) and of the AGN-dominated ULIRG IRAS 19254+7245 (Risaliti et al. 2003c; their Fig. 1). The most evident features are the 3.3 µm PAH emission line in both spectra and the 3.4 µm absorption feature in IRAS 19254+7245. Shaded band in the spectrum of IRAS 19254+7245 indicates a wavelength interval with low atmospheric transmission. |
Radio.
High spatial resolution radio observations can provide useful
indicators of AGN activity. Very Long Baseline Interferometry (VLBI)
observations of ULIRGs
(Lonsdale et al. 1993;
Smith et al. 1998)
showed that compact,
high brightness temperature (well above starburst temperatures;
Tb > 105 K) sources are preferentally found in
objects classified optically as AGN. Physically, compact and high
luminosity radio emission can only be explained by AGN activity,
or by assuming the simultaneous presence of several extremely
luminous radio supernovae in regions with a radius of less than
1 kpc, a highly unlikely event, even in the most intense starburst
regions.
Recently, a radio VLA survey of the ULIRGs in the IRAS 1 Jy sample (Kim & Sanders 1998) showed that compact radio emission is present in most LINER classified ULIRGs, similar to that found in objects optically classified as AGN, and contrary to what is found in starburst galaxies (Nagar et al. 2003). This result is particularly interesting since it provides a method to estimate the AGN incidence in a class of objects - LINERs - for which optical spectroscopic criteria do not give clear indications (as shown in Fig. 13).