2. Problems associated with the telescope configuration
The channel maps contain the information on the HI distribution and the velocity field of a galaxy. There are, however, various undesirable effects present in those maps, which have to be eliminated first. The most important problems arise from 1) the choice of the shortest spacing, 2) contamination from background continuum sources, and 3) contamination from continuum radiation of the galaxy. The last two problems can be solved at once if the number of channel maps in which no line radiation is present is larger than about 5: we then make an average of the line-free maps and subtract this average from all other channel maps; the new maps then contain line radiation only. If the number of line-free channel maps is smaller than about 5 subtraction of the average causes more than 10% degradation of the signal-to-noise ratio in the resulting line maps. In that case we can better first subtract the background sources from each channel map independently by making source fits and subtracting these fits, convolved with the point source response pattern (antenna pattern) from the channel maps. The continuum radiation of the galaxy can then be separated from the line radiation by a method which we describe in the next section.
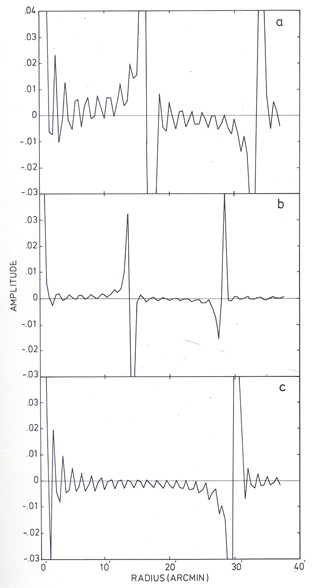
For the sample of galaxies in Table 1 the shortest spacing has been chosen at 36 m; this implies that source structures larger than about 10' are not measured properly. From the optical sizes of the galaxies it follows that the expected source size in each channel map is less than 10'. This expectation turned out to be false in the cases of NGC 5055 and NGC 2841. For NGC 5055 we have obtained additional measurements, for NGC 2841 the effect was considered too small to justify a request for more observing time. Even if the sources are well measured a problem arises. This is illustrated in Fig. l where we present annular averages of the antenna patterns for three sets of interferometer spacings. From Fig. la and b it follows that the mean level outside a point source within the first grating response the spacing configurations 36, 108, ..., 684 m and 36, 108, ..., 1404 m is positive; Fig. 1c shows that this level is negative for the configuration 36, 72, .. , 720 m. This effect has to be removed, otherwise we would have line profiles with a non-zero baseline. Moreover, for most galaxies a positional overlap occurs between grating responses in high velocity channel maps and HI emission in low velocity channel maps and conversely; again this results in profiles with distorted baselines.
Figure 1. Annular average of antenna patterns as function of radius along the north-south axis. The width of the annuli is 0.5' at the north-south axis. In a the pattern for spacings 36, 108, ..., 684 m is shown, in b the pattern for spacings 36, 108, ,... , 1404 m, in c the pattern for spacings 36, 72, ..., 720 m. |
We have solved these problems by using the procedure CLEAN (Högbom 1974; Schwarz, 1978). In this procedure the extended source is decomposed into a set of point sources; the point sources and their instrumental responses are subtracted from the map. The decomposition continues until the noise level of the map has been reached. In this way the sidelobes and grating responses are removed, and the level of the map outside the source is adjusted to zero. After decomposition the set of point sources is brought back into the map, convolved with a gaussian beam with the same halfpower beam width as the original antenna pattern.
This cleaning process is in a certain sense an empirical fit to the data in the UV-plane. This fit contains the extrapolated value of the visibility amplitude of the source at zero meters. The extrapolated value represents the true value only if the source in question does not have spatial structures of a size that cannot be seen with the shortest baseline of the interferometer. For a shortest baseline of 36 m spatial structures larger than about 12' cannot be recovered properly; after decomposition of such a map the base level is still not zero. The total flux in such a map can be recovered by the application of an additional level shift. From Fig. 1, however, we must conclude that a shift of the base level with a constant amount is only a very crude approximation.
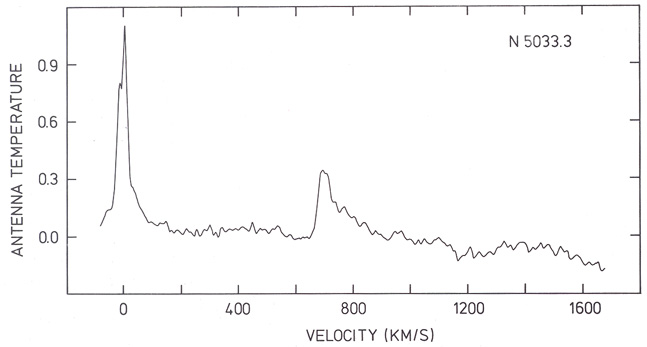
An alternative to the CLEAN method of estimating the flux in the low spatial frequency components of a source is the measurement of these with a large single dish. For most of the galaxies described here measurements have been taken with the 100 m telescope at Effelsberg for this purpose (Van der Hulst et al., private communication). In practice, single dish data suffer from many problems: calibration, pointing, baseline ripples, etc., which are far less severe for interferometer data. For the 100 m data mentioned above the most important limitation arises from the baseline definition of the profile. In Fig. 2 we show a typical case. Clearly the baseline is not flat; it is difficult to estimate precisely how much HI emission is present at this point of the sky. Therefore we have not added these data to our maps to correct for the missing zero spacing, since this would have caused more problems than it solved. Instead, we have computed integral HI profiles from our cleaned maps and compared these with single dish HI profiles which are available. The agreement between these profiles is usually within 10 to 15%, but the quality of some of the single dish data is low. In view of this, an extensive program to obtain accurate HI profiles with a single dish telescope is very desirable for checking the WSRT results.
Figure 2. HI profile taken with the 100 m Effelsberg telescope at a position 9' south of the nucleus of NGC 5033 (Van der Hulst et al. private communication). |