


In this chapter we present the results of seven studies on individual galaxies. These articles are self-contained: therefore there is occasionally an overlap among the discussion sections and parts of chapters 5, 6 and 7. The first two articles have already been published, but we reproduce them here because they deal with galaxies having distinctly different properties than the ones discussed in the remaining five articles.
Astron. Astrophys. 57, 37-381 (1977)
1 Kapteyn Astronomical Institute, Postbus 800, University of
Groningen, Netherlands
2 Department of Astronomy, University of Washington, Seattle, WA
98195, USA
Summary. The Sab galaxy NGC 4736 has been synthesized in the 21-cm HI line using the Westerbork array. Maps with angular resolutions of 25" × 38" and of 60" × 80" and velocity resolution of 27 km s-1, are given. The 21-cm continuum map, constructed from the outside channels, exhibits disk emission at a level of ~ 3 K in brightness temperature and of ~ 3' (~ 5 kpc) extent. An unresolved nuclear source and two regions of enhanced non-thermal emission coincident with an inner ring of H II regions (at a radius of ~ 0.8') are also seen.
Neutral hydrogen is found not only in the main optically bright section of the galaxy, but also coincident with a faint outer ring (at ~ 4' radius) surrounding the galaxy. The H I distribution also mimics the two connections and gaps between this ring and the main galaxy. The central region of the galaxy, out to ~ 0.3' radius, is found to be relatively lacking in gas, while the inner H II ring contains an excess of H I.
The H I velocities indicate that gas in the outer ring
partakes of basically the same kinematics as the gas in the
main galaxy. It is observed, however, that the kinematical
minor axis is not exactly perpendicular to the kinematical
major axis, which in turn changes somewhat with radius
and agrees with an observed change of the photometric
major axis. Using an axisymmetric model of rotation as a
first approximation, we measure
Vsys = 307 ± 5 km s-1,
p.a. (inner region) = 122° ± 3°, p.a. (outer) =
114° ± 6°, and inclination i = 35° ±
10°. Adopting a distance of 6 Mpc to
the galaxy, we find from the rotation curve that
MT = 5.3 × 10¹⁰
M ,
MH = 7.6 × 10⁸
M
and MT / L = 2.5 (solar units).
,
MH = 7.6 × 10⁸
M
and MT / L = 2.5 (solar units).
Key words: spiral galaxies - neutral hydrogen - rotation curve
The Sab galaxy NGC 4736 (M94), on short exposure photographs a normal galaxy, is notable for a faint outer Send offprint requests to: A. Bosma ring of radius 4' to 6' which surrounds the main body. According to de Vaucouleurs (1975), ~ 4% of all galaxies and ~ 15% of all Sab galaxies exhibit such external rings. A detailed description of the galaxy can be found in the Hubble Atlas (Sandage, 1961). A drawing of the main structural features is shown in Figure 1. We can distinguish five annular zones, which have progressively lower surface brightness, as follows:
a) an intense central region (out to 15" radius), b) an inner region of spiral structure (15" to 50"), c) an outer region of spiral structure with a multiple arm pattern (50" to 200"), d) a region, which we will refer to as the gap, with an apparent deficiency of light except for connections at the east and west side to e) the faint outer ring.
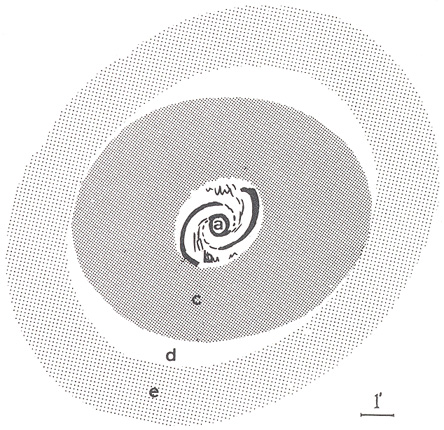 |
Figure 1. A drawing of the main structural features in NGC 4736. The various zones are described in the text |
In this paper we will discuss the kinematics of this galaxy on the basis of 21-cm HI line observations obtained with the Westerbork Synthesis Radio Telescope (WSRT). In particular our aim has been to understand the kinematical properties of the outer ring and how they fit into the overall picture of this galaxy. Lindblad (1960, 1974) originally proposed that the outer ring of NGC 4736 is a resonance ring at the corotation radius. Furthermore, Contopoulos (1970) has argued that resonance effects should occur at the position of the corotation radius in a spiral galaxy, resulting in trapping of matter in closed orbits. Measurements of the H I motions would seem to be the only possible way to provide the necessary kinematical data to study these effects.
The kinematics of the inner parts of the galaxy [zones a) and b)] have been investigated by several optical observers on the basis of spectra primarily taken along the major axis. Burbidge and Burbidge (1962) were not able to derive a smooth rotation curve and concluded that either non-circular motions exist or that the different regions of the galaxy are not in the same plane. However, Duflot (1962, 1965) and Chincarini and Walker (1967) did rind a smooth rotation curve in the inner 50". Recently van der Kruit (1974) has obtained further spectra, mainly from the H I regions at the edge of zone b). He assumed these regions to form a ring and concluded from his data that ring exhibits a uniform expansion with a velocity of ~ 30 km s-1 superimposed upon a rotational velocity of ~ 150 km s-1. This interpretation points to recent activity in the nucleus, as van der Kruit (1971) had already suggested on the basis of a continuum map at 1415 MHz where he found a nuclear source and two diametrically opposed sources, each 45" from the nucleus.
The only previous 21-cm H 1 line work on this galaxy was done by Rogstad et al. (1967) with a single spacing interferometer having an angular resolution of ~ 20'. Finally, information on the optical luminosity distribution along the major axis was obtained by Simkin (1967). These studies, together with the observations described in this paper, provide a fairly complete picture of this galaxy; which can hopefully be used as a starting point for a detailed analysis.
We describe the observations and reduction techniques in Section II and give the results in Section III.c These results are then discussed and compared with information available from other studies in Section IV.
II. Observations and Data Reduction
The observations were made in the summer of 1972 with
the WSRT and the 80-channel filter spectrometer in the manner described by
Allen et al. (1974).
The effective system temperature was 140 K; the filter widths at half
power were 129 kHz, corresponding to 27 km s-1.
31 channel maps obtained are spaced in intervals
of 20 km s-1 from heliocentric velocity V = 0 to
+600 km s-1. Eight half days of observations were required in
order to obtain for each channel twenty
antenna spacings (36, 108, 180, ..., 1404 m). This resulted
in a synthesized half-power beamwidth of 25" × 38"
( ×
×
 )
and a first grating response at 10' × 15'. The maps were
obtained by application of the standard WSRT reduction programs
(Högbom and Brouw,
1974)
for calibration and Fourier transformation. We will refer to the
maps using all the spacings as the "full resolution" maps.
)
and a first grating response at 10' × 15'. The maps were
obtained by application of the standard WSRT reduction programs
(Högbom and Brouw,
1974)
for calibration and Fourier transformation. We will refer to the
maps using all the spacings as the "full resolution" maps.
In the full resolution maps, however, line emission was reliably detected only in regions b) and c) and a small section of region e). Therefore, in order to investigate the emission in the outer regions, the signal-to-noise ratio has been increased by sacrificing angular resolution. A second set of 31 channel maps was made with a non-standard grading, effectively using only the shortest ten spacings. This resulted in a synthesized half-power beamwidth of 41" × 62". This set of maps showed some instrumental effects which were not evident in the full resolution maps. Some of the grating responses of HI in high-velocity channels occurred at the same position as H I signal in low-velocity channels. Furthermore, the maps are slightly affected by the missing 0 - m spacing. These effects have been removed by the application of the procedure "clean" (Högbom, 1974). With this method the sidelobes and grating rings are subtracted and the zero-level of the map is properly adjusted, while the signal part of the map is restored by convolution with a gaussian beam pattern. To increase the signal-to-noise still further, the cleaned maps were convolved to a beam of 60" × 80", the largest possible without substantial bleeding of signals. We will refer to these 60" × 80" maps as the "low-resolution" maps. In the subsequent analysis the full-resolution maps are used when studying the inner zones a) and b), while the low-resolution maps are used for the rest of the galaxy.
The original maps contained both line and continuum radiation. By studying the integrated profile at the 36-m spacing, however, we determined that the lowest six and highest five velocity channels did not contain any significant line radiation. The signals in these eleven channels were then averaged to define the continuum radiation map at 21 cm. This map was subtracted point-by-point from the maps of the remaining twenty channels which then contain line radiation only. For the determination of the total H I column density and the intensity weighted mean velocity at each point of the map, we have applied an automated "window" method (Bosma, 1977). This method has been designed in such a manner that biases in column density and velocity due to high-noise peaks outside the velocity range of the hydrogen emission are avoided. This is accomplished by centering a window (or acceptance gate) around the H I signal. The points outside this window are used to define a baseline which can then be subtracted if necessary. Only the points within the window are used to calculate the column density and velocity centroid. A further decrease in the noise can be obtained by smoothing the original profile in velocity. We have applied this in the case of the full-resolution maps using a 1/4 - 1/2 - 1/4 running mean.
In Figure 2 we show the full-resolution map of
the 21-cm continuum radiation, derived from the outer channels,
superposed on an Ha photograph taken with the Kitt
Peak 2.1-m telescope and kindly made available to us by
Lynds (1974).
The rms noise in this map is 1.0 K in
brightness temperature Tb. The grating responses
of a point source of intensity 180 ± 30 mJy (1 mJy
= 10-29 W m-2 Hz-1) at
=
12h47m35.4s ± 0.2s,
=
+41°47'19" ± 3" (1950.0), which ran through the
galaxy, have been subtracted. The are on the southeast side (at
=
12h48m46s,
= 41°23') well outside
the region of H
emission is partly spurious, arising from small DC offsets
in the correlators. These offsets undoubtedly have a
slight effect on other parts of the map also. The total
continuum flux in our map is 0.29 ± 0.06 Jy.
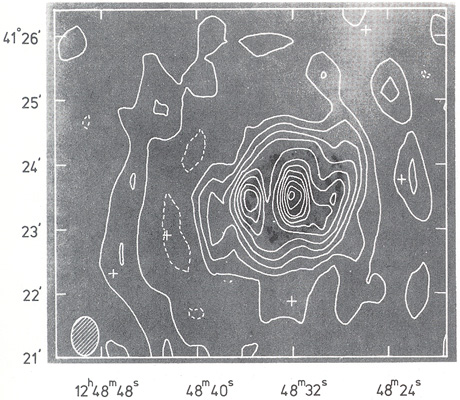 |
Figure 2. Map of the 21-cm continuum
radiation obtained from the present study, superposed on an
H |
Our map can be compared with the map made by
van der Kruit (1971)
using the WSRT 21-cm continuum
receiver with a 4 MHz bandwidth. Although his map has
about the same sensitivity as ours, his shortest spacing
was 180 m, whereas ours was 36 m. This implies that
in our map gaussian-like source structures of size
 9.0' × 13.5' are
attenuated by 50% or more, while in
van der Kruit's map source structures
1.8' × 2.7' are
already attenuated by the same amount. This explains the
major difference in the appearance of the two maps,
namely the fact that the general disk emission which we
find is completely absent from van der Kruit's map.
Furthermore, the western "source" seems to be more an
enhancement above the disk emission rather than a
discrete source. We find that the disk emission within 1.5'
radius has an average Tb of 3-4 K. After subtraction of
this disk component, an unresolved central source remains with a flux
density of 18 ± 3 mJy at
=
12h48m31.9s ± 0.3',
= + 41°23'28"
± 7" (1950.0), in good agreement with the observations of
van der Kruit (1971).
Recent 6-cm observations at Westerbork
(De Bruyn, 1977)
indicate that this source has a non-thermal spectrum;
its luminosity at 21 cm is roughly 30 times that of Sgr A
at the center of our own galaxy. As can be seen in
Figure 2, the eastern and western sources are
both somewhat extended and
correspond very well with the H II regions. However, the detailed study by
de Bruyn (1977)
shows that these sources have a non-thermal spectrum
(alpha ~ - 0.5).
9.0' × 13.5' are
attenuated by 50% or more, while in
van der Kruit's map source structures
1.8' × 2.7' are
already attenuated by the same amount. This explains the
major difference in the appearance of the two maps,
namely the fact that the general disk emission which we
find is completely absent from van der Kruit's map.
Furthermore, the western "source" seems to be more an
enhancement above the disk emission rather than a
discrete source. We find that the disk emission within 1.5'
radius has an average Tb of 3-4 K. After subtraction of
this disk component, an unresolved central source remains with a flux
density of 18 ± 3 mJy at
=
12h48m31.9s ± 0.3',
= + 41°23'28"
± 7" (1950.0), in good agreement with the observations of
van der Kruit (1971).
Recent 6-cm observations at Westerbork
(De Bruyn, 1977)
indicate that this source has a non-thermal spectrum;
its luminosity at 21 cm is roughly 30 times that of Sgr A
at the center of our own galaxy. As can be seen in
Figure 2, the eastern and western sources are
both somewhat extended and
correspond very well with the H II regions. However, the detailed study by
de Bruyn (1977)
shows that these sources have a non-thermal spectrum
(alpha ~ - 0.5).
The low-resolution channel maps which contain line
emission are shown in Figure 3. The total flux
density in each map was determined to construct an integrated H I
profile, which is shown in Figure 4. We also
show for comparison a single dish profile obtained with the 25-m
Dwingeloo telescope by
van der Hulst et
al. (1975).
The agreement between the two profiles is a good indication
that we have not missed any significant H I emission in
the present interferometric observations. The double-peaked structure of
the profile is typical of that observed
in spiral galaxies. The total H I distribution, i.e., integrated over
all velocities, at low resolution is shown in
Figure 5, superimposed on a photograph taken on the
2.1-m Schmidt telescope at Hale Observatories (this
photograph was kindly made available to us by Dr.
H. C. Arp). The most striking feature in this map is the H I
emission which is clearly detected in many parts of the
faint outer ring. The strongest emission in this ring is
found on the western side, corresponding with faint H it
regions and dust patches. The eastern and western optical
connections to the main body of the galaxy can also be
traced in the H I emission, while the optical gaps correspondingly
exhibit a relative absence of neutral gas.
Integration of the map yield a total H I mass of 7.6 × 10
M, if we
place the galaxy at a distance of 6 Mpc,
corresponding to the mean velocity of the CVn I group of
which it appears to be a member
(Sandage and Tammann,
1975),
and a Hubble constant of 55 km s-1 Mpc-1.
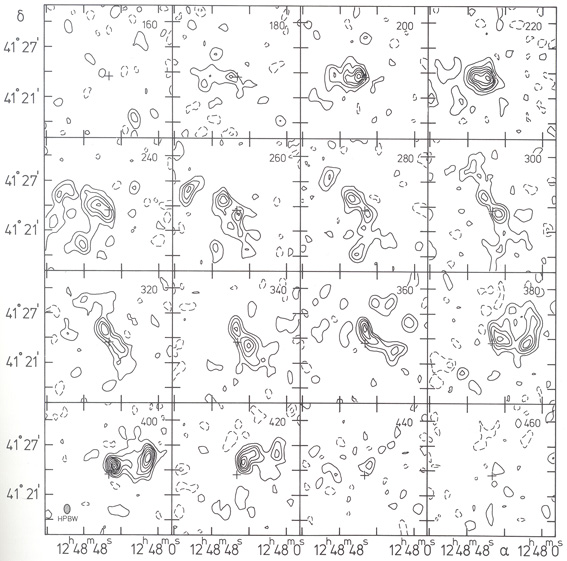 |
Figure 3. Low resolution channel maps. Contour interval is 1.0 K in Tb or three times the rms noise. The heliocentric velocity (in km s-1) is noted in the upper right hand corner of each channel map; the central cross marks the position of the nuclear radio source. |
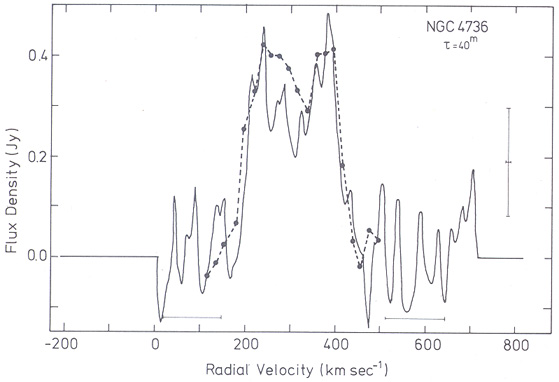 |
Figure 4. Single dish profile, measured
with the 25-m Dwingeloo telescope
(solid line), compared with the profile obtained by integrating the
individual channel maps of this study (dashed line). The error bars
denote the velocity resolution and flux uncertainty
(± 3 |
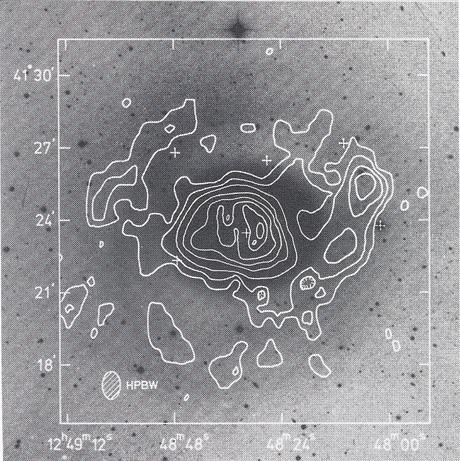 |
Figure 5. Map of the total H I distribution (integrated over all velocities) at low resolution, superimposed on a 1.2 in Palomar Schmidt photograph. The contour interval is 1.5 × 10²¹ atoms cm-2 and the lowest contour is 1.0 × 10²⁰ atoms cm-2. |
Detailed structure in the central regions is smoothed out in the low resolution map, and can be better seen in the full resolution map, shown in Figure 6, where the H I distribution has been superposed on a blue photograph taken by Lynds (1974) with the 2.1-m telescope at Kitt Peak. The strongest emission in this map coincides in position with the H I regions in zone b) (0.7 to 1.0' radius). In zone a) there is a relative lack of neutral gas, a phenomenon which is generally observed in the central regions of spiral galaxies. Through inspection of the individual profiles we have investigated whether this central depression could be possibly caused by absorption against the central continuum source. The profiles at the position of the nucleus do not show any significant positive or negative peaks with respect to the continuum, indicating that no net H I emission or absorption is present. It is therefore highly likely that the relative absence of neutral gas in the center is real. The zone c) of outer spiral structure shows a patchy emission, especially on the eastern side, where large H I regions are The low resolution map, however, indicates that these patchy features are not truly isolated, but rathe top of an extended distribution of neutral gas.
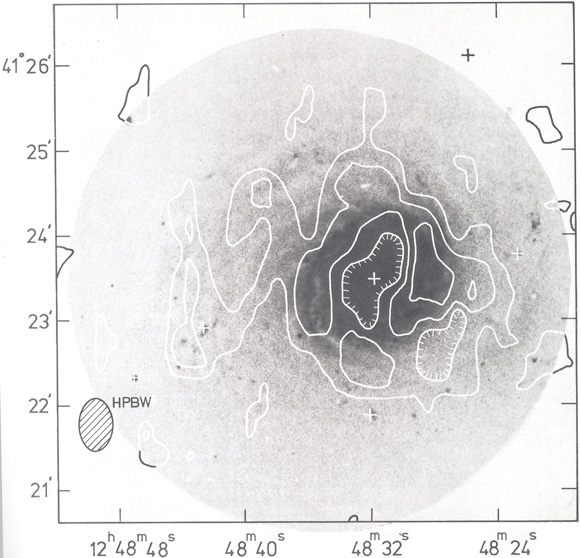 |
Figure 6. Full resolution H I distribution, superimposed on a blue photograph (Lynds, 1974). The contour interval is 4.3 × 10²⁰ atoms cm-2. |
Assuming a position angle of 122° and an inclination of 35° (see Sect. IVa), we have also computed the variation of hydrogen column density with radius when integrated over all longitudes (Fig. 7). The ring appears as a transition zone between the steeper drop in region c) and a more gradual fall-off in the outer portions.
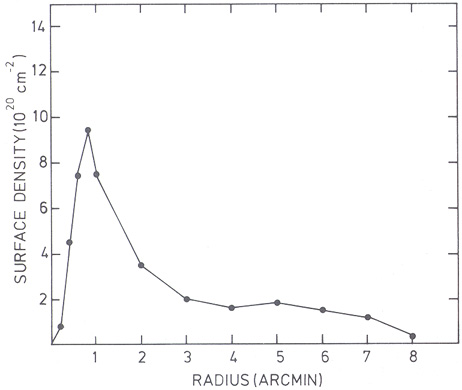 |
Figure 7. H I surface density, integrated over galactocentric longitude, as a function of radius. The inner four points were obtained from the full resolution data; the outer eight points from the low resolution data. |
From contour plots of channel signal as a function of velocity and right ascension at each declination, it appeared that most profiles have a simple appearance with one peak only. We have therefore computed an intensity weighted mean velocity field from the profiles using the window method outlined in Section II. In a few places corrections have been made for disturbing noise peaks close to the proper signal. The resulting mean velocities, both at low and full resolution, can in general be defined to an accuracy of 10 km s-1 or better. There are some positions in the map, however, where the HI signal, although definitely present, is too weak for a proper determination of a velocity.
A contour map of the low resolution velocity field, superposed on the 1.2-m Schmidt photograph, is shown in Figure 8. The full resolution velocity map, which is only well defined in the central regions of the galaxy, is shown in Figure 9. Dashed contours do not represent actually measured velocities, but are drawn only to indicate a possible continuity in the velocity contours, and thus include some subjective interpretation.
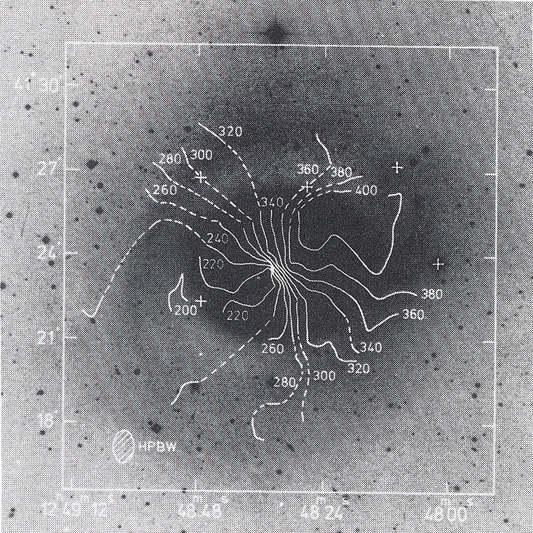 |
Figure 8. Map of the low resolution velocity field, superposed on the 1.2 m Palomar Schmidt photograph. The contour interval is 20 km s-1. Dashed contours do not represent measured velocities, but are drawn to indicate possible interpolations in the velocity map. |
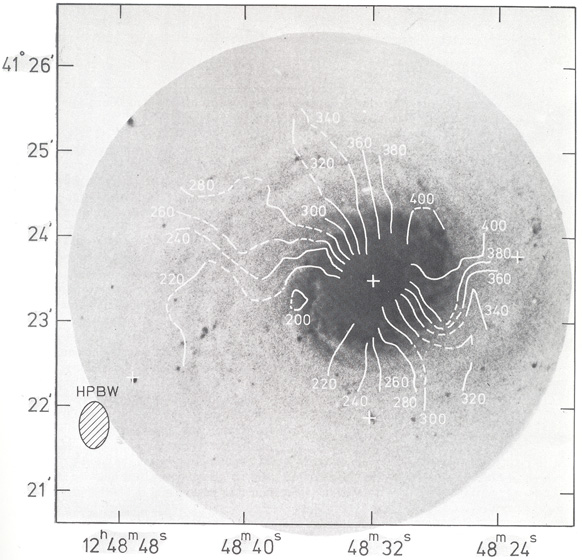 |
Figure 9. Full resolution velocity field superposed on a blue photograph (Lynds, 1974). The contour interval is 20 km s-1. Dashed contours do not represent measured velocities, but rather possible interpolation. |
From the full resolution map we can conclude only that we are dealing with a differentially rotating galaxy. No peculiar motions on a scale larger than the synthesized beam are found. The kinematical pattern of the inner regions is also generally followed in the outer ring velocities visible on the low resolution map (Fig. 8). There is, however, a definite change in the position angle of the major axis as one moves outwards. Perhaps the most striking feature is the discrepancy between the position angle of the major axis defined by the optical isophotes of zone c) and the HI kinematical major axis. This must indicate that a planar axisymmetric model cannot be wholly applicable for this galaxy. Note also that in both velocity maps the minor axis is not exactly perpendicular to the major axis.
A rotation curve can be derived from the observed radial velocity field if we assume that the galaxy is a flattened system in which circular motions dominate. Although not entirely true in the case of NGC 4736, this assumption will still yield reasonable values for the rotation curve as well as the primary parameters to be fit, namely the inclination of the galaxy, the position angle of the line of nodes, and the systemic velocity of the galaxy.
For the dynamical center of the galaxy we have adopted the position of the nuclear continuum source. The systemic velocity has been determined by assuming the velocity field to be symmetrical with respect to the center, yielding Vsys = 307 ± 5 km s-1. The inclination and position angle of the line of nodes have been calculated in the following manner. For assumed values of these quantities, the circular.velocity in successive annuli about the centre is calculated at each galactocentric longitude. We then adopt the values of the parameters which yield the lowest dispersion (i.e., the lowest variations over longitude) of the circular velocity in any given annulus. This method has been described in detail by Warner et al. (1973). We have tried various sizes of annuli, ranging from 1.0' to 2.5', on both the low resolution and the full resolution data. For the position angle of the line of nodes we find for the inner parts [zones a) and b)] p.a. = 122° ± 3°. In zone c), however, this angle gradually changes to p.a. = 114° ± 6°. In all cases the best fit for the inclination is i = 35° ± 10°.
Because the inclination does not change with radius and the effect of the position angle change is not large, we have derived a, single rotation curve to represent the large scale velocity field (Fig. 10). The error bars for each point in this figure represent the rms deviation in the mean value of the circular velocity. Subtraction of a model velocity field, based on the rotation curve of Figure 10, from the observed velocities yields a map of the residuals which shows the highly systematic pattern, expected for a change in major axis position angle. However, the largest deviations are no more than 30 km s-1 indicating that our rotation curve is still a fair estimate of the axisymmetric motions.
 |
Figure 10. Rotation curve of NGC 4736. The plotted points are derived from the measured radial velocity field. The line represents the model which was adopted for further calculations. At a distance of 6 Mpc, 1.0' = 1.75 kpc. |
The central slope of the rotation curve determined
from our data is not as steep as the one found optically by
Chincarini and Walker
(1967).
Since this is undoubtedly a
result of our inferior angular resolution, we have replaced
the innermost part of our rotation curve (out to ~ 36") by the
optical curve. With this rotation curve the mass
surface density distribution was calculated using a flat
disk model in the manner described by
Nordsieck (1973).
Integration to the last observed point (at R = 9.6 kpc,
taking the distance to the galaxy to be 6 Mpc) yields a
total mass MT = 5.3 × 10¹⁰
M,
uncertain by at least a factor of 2. The derived value of
MH / MT = 0.02
is typical for an Sab spiral. Furthermore, the apparent blue magnitude,
corrected for galactic absorption and corrected to face
on, is BT0 = 8.58
(de Vaucouleurs et al.,
1976)
giving a luminosity of 2.1 × 10¹⁰
L.
Thus MT / L = 2.5. These values are in agreement
with what one commonly finds for Sab galaxies (cf.
Balkowski, 1973;
Roberts, 1976).
b) Comparison with Other Observations
The value of 307 ± 5 km s-1 determined for the HI systemic velocity agrees well with the value obtained by van der Kruit (1976) of 314 ± 1 km s-1. in his latest study using high dispersion spectra of the H it regions in zone b). Our value does not, however, agree with the value of 259 ± 5 km s-1 measured by Chincarini and Walker (1967) or with the overall "best value" of 246 ± 12 km s-1. compiled by Sandage and Tammann (1975). We believe it likely that the discrepancies are caused by zero point errors in the velocity scales of the earlier optical measurements.
Our value of 122° ± 3° for the position angle of the line of nodes in the inner regions agrees with that found by S. M. Simkin (private communication) from detailed photometry. It differs from the value of 114° ± 2° derived by van der Kruit (1976) for a model of circular rotation fit to his data. If one assumes that our value for the position angle is correct, then we must conclude that the H II zone exhibits non-circular motions on the basis of van der Kruit's velocity data. However, since these motions are expected to be as high as 30 km s-1, we should have seen some effects in our full resolution data, even when one takes our relatively large beam size into account. We do not know how to solve this discrepancy. We note also that our 21-cm continuum map (Fig. 2) does not show two distinct point sources in the H II zone as van der Kruit's (1971) map did, but seems to be better described as showing a ring-like enhancement coinciding with the H II zone. The two apparent sources on a line close to the line of nodes can then be the result of the convolution of our synthesized beam with a ring-like distribution in the plane of the galaxy. Although Lynds' (1974) drawing shows that the H II-regions zone does not correlate well with the dust lane-pattern, suggesting that these H I regions indeed comprise a distinct feature, we do not find much support for the idea that NGC 4736 has recently experienced an explosion in the nucleus causing an expanding H II ring or a triple radio source.
Our detection of neutral gas in the outer ring indicates that Population I material is also present in the outermost parts of the galaxy. The photometric results of Simkin confirm this notion in that the ring is found to consist of blue filaments amongst a red population (B - V ~ 1.0). The change in the position angle of the line of nodes also agrees with a gradual change in the photometric major axis measured by Simkin. This change may either indicate that not all the regions of the galaxy are in the same plane or that there exist large deviations from axial symmetry.
Study of NGC4736 has revealed a number of puzzles. Models for this galaxy should be compared with the following observational facts:
Several interpretations can be suggested. Two of us
(AB and JMH) favor a model involving oval orbits due to
a bar-like disturbance in an otherwise axisymmetric, flat
disk. In such a model velocities are calculated by slightly
perturbing circular orbits into ovals and giving all ovals a
certain pattern speed, The observed velocity field can
qualitatively be reproduced for a suitable choice of the
pattern speed of the bar-like disturbance, and of the axial
ratio of the ovals in the plane of the galaxy. Moreover, the
potential distribution of such a bar-like distortion closely
resembles the observed light distribution, including the
outer ring and the gaps. It appears then that NGC 4736 can be characterized as a
" galaxy", where the
central body is a kind of fat bar. Similar suggestions have been
made for other galaxies like NGC 4151
(Bosma et al., 1977)
and NGC 1068 and NGC 1291
(De Vaucouleurs, 1975).
On the other hand,
Schommer and Sullivan
(1976)
argue that the morphological features of the galaxy
(inner and outer rings; gap) are most naturally interpreted as
corotation and Lindblad resonances. Finally,
van der Kruit (1976)
favours the view that non-circular motions
are present in the inner H II ring and that
they, along with the apparent extended radio sources
(Fig. 2), are a manifestation of nuclear
activity. Further theoretical work is obviously warranted in an effort to
understand this enigmatic galaxy.
galaxy", where the
central body is a kind of fat bar. Similar suggestions have been
made for other galaxies like NGC 4151
(Bosma et al., 1977)
and NGC 1068 and NGC 1291
(De Vaucouleurs, 1975).
On the other hand,
Schommer and Sullivan
(1976)
argue that the morphological features of the galaxy
(inner and outer rings; gap) are most naturally interpreted as
corotation and Lindblad resonances. Finally,
van der Kruit (1976)
favours the view that non-circular motions
are present in the inner H II ring and that
they, along with the apparent extended radio sources
(Fig. 2), are a manifestation of nuclear
activity. Further theoretical work is obviously warranted in an effort to
understand this enigmatic galaxy.
Acknowledgements. We are grateful to the staff of the Netherlands Foundation for Radio Astronomy for their indispensable aid in this work. Discussions with our colleagues at Groningen have been most beneficial for the data reduction and analysis. We thank several people, in particular H. C. Arp, A. G. de Bruyn, P. C. van der Kruit, and S. M. Simkin, for communication of unpublished results. Finally, none o f this work would have been possible without the support o f the PDP-9 and Cyber 74 computers of the Computing Centre of the University of Groningen.
WTS thanks the Foundation for their support. AB acknowledges financial support from Z.W.O., The Westerbork Synthesis Radio Telescope is operated by the Netherlands Foundation for Radio Astronomy which is financially supported by the Netherlands Organization for the Advancement of Pure Research (Z.W.O.).
 ) in the
Dwingeloo measurement.
) in the
Dwingeloo measurement.