


Summary. 21 cm HI line observations are reported for the galaxy NGC 3198. Maps with angular resolution of 25" × 35" are presented. Little continuum radiation is associated with this galaxy. The nucleus shows up as a point source of 4 ± 1 mJy. The HI distribution corresponds with the optical picture except for a tail in the outer NE part. The velocity field is very regular, a few deviations from axial symmetry are found at a level of 7.5 km s-1. The outer-most HI rings are possibly slightly warped. In the inner parts the small bar in the central regions probably causes a deformation of the circular orbits into oval ones. The radial distributions of gas mass and total mass are incompatible with the one-zone galactic disk evolution models proposed by Talbot and Arnett (1975).
The galaxy NGC 3198 is classified as a spiral of type SB(rs)c (De Vaucouleurs et al., 1976), but on photographs such as the Palomar Sky Survey prints the bar is not very prominent. The dimensions of the galaxy, according to Holmberg (1958), are 11.9' × 4.9'. The galaxy is shown in Fig. 1, which is a print of a IIIaJ plate taken by Van der Kruit and Bosma with the 1.2 m Schmidt telescope at Palomar Mountain. The bright nucleus is surrounded by a ringlike structure with dimensions 1.75' × 0.5'. Inside the ring a small bar is present; outside this ring the spiral arms are visible.
 |
Figure 1. Print of a plate (IIIaJ+Wr2C) of NGC 3198 obtained with the 1.2 m Schmidt Telescope at Palomar Mountain (Van der Kruit, 1978). |
Little is known about this galaxy. Roberts (1968) measured its integral HI profile. Optical spectroscopy of the inner regions (out to 1.3' radius) is available from the work of Cheriguéne (1975). She finds that the amplitude of the non-circular motions associated with the bar are small.
We have observed this galaxy in the 21 cm line as part of a
program to study the distribution and kinematics of the neutral
hydrogen in spiral galaxies of various morphological types
(Bosma, 1978).
The angular resolution of our data,
25" × 35" ( ×
×
 ), is
sufficient to determine the larger scale kinematics of the disk of
the galaxy. The HI distribution extends to about 8' radius; deviations
from circular motion in the velocity field are present but
have small amplitude. In section 2 of this paper we
describe the observing procedure and the data processing; in
section 3 we present
the results, which are discussed in section 4.
), is
sufficient to determine the larger scale kinematics of the disk of
the galaxy. The HI distribution extends to about 8' radius; deviations
from circular motion in the velocity field are present but
have small amplitude. In section 2 of this paper we
describe the observing procedure and the data processing; in
section 3 we present
the results, which are discussed in section 4.
2. Observations and data processing
The observations have been made with the Westerbork Synthesis
Radio Telescope (WSRT) and its 80 channel filter spectrometer
(Allen et al., 1974).
The effective system temperature was 160 K,
the filterwidth at half power 129 kHz, corresponding to 27 km
s-1.
in velocity. Measurements have been made for twenty antenna spacings
ranging from 36 m to 1404 m in increments of 72 m. The resulting
synthesized beamwidth is
25" × 35" ( ×
); first
grating responses occur at 10' × 14'. To cover the radial velocity
range of the galaxy four settings of the local oscillator were necessary,
providing 32 channel. maps with heliocentric velocities 360 to 960
km s-1 in intervals of 20 km s-1. The maps were
obtained by application of the standard WSRT reduction programs
(Högbom and Brouw,
1974)
for calibration and Fourier transformation. The rms noise
level in each channel map is 2.0 K. The maps are centered on the,
nucleus of the galaxy.
The channel maps contain both line and continuum radiation. By examining the maps it was found that 19 channels contain both HI and continuum, while the remaining 12 contain only continuum radiation. Due to a system fault one interferometer was not calibrated for one of the line channels and two of the continuum channels. In the case of the line channel map we omitted this interferometer in the Fourier transform; the resulting distortion of the map was corrected with the procedure CLEAN (Högbom 1974). The two poor continuum channels were also omitted. We averaged the ten remaining maps into one map representing the continuum radiation of the galaxy and its surroundings. This map has been subtracted from all the other maps which then contain line radiation only.
There were still several problems to solve before a map of the total HI distribution could be made. The galaxy is so large compared to the size of the grating rings that an overlap in position occurs between genuine signal in one channel and grating rings, due to HI emission from the other side of the galaxy, in several other channels. Yet for each individual channel map the HI signal is contained well within the first grating ring. Another problem arising from the chosen interferometer configuration is that the base level of the maps outside the HI signal is not zero. Moreover we did not measure the 0 m spacing with the result that source structures larger than about 10' are severely attenuated. We have tried to solve these problems by applying CLEAN to all channel maps (cf. Bosma, 1978). As a check we have constructed an integral HI profile by integration of the line channel maps with the aim of comparing this profile with single dish data from the 100-m Effelsberg telescope and the 25-m Dwingeloo telescope (Van der Hulst et al., priv. comm.). Unfortunately, as discussed elsewhere (Bosma, 1978), the accuracy of these measurements is inadequate for a meaningful comparison.
The cleaned channel maps were used to construct maps of the HI distribution and radial velocity field. This was done with the window method described by Bosma (1978). In order to detect weak, extended HI emission we smoothed the channel maps to resolutions of 50" × 70" and 90" × 90", and applied the window method also to those maps. No important additional information has been obtained from the resulting HI distribution and velocity fields.
The continuum map, formed from 10 channels outside the HI velocity range, has been processed further. All the background point sources and their instrumental responses have been subtracted. The resulting map shows very little emission coincident with the galaxy itself. Unfortunately, at low levels the map is contaminated by an unremovable instrumental response arising from a strong point source in the field. We definitely detect a source coinciding with the nucleus of the galaxy, its flux density is 4 ± 1 mJy. There is also weak emission coinciding with the inner spiral arms, but the noise level of the map is too high to study this more quantitatively. Smoothing of the map to a resolution of 1' × 1' confirms the reality of this emission. We estimate the total flux density of this galaxy at 21 cm to be 50 ± 10 mJy. Observations with a more sensitive receiver will be needed to study the spiral structure in the continuum properly.
The channel maps containing detectable line emission are shown in Fig. 2. From these maps we can conclude that NGC 3198 deviates very little from the classical picture of spiral galaxies being inclined disks in differential rotation. In Fig. 3 we present the map of the HI distribution, superposed on the IIIaJ photograph. The rms noise in the map varies with position because of the varying number of channels included in the summation (cf. Bosma, 1978). In most places it is about 1.5 × 10²⁰ atoms cm-2.
 |
 |
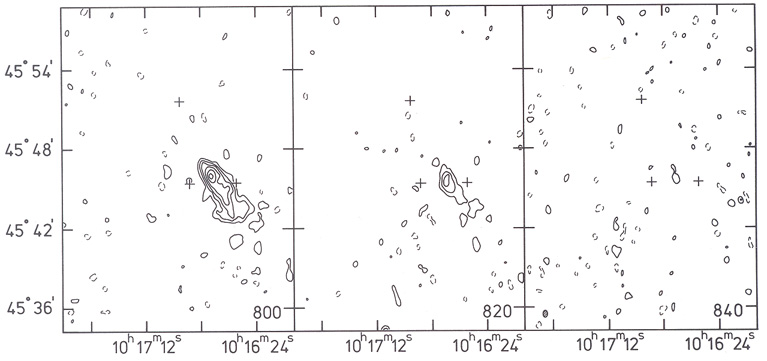 |
Figure 2. Maps of the 21 cm line radiation. Contour units are 4.0 K, dashed contours are negative and the zero contour is omitted. The heliocentric velocity (in km s-1) of each channel map is indicated in the lower right corner, the crosses refer to star positions. These maps are not corrected for the primary beam. |
 |
Figure 3. Map of the HI column density distribution in NGC 3198, superimposed on the IIIaJ print. The contour interval is 5.3 × 10²⁰ atoms cm-2, the first contour is 5.3 × 10²⁰ atoms cm-2. |
The following points are noteworthy in the map:
The HI column density in the central region is smaller than that in the area of the bright spiral arms.
There is a good correspondence between enhancements in the HI distribution and the optically visible spiral arms.
The extent of the HI distribution seems much larger than the extent of the optical emission. Note, however, that the HI size, if defined as the mean diameter of the 1.5 × 10²⁰ atoms cm-2 (surface density) contour, is only 1.3 times the Holmberg diameter.
There are asymmetries in the distribution. Note especially the long tail in the NE part of the galaxy, which does not appear to be associated with optical emission. There is no such tail at the other side of the galaxy.
From integration of the channel maps we derive a hydrogen mass
of 5.1 × 10⁹
M . In
this computation we have assumed a distance of 9
Mpc to NGC 3198. This value is based on its systemic
velocity and a Hubble constant of 75 km s-1 Mpc-1.
. In
this computation we have assumed a distance of 9
Mpc to NGC 3198. This value is based on its systemic
velocity and a Hubble constant of 75 km s-1 Mpc-1.
The map of the radial velocity field is shown in Fig. 4, superimposed on the IIIaJ print. The profiles at each point have a simple shape with one peak, therefore the intensity weighted mean velocities are defined unambiguously with an accuracy better than 10 km s-1. The full width at half maximum of the profiles (corrected for filterwidth) is typically 30 km s-1. Note, however, that the filters are not designed to properly measure the second moment of the profile (cf. Allen et al., 1974). Part of the profile width is due to differential rotation within the beam and other large scale motions that may occur on the scale of the beamsize (1.1 × 1.5 kpc). Therefore we did not attempt to derive the turbulent motions of the interstellar gas from the profile widths.
 |
Figure 4. Map of the radial velocities in NGC 3198, superimposed on the IIIaJ print. The numbers indicate heliocentric velocities in km s-1. |
From Fig. 4 we conclude that in first approximation NGC 3198 is a flat galaxy in differential rotation. A close look, however, reveals the following deviations from axial symmetry:
The position angle of the major axis, i.e. the line of extreme radial velocities, changes slightly when going radially outwards.
In the central regions the minor axis contour is not perpendicular to the major axis.
At the northeastern edge and the southwestern edge there are "kinks" in the contours.
These deviations from axial symmetry are of the order of 7.5 km/s.
We have plotted profiles along the lines through the nucleus at which Cheriguéne (1975) measured radial velocities. The HI velocities and the optical velocities are in agreement to within 10 km s-1, hence the effect of the coarse resolution of the 21 cm data on the rotation curve in the inner parts is negligible. The spatial resolution is, however, too coarse to find the peculiar velocities of order 20 km s-1 in the area of the small central bar which are present in Cheriguéne's data.
a) Rotation-curve-and mass model
We have derived a rotation curve for NGC 3198 on the assumption
that the galaxy is a flat disk in circular motion. For the position
of the dynamical centre we take the position of the optical nucleus:
=
10h16m52.1s,
= 45°48'00"
(1950.0)
(Gallouët et al.,
1973),
which coincides within a few arcsec with the 4a point source in the
continuum
map. We find the systemic velocity of the galaxy to be 660 ± 5
km s-1, based on the symmetry of the velocity field around
the centre. The position angle of the line of nodes,
 , and the inclination, i,
have been determined from the radial velocity field as follows:
We divide the galaxy into concentric annuli, each 30" wide. Then we
calculate in each annulus for given values of
, and i the mean
circular velocity, Vc, and the dispersion around this
mean. The finally adopted rotation curve is the solution for
Vc(r) with the smallest
dispersions. Although
varies slightly in the outer parts
(cf. section 4c) we have neglected this in the
determination of the rotation curve. We find
= 36° ± 2°
and i = 70° ± 3°. The resulting rotation
curve is shown in Fig. 5a.
, and the inclination, i,
have been determined from the radial velocity field as follows:
We divide the galaxy into concentric annuli, each 30" wide. Then we
calculate in each annulus for given values of
, and i the mean
circular velocity, Vc, and the dispersion around this
mean. The finally adopted rotation curve is the solution for
Vc(r) with the smallest
dispersions. Although
varies slightly in the outer parts
(cf. section 4c) we have neglected this in the
determination of the rotation curve. We find
= 36° ± 2°
and i = 70° ± 3°. The resulting rotation
curve is shown in Fig. 5a.
 |
Figure 5. Radial distributions of various
quantities. In panel a
we show the rotational velocities (dots), the interpolated rotation
curve used for the mass model (full line), and the best fit exponential
disk model (dashed line). In panel b we show the
distribution of
neutral hydrogen surface density (dots) and the unscaled
distribution of HII regions. In panel c the thin full line is log
|
From the rotation curve we have calculated a mass model with the method outlined by Nordsieck (1973). In this method the rotation curve is directly inverted into a mass surface density distribution using the thin disk approximation. The result is shown as the full line in Fig. 5c. Also shown in Figs. 5a and 5c is an exponential disk model, with maximum rotational velocity Vmax = 158.0 km s-1 and turnover radius Rm = 3.5', which fits the inner parts of the rotation curve remarkably well. Note that at the outermost radius of 10' the difference in rotation velocity between the observed curve and the exponential disk model is 30 km s-1 which in mass surface density results in a difference of a factor 10. Clearly this galaxy cannot be modelled by a simple exponential disk model. It could be that the line of sight component of the velocity vector in the outer parts has components other than the projected circular velocity; if the difference is to be explained by z-motions their amplitude must be about 60 km s-1.
The total mass out to 25.7 kpc, Mo, is
9.2 × 10¹⁰
M. Since
BTo = 10.45
(De Vaucouleurs et al.,
1976)
we find values for MH / Mo of
0.055, MH / LB of 0.64 and
Mo / LB of
11.5. We have also fitted the
rotation curve with a Toomre n = 1 disk model
(Toomre, 1963).
The total mass in that model is 1.0 × 10¹¹
M. This
indicates that little
additional mass resides outside the last measured point,
Ro, on the
rotation curve. This situation is quite contrary to that in NGC 5033
(Bosma, 1978)
where, with similar mass model procedures, it
was found that 407 of the mass lies outside Ro. Although
NGC 5033 and NGC 3198 are both of type Sc, their difference in mass
distribution is striking. Also in the inner parts there is a large
difference in central mass concentration: in NGC 5033 there is a
sharp rise in
 M towards the
centre, while in NGC 3198 this rise is
very gentle. Perhaps these differences reflect differences in size
and mass within one Hubble type (NGC 5033 is 2.5 times as massive
as NGC 3198). A comparison of mass models for 24
galaxies will be presented elsewhere (see
Bosma, 1978).
M towards the
centre, while in NGC 3198 this rise is
very gentle. Perhaps these differences reflect differences in size
and mass within one Hubble type (NGC 5033 is 2.5 times as massive
as NGC 3198). A comparison of mass models for 24
galaxies will be presented elsewhere (see
Bosma, 1978).
The radial distribution of neutral hydrogen surface density
(i.e. column density times cos i), again averaged in annuli of 30"
width, is shown in Fig. 5b. This distribution
can be used to derive
the radial distribution of the ratio of total mass to gas mass
which plays a significant role in galactic evolution models. Our 21
cm observations, however, provide only an estimate of the ratio
total mass to HI gas mass. To estimate the contribution to
the gas
mass of the other constituents of the interstellar medium is very
difficult. The observationally most accessible quantity is the radial
distribution of the number of HII regions. By analogy with the
situation in our Galaxy (see
Burton, 1976)
we can assume that this
radial distribution will not differ too much from that of carbon
monoxide, and that the carbon monoxide distribution will give us the
distribution of molecular hydrogen. The general validity of this
chain of arguments is of course questionable, but at present this is
the only way to proceed a little further. We estimated the radial
distribution of HII regions in NGC 3198 from an
H plate taken by
Van der Kruit and Bosma with the 1.2 m Schmidt telescope at Palomar
Mountain. The result, which is uncalibrated in terms of surface
density, is shown as the dotted line in Fig. 5b.
A possible surface density distribution of the gas,
G(r),
in NGC 3198 is shown as the
dotted line in the lower half of Fig. 5c.
Comparison with the total mass surface density,
M
m(r), yields between 2' and 7' radius a
constant ratio of total mass-to-gas mass with a value of 10 ± 3.
b) Comparison to Talbot and Arnett's work
We will now compare our results on the radial distributions of total mass and gas mass with the galactic evolution calculations of Talbot and Arnett (1975, hereafter denoted as TA). They calculate the evolution of a flat disk galaxy under the following assumptions:
The galaxy can be divided in annular zones; the
evolution in each zone is independent on that in the others, and depends
only on the mass surface density,
M(r).
The initial mass function (IMF) is constant with radius as well as in time; at t = 0 we start with gas only.
The rate of star formation is either a power law or follows from a metal-enhanced star formation model. The former does not account properly for the paucity of metal-poor G stars in the solar neighbourhood, the latter one does. The physics of star formation is assumed to be intimately connected with the physical state of the interstellar medium, for which a number of properties are adopted.
The calibration of the model is done on the solar
neighbourhood, for which it is assumed that
M(r) /
G(r) = 10
at the present
epoch. TA then make predictions for-the radial distribution of the
gas-to-total mass ratio for various star formation models. They also
list for one specific star formation model and a series of exponential
disk mass models predictions for the radial distributions of
neutral hydrogen, of HII regions, and of colour (B-V).
We have made a comparison of the predictions from TA's work
with the results obtained in section 4a. The model
results have been scaled to Rmax = 3.5' and
Vmax = 158 km s-1; the
resulting value of the central mass surface density is
560M
pc -2. We limit the comparison to the region within 6', outside
this limit the observed rotation curve deviates considerably from that
of the exponential disk.
In Table 1 we collect a few predicted and
observed quantities. For
several quantities there is good agreement, but there are also large
differences. For instance, the peak of the gas distribution occurs
much closer to the centre than the model predicts. Also, the observed
colour is much bluer than the predicted one. In
Fig. 5d we compare the radial variation of
M /
G for both a
power law model and the metal enhanced star formation model with the
observed one (we now take
M(r)
as derived with Nordsieck's
method). Both models predicts in the inner parts far too much gas
consumption; note that the discrepancy gets larger if the total amount
of gas has been underestimated. In the outer parts too much gas is left
over. The intrinsic colour of NGC 3198 is lower than any of the
predicted colours in TA's models.
| observed | predicted | |
| Central surface density
o |
560
M
pc-2 |
|
| Total mass in exp. disk | 6.4 × 10¹⁰
M |
|
| Hydrogen mass/total mass | 0.08 | 0.12 |
| Hydrogen mass/luminosity | 0.64 | 0.8 |
| Total mass/luminosity | 8.0 | 6.4 |
| Holmberg radius/R† | 3.66 | 3.6 |
| HI peak radius/R | 1.23 | 2.8 |
| HII peak (young stars)/R | 1.23 | 2.0 |
| < B - V > o | 0.42 | 0.71 |
| † is the scalelength of the exponential disk: Rmax = 2.15R, R = 1.63' (= 4.3 kpc) | ||
We conclude that TA's model does not reproduce the observations
very well. The observed near constancy of the ratio of
M /
G over a
large part of the disk of the galaxy is difficult to match if the
physics of star formation is assumed to be controlled by
M(r),
which clearly decreases with radius. A possible explanation can be that
M(r)
as we have derived is partly composed out of stars which
were formed in the early evolution by a process different from the
process of star formation prevailing at the present epoch. It is very
difficult, however, to estimate which fraction of the stars already
existed before the disk evolution started. There are more problems in
TA's approach. Recent work by Freeman and Da Costa
(Freeman, 1977)
indicates that the IMF is probably not constant. Furthermore, the
value of 10 for
M /
G in the solar
neighbourhood is probably an underestimate. From data of Gordon and
Burton (1976)
we find M /
G
 25.
Perhaps a recalibration of the models will result in a better fit of
the parameters listed in Table 1. The problem of
the nearly constant mass-to-gas ratio, however, will not be solved so
easily, and may require abandoning the one zone approach.
25.
Perhaps a recalibration of the models will result in a better fit of
the parameters listed in Table 1. The problem of
the nearly constant mass-to-gas ratio, however, will not be solved so
easily, and may require abandoning the one zone approach.
c) Deviations from axial symmetry
We have made a map of the residual velocities by subtracting a
model velocity field based on the rotation curve of
Fig. 5a from the
observed velocity field. The residuals are in general small
( 7.5
km s-1), but a systematic pattern remains, as can be seen in
Fig. 6.
In the inner parts the sign of the residuals is the same in opposing
quadrants; in the outer parts the sign of the residuals is opposite
in the two halves at either side of the major axis. The pattern for
large radii is one which can be removed if the position angle of
the line of nodes is gradually changed from 36° to
32°. Most likely,
this implies that the outer part of the HI distribution is slightly
warped. With regard to the origin of this warp it may be noted that
the NGC 3198 has only a few, distant, companions. Its
nearest neighbour is probably NGC 3184 at a distance of 250' (~ 630 kpc). This
distance is too large to make it plausible that the warping is due
to recent tidal interaction. It is not clear that the northern
"tail", which has a HI mass of about 108
M, and
the warp are physically associated.
 |
Figure 6. Map of the residual velocities in NGC 3198. The thick line outlines the first HI contour of Fig. 3. |
The pattern of velocity residuals in the inner parts cannot be explained so easily. Such a pattern can occur if we had chosen the wrong position for the dynamical centre. In that case, however, the systematic pattern should have extended over the whole galaxy. A dynamical interpretation of this pattern seems more likely. We suggest that the small bar in the central regions distorts the potential field of the galaxy with the result that the circular orbits are distorted into oval shaped (oval in the sense of broadly elliptical) ones. The velocity field of a model based on such slightly, deformed orbits has the characteristics we observed in NGC 3198: the minor axis is not perpendicular to the major axis, and because of that the pattern of residuals is like the one in Fig. 6. Elsewhere (Bosma, 1978) we will give a more detailed account of this model and discuss the velocity fields of some other galaxies which have characteristics similar (though much more pronounced) to those of the inner parts of NGC 3198.
We have mapped the galaxy NGC 3198 in the 21 cm line with an angular resolution of 25" × 35". The HI distribution corresponds closely with the optical picture; in the NE part a tail is found, which has no optical counterpart. The velocity field shows a few marked deviations from axial symmetry at a level of about 7.5 km s-1. The outer HI rings may be slightly warped. In the inner parts a small bar is present, which possibly causes a deformation of the circular orbits into oval ones.
Since NGC 3198 is so regular, and resembles an exponential disk, we have made an attempt to compare our results for the radial distributions of total mass and HI gas mass with prediction made from galactic evolution models. A number of difficulties were found which complicate such a comparison. The possible presence of non-circular motions in the outer parts makes the determination of a reliable mass model questionable. In the inner regions, we find evidence that the galactic disk evolution models of Talbot and Arnett (1975) are not in agreement with the observations.
A few parameters of NGC 3198, determined in this study, are collected in Table 2.
| Position (1950.0) | =
10h16m52.1s,
= 45°48'00" |
| Size (Holmberg, 1958) | 11.9' × 4.9' |
| Adopted distance | 9.0 Mpc |
| Luminosity | 7.95 × 10⁹
L |
| HI mass | 5.1 × 10⁹
M |
| Total mass, Mo, out to 25.7 kpc | 9.2 × 10¹⁰
M |
| MHI / Mo | 0.055 |
| MHI / LB | 0.64 |
| Mo / LB | 11.5 |
| Systemic velocity (heliocentric) | 660 ± 5 km s-1 |
 = 1 model
and the dashed line is TA's power law
(
= 1 model
and the dashed line is TA's power law
( = 1.5) model.