


A series of surveys were performed within the Garanteed Time (IGTES, ISOCAM Garanteed Time Extragalactic Surveys, Elbaz et al. 1999) and Open Time as summarized in the Table 1, where the surveys at 7 (6.75 µm ) and 15 µm are sorted by increasing depth irrespective of wavelength. The major strength of ISOCAM is its spatial resolution (PSF FWHM of 4.5" at 15 µm, Okumura 1998) and sensitivity, which permitted to detect galaxies down to the LIRG regime up to z ~ 1.3 in the deepest surveys (Figs. 1, 2), well above confusion. Cosmic rays were a stronger limitation than photon or readout noise by inducing ghost sources when they were not perfectly removed, especially those with long term transients associated to them. Two techniques were developped in order to solve this issue, the so-called PRETI (Pattern REcognition Technique for Isocam data, Starck et al. 1999) and LARI (Lari et al. 2001) techniques. A third technique was developped by Désert et al. (1999), in which the mosaic data were analyzed using the beam switching approach, the Three Beam technique. PRETI consists in a multi-scale wavelet decomposition of the signal, while LARI tries to account for the physical processes taking place in the detectors, including the effect of neighboring pixels. The LARI technique was first applied to the ELAIS surveys (see Oliver et al., in these book) and more recently to the IGTES surveys of the Lockman Hole (Rodighiero et al. 2004, Fadda et al. 2004) and of the Marano field (Elbaz et al., in prep.). The quality of the ISOCAM images is shown with the case of the Marano FIRBACK deep field (30' × 30') in the Fig. 6. The central part of this field was imaged at a deeper level (UDSF) and analyzed with both techniques. The resulting contours are overlayed on a VLT-FORS2 image of the field, demonstrating the consistency and robustness of both source detection algorithms (Fig. 7).
| Name |
 ( µm) ( µm) |
Area ('2) | Int.(min) | depth(mJy) | # objects |
| ELAIS N11 | 15 | 9612 | 0.7;0.7 | 1;0.7 | 490 |
| ELAIS N21 | 7;15 | 9612;9612 | 0.7;0.7 | 1;0.7 | 628;566 |
| ELAIS N31 | 7;15 | 4752;3168 | 0.7;0.7 | 1;0.7 | 189;131 |
| ELAIS S11 | 7;15 | 6336;14256 | 0.7;0.7 | 1;0.7 | 304;317 |
| ELAIS S21 | 7;15 | 432;432 | 0.7;0.7 | 1;0.7 | 40;43 |
| Lockman Shallow2, 3 | 15 | 1944 | 3 | 0.25 | 457 |
| (80% compl.) | 0.45 | 260 | |||
| Comet Field4 | 12 | 360 | 10 | 0.5 | 37 |
| CFRS14+525 | 7;15 | 100;100 | 18;11 | 0.3 ;0.4 | 23;41 |
| CFRS03+006 | 7;15 | 100;100 | 6;22 | 0.5 ;0.3 | - |
| Lockman Deep2, 7 | 7;15 | 500;500 | 18;11 | 0.3 ;0.4 | 166 |
| Marano DSF2 | 7;15 | 900;900 | 15.4;15.4 | 0.19 ;0.32 | 180 |
| A3708 | 7;15 | 31.3;31.3 | 42;42 | 0.052;0.21(u) | 4;20 |
| (80% compl.) | 0.080;0.293(u) | ||||
| Marano UDSR2 | 7;15 | 85;90 | 120;114 | 0.18 ;0.14 | -;142 |
| Marano UDSF2 | 7;15 | 89;90 | 114 | 0.08 ;0.14 | 115;137 |
| A22188 | 7;15 | 20.5;20.5 | 84;84 | 0.054;0.121(u) | 18;46 |
| (80% compl.) | 0.079;0.167(u) | ||||
| HDFN+FF2, 9 | 7;15 | 10;27 | 116;135 | 0.05 ;0.1 | 7;44 |
| HDFS2, 10 | 7;15 | 28;28 | 168;168 | 0.05 ;0.1 | 16;63 |
| A239011, 8 | 7;15 | 5.3;5.3 | 432;432 | 0.038;0.050(u) | 10;28 |
| (80% compl.) | 0.052;0.092(u) | ||||
| Lockman PGPQ12 | 7 | 9 | 744 | 0.034 | 15 |
| SSA1313 | 7 | 16 | 1264 | 0.006 | 65 |
| 7(80% compl.) | 0.016 | ||||
References: (1) Oliver et al. 2000, Rowan-Robinson et al. 2004, (2) Elbaz et al. 1999 and in prep., (3) Rodighiero et al. 2004, (4) Clements et al. 1999, (5) Flores et al. 1999, (6) Flores (private communication), (7) Fadda et al. 2004, (8) Metcalfe et al. 2003, (9) Aussel et al. 1999, Goldschmidt et al. 1997, (10) Oliver et al. 2002, (11) Altieri et al. 1999, (12) Taniguchi et al. 1997, (13) Sato et al. 2003, Sato et al. 2004. The depth of the deep surveys in the field of lensing clusters does not include the correction for lensing amplification, as indicated by the (u) |
|||||
Lensing appeared to be a very powerful tool to extend the detection of faint objects by a factor 2-3 (see Metcalfe et al. 2003). However studies such as the relative clustering of IR galaxies versus field galaxies are better done in larger homogeneous fields, where the role of cosmic variance can also be quantified. As we will see below, the environment of distant LIRGs seems to play a major role in triggering their star formation activity.
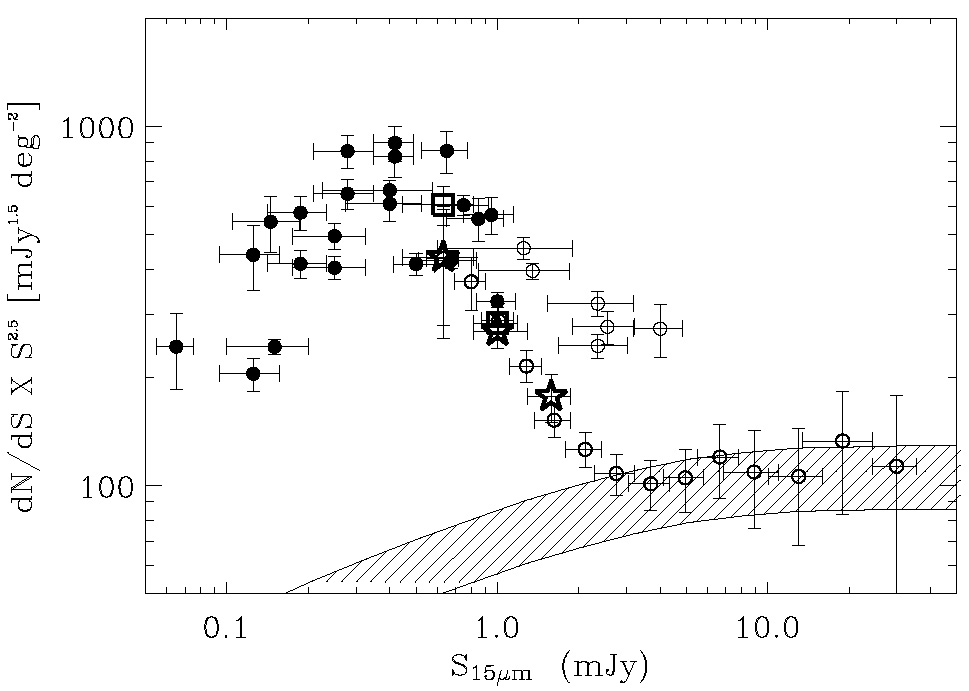 |
Figure 5. ISOCAM 15 µm
differential counts, with 68% error bars. The counts are normalized to
a Euclidean distribution of non-evolving sources, which would have a
slope of |
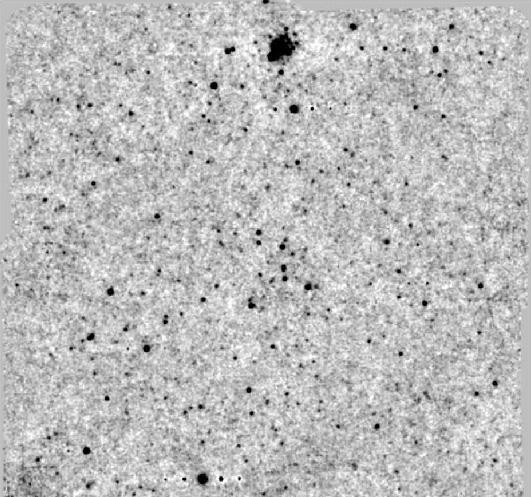 |
Figure 6. ISOCAM 15 µm image of the Marano FIRBACK Deep Survey (DSF) from the IGTES (Elbaz et al. 1999, and in prep.). Data reduction with PRETI. |
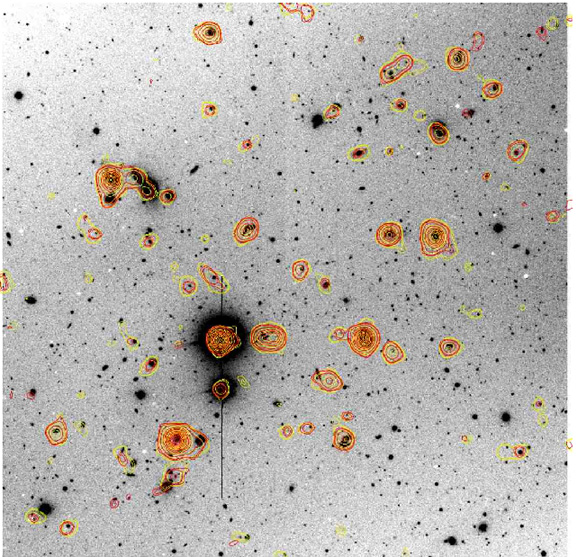 |
Figure 7. ISOCAM 15 µm contours overlayed on the VLT-FORS2 image (7' × 7', R-band) of the Marano FIRBACK Ultra Deep Survey (UDSF). The LARI (light contours, yellow on screen, grey on paper) and PRETI (dark contours, red on screen) detect the same objects. |
 = - 2.5 in
such a universe. This plot is an extension of the Fig. 2 from
= - 2.5 in
such a universe. This plot is an extension of the Fig. 2 from