


Since Thomson scattering of an anisotropic radiation field also generates
linear polarization, the CMB is predicted to be polarized at the roughly 5%
level
[33].
Polarization is a spin 2 field on the sky, and the algebra of the modes
in  -space is strongly
analogous to spin-orbit coupling in quantum
mechanics [34].
The linear polarization pattern can be decomposed in a number
of ways, with two quantities required for each pixel in a map, often
given as the Q and U Stokes parameters. However, the most
intuitive and physical decomposition is a geometrical one, splitting
the polarization
pattern into a part that comes from a divergence (often referred to as
the `E-mode') and a part with a curl (called the `B-mode')
[35].
More explicitly, the modes are defined in terms of second derivatives of
the polarization amplitude, with the Hessian for the E-modes having
principle
axes in the same sense as the polarization, while the B-mode pattern can
be thought of simply as a 45° rotation of the E-mode pattern.
Globally one sees that the E-modes have
(- 1)
parity (like the spherical harmonics), while the B-modes have
(- 1)+1
parity.
-space is strongly
analogous to spin-orbit coupling in quantum
mechanics [34].
The linear polarization pattern can be decomposed in a number
of ways, with two quantities required for each pixel in a map, often
given as the Q and U Stokes parameters. However, the most
intuitive and physical decomposition is a geometrical one, splitting
the polarization
pattern into a part that comes from a divergence (often referred to as
the `E-mode') and a part with a curl (called the `B-mode')
[35].
More explicitly, the modes are defined in terms of second derivatives of
the polarization amplitude, with the Hessian for the E-modes having
principle
axes in the same sense as the polarization, while the B-mode pattern can
be thought of simply as a 45° rotation of the E-mode pattern.
Globally one sees that the E-modes have
(- 1)
parity (like the spherical harmonics), while the B-modes have
(- 1)+1
parity.
The existence of this linear polarization allows for 6 different cross
power spectra to be determined from data that measure the full temperature
and polarization anisotropy information.
Parity considerations make 2 of these zero, and we are
left with 4 potential observables:
CTT,
CTE,
CEE, and
CBB.
Since scalar perturbations have no handedness,
the B-mode power spectrum can only be generated by vectors or tensors.
Hence, in the context of inflationary models, the determination of a
non-zero
B-mode signal is a way to measure the gravity wave contribution (and thus
potentially derived the energy scale of inflation), even if it
is rather weak. However, one must first eliminate the foreground
contributions and other systematic effects down to very low levels.
The oscillating photon-baryon fluid also results in a series of acoustic peaks in the polarization power spectra. The main `EE' power spectrum has peaks that are out of phase with those in the `TT' spectrum, because the polarization anisotropies are sourced by the fluid velocity. The correlated component of the polarization and temperature patterns comes from correlations between density and velocity perturbations on the last scattering surface, which can be both positive and negative. There is no polarization `Sachs-Wolfe' effect, and hence no large-angle plateau. However, scattering during a recent period of reionization can create a polarization `bump' at large angular scales.
The strongest upper limits on polarization are at the roughly 10 µK level from the POLAR [36] experiment at large angular scales and the PIQUE [37] and COMPASS [38] experiments at smaller scales. The first measurement of a polarization signal came in 2002 from the DASI experiment [39], which provided a convincing detection, confirming the general paradigm, but of low enough significance that it lends little constraint to models. As well as the E-mode signal, DASI also made a statistical detection of the TE correlation.
More recently the WMAP experiment was able to measure the TE cross-correlation power spectrum with high precision [40]. The results are shown in Fig. 3, along with some estimates from the DASI experiment. The detected shape of the cross-correlation power spectrum provides supporting evidence of the adiabatic nature of the perturbations, as well as directly constraining the thickness of the last scattering surface. Since the polarization anisotropies are generated in this scattering surface, the existence of correlations at angles above about a degree demonstrate that there were super-Hubble fluctuations at the recombination epoch.
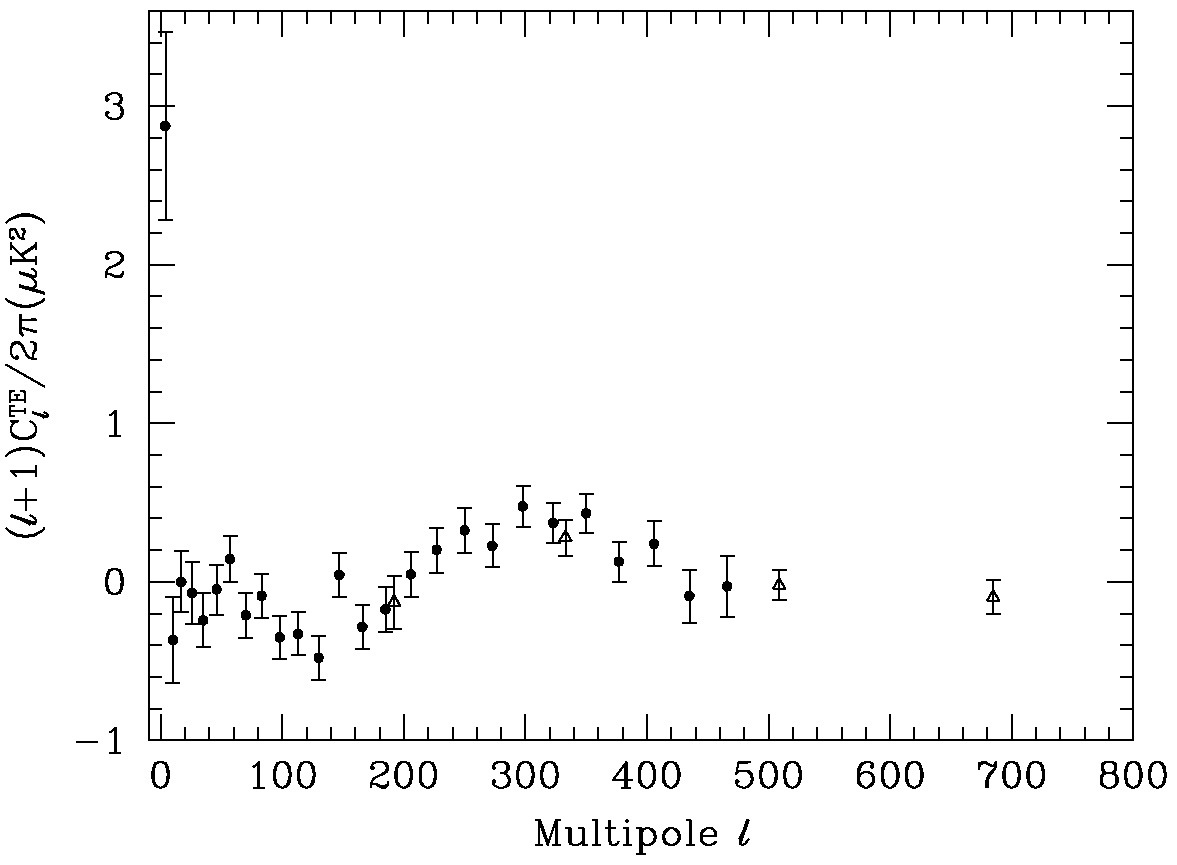 |
Figure 3. Cross power spectrum of the
temperature anisotropies and
E-mode polarization signal from WMAP (points), together with
some estimates from DASI (triangles) which extend to higher
|
Perhaps the most intriguing result from the polarization measurements
is at the largest
angular scales ( < 10),
where there is an excess signal compared to
that expected from the temperature power spectrum alone. This is precisely
the signal expected from an early period of reionization, arising from
Doppler shifts during the partial scattering at
z < zi.
It seems to indicate that the first stars (presumably the source of the
ionizing radiation) formed around z = 20.