


There has been a steady improvement in the quality of CMB data that has led to the development of the present-day cosmological model. Probably the most robust constraints currently available come from the combination of the WMAP first year data [5] with smaller scale results from the CBI [24] and ACBAR [25] experiments. We plot these power spectrum estimates in Fig. 2. Other recent experiments, such as ARCHEOPS [26], BOOMERANG [27], DASI [28], MAXIMA [29] and VSA [30] also give powerful constraints, which are quite consistent with what we describe below. There have been some comparisons among data-sets [31], which indicate very good agreement, both in maps and in derived power spectra (up to systematic uncertainties in the overall calibration for some experiments). This makes it clear that systematic effects are largely under control. However, a fully self-consistent joint analysis of all the current data sets has not been attempted, one of the reasons being that it requires a careful treatment of the overlapping sky coverage.
Fig. 2 shows band-powers from the first year
WMAP data
[32],
together with CBI and ACBAR data at higher
 .
The points are in very good agreement with a
`
.
The points are in very good agreement with a
` CDM' type model,
as described in the previous section,
with several of the peaks and troughs quite apparent.
For details of how these estimates were arrived at, the strength of
any correlations between band-powers and other information required to
properly interpret them, turn to the original papers
[5,
24,
25].
CDM' type model,
as described in the previous section,
with several of the peaks and troughs quite apparent.
For details of how these estimates were arrived at, the strength of
any correlations between band-powers and other information required to
properly interpret them, turn to the original papers
[5,
24,
25].
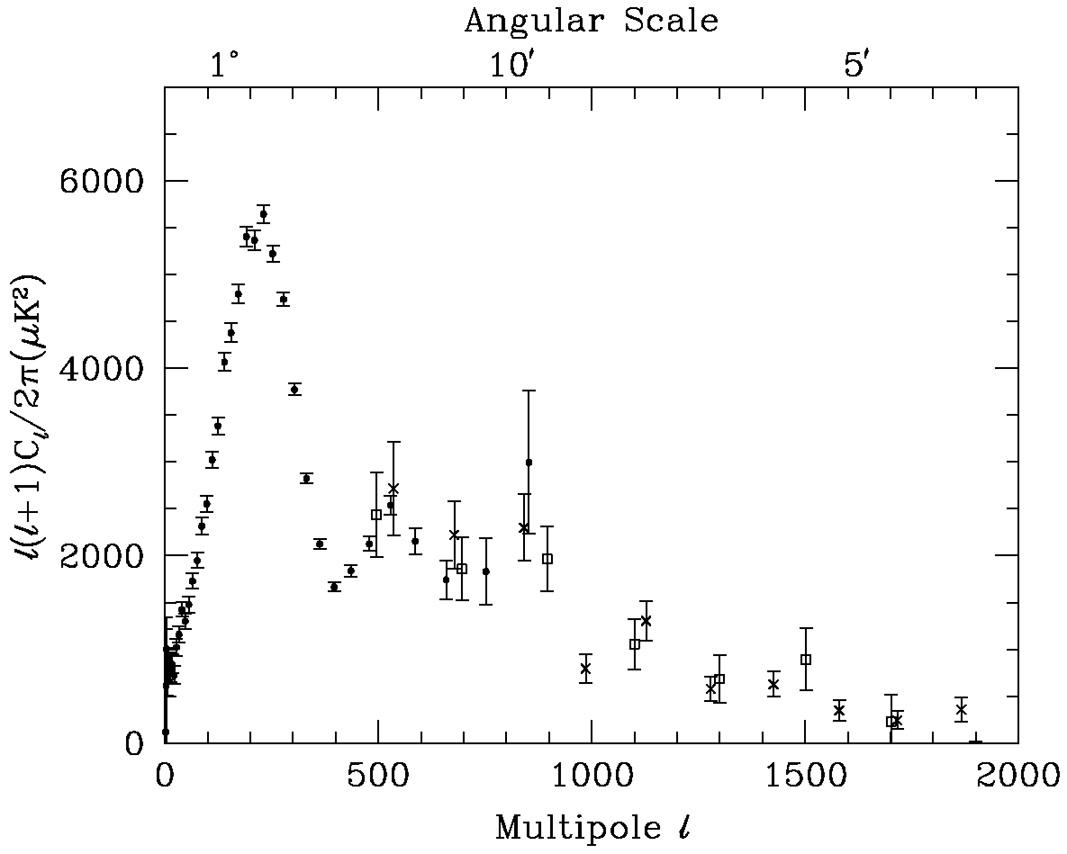 |
Figure 2. Band-power estimates from the
WMAP, CBI, and ACBAR experiments.
The WMAP data are the points, while squares are CBI and crosses
ACBAR. We have shown only CBI and ACBAR data relevant for
|