Copyright © 2006 by Annual Reviews. All rights reserved
| Annu. Rev. Astron. Astrophys. 2006. 44:
xxx-xxx Copyright © 2006 by Annual Reviews. All rights reserved |


Observations at high redshift are certainly the most direct way to look at the forming galaxies, and a great observational effort is currently being made in this direction. Yet, high-redshift galaxies are very faint, and only few of their global properties can now be measured. Nearby galaxies can instead be studied in far greater detail, and their fossil evidence can provide a view of galaxy formation and evolution that is fully complementary to that given by high-redshift observations. By fossil evidence one refers to those observables that are not related to ongoing, active star formation, and which are instead the result of the integrated past star formation history. At first studies attempted to estimate ages and metallicities of the dominant stellar populations on a galaxy-by-galaxy basis. But the tools used were still quite rudimentary, being based on largely incomplete libraries of stellar spectra and evolutionary sequences. Hence, through the 1980s progress was relatively slow, and opinions could widely diverge as to whether ellipticals were dominated by old stellar populations -as old as galactic globular clusters- or by intermediate age ones, several billion years younger than globulars (see e.g. O'Connell 1986, Renzini 1986) -with much of the diverging interpretations being a result of the age-metallicity degeneracy. From the beginning of the 1990s progress has been constantly accelerating, and much of this review concentrates on the developments that took place over the past 15 years.
3.1. Color-Magnitude Relation, Fundamental-Plane and Line-Indices
3.1.1 THE COLOR-MAGNITUDE AND
COLOR- RELATIONS That
elliptical galaxies follow a tight color-magnitude (C-M) relation was
first recognized by
Baum (1959),
and in a massive exploration
Visvanathan & Sandage
(1977)
and Sandage & Visvanathan
(1978a,
b)
established the universality of this relation with what continues to be
the culmination of ETG studies in the pre-CCD era. The C-M relation
looked the same in all nine studied clusters, and much the same in the
field as well, though with larger dispersion (at least in part
due to larger distance errors). The focus was on the possible use of
the C-M relation as a distance indicator; however, Sandage & Visvanathan
documented the tightness of the relation and noted that it
implies the stellar content of the galaxies to be very uniform. They also
estimated that both S0's and ellipticals had to be evolving passively
since at least ~ 1 Gyr ago. Figure 3 shows a
modern rendition for
the C-M plot for the Coma cluster galaxies, showing how tight it is,
as well as how closely both S0's and ellipticals follow the same relation,
as indeed Sandage & Visvanathan had anticipated.
RELATIONS That
elliptical galaxies follow a tight color-magnitude (C-M) relation was
first recognized by
Baum (1959),
and in a massive exploration
Visvanathan & Sandage
(1977)
and Sandage & Visvanathan
(1978a,
b)
established the universality of this relation with what continues to be
the culmination of ETG studies in the pre-CCD era. The C-M relation
looked the same in all nine studied clusters, and much the same in the
field as well, though with larger dispersion (at least in part
due to larger distance errors). The focus was on the possible use of
the C-M relation as a distance indicator; however, Sandage & Visvanathan
documented the tightness of the relation and noted that it
implies the stellar content of the galaxies to be very uniform. They also
estimated that both S0's and ellipticals had to be evolving passively
since at least ~ 1 Gyr ago. Figure 3 shows a
modern rendition for
the C-M plot for the Coma cluster galaxies, showing how tight it is,
as well as how closely both S0's and ellipticals follow the same relation,
as indeed Sandage & Visvanathan had anticipated.
 |
Figure 3. The (U - V) - MV color-magnitude relation for galaxies of the various morphological types that are spectroscopic members of the Coma cluster (Bower et al. 1999). |
In a major breakthrough in galaxy dating,
Bower, Lucey, & Ellis
(1992),
rather than trying to age-date galaxies one by one, were able
to set tight age constraints on all ETGs in Virgo and Coma at
once. Noting the remarkable homogeneity of ETGs in these clusters,
they estimated the intrinsic color scatter in the
color-
relation (see Figure 4) to be
 (U - V)
 0.04 mag, where
is
the central stellar velocity dispersion of these galaxies. They
further argued that - if due entirely to an age dispersion
t =
0.04 mag, where
is
the central stellar velocity dispersion of these galaxies. They
further argued that - if due entirely to an age dispersion
t =  (tH - tF), such color
scatter should be equal to the time scatter in formation epochs, times
(tH - tF), such color
scatter should be equal to the time scatter in formation epochs, times
 (U - V)
/ t, i.e.:
(U - V)
/ t, i.e.:
 |
(1) |
where tH is the age of the universe at z = 0,
and galaxies are assumed to form before a lookback time
tF. Bower and colleagues introduced the parameter
, such that
(tH - tF) is the
fraction of the available time during which galaxies actually form.
Thus, for =
1 galaxy formation is uniformly distributed between t ~ 0 and
t = tH - tF ,
whereas for
< 1 it is more and more synchronized, i.e., restricted to the fraction
of time
interval tH - tF.
Adopting (U -
V) /
t from the models of
Bruzual (1983),
they derived tH - tF < 2 Gyr for
= 1 and
tH - tF < 8 Gyr for
= 0.1,
corresponding respectively to formation redshifts zF
 2.8 and
1.1 for their adopted
cosmology (tH = 15 Gyr, qo =
0.5). For the concordance
cosmology, the same age constraints imply zF
3.3 and
0.8, respectively. A value
= 0.1 implies
an extreme synchronization, with all Virgo and Coma galaxies forming
their stars within less than 1 Gyr when the universe had half its
present age, which seems rather implausible. Bower and colleagues
concluded that ellipticals in clusters formed the bulk of their stars at
z 2,
and later additions should not provide more than ~ 10% of
their present luminosity. Making minimal use of stellar population
models, this approach provided for the first time a robust
demonstration that cluster ellipticals are made of very old stars,
with the bulk of them having formed at z
2.
2.8 and
1.1 for their adopted
cosmology (tH = 15 Gyr, qo =
0.5). For the concordance
cosmology, the same age constraints imply zF
3.3 and
0.8, respectively. A value
= 0.1 implies
an extreme synchronization, with all Virgo and Coma galaxies forming
their stars within less than 1 Gyr when the universe had half its
present age, which seems rather implausible. Bower and colleagues
concluded that ellipticals in clusters formed the bulk of their stars at
z 2,
and later additions should not provide more than ~ 10% of
their present luminosity. Making minimal use of stellar population
models, this approach provided for the first time a robust
demonstration that cluster ellipticals are made of very old stars,
with the bulk of them having formed at z
2.
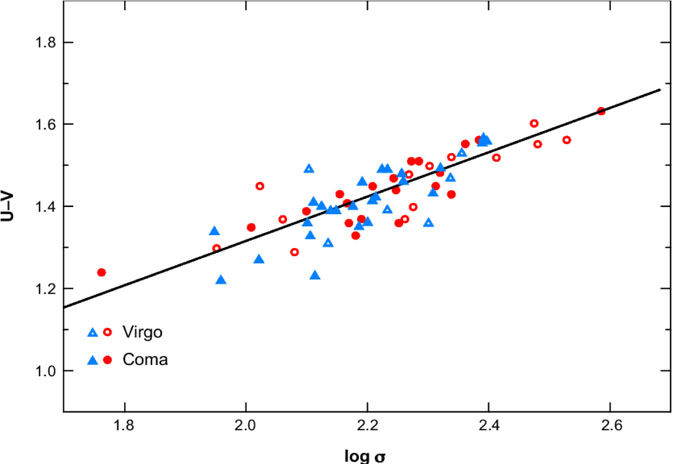 |
Figure 4. The relation between the
(U - V) color and the central velocity dispersion
( |
As the narrowness of the C-M and
color- relations sets
constraints on the ages of stellar populations in ETGs, their slope
can set useful constraints on the amount of merging that may have led
to the present-day galaxies. The reason is that merging without star
formation increases luminosity and
, but leaves colors
unchanged, thus broadening and flattening the relations. Moreover,
merging with star formation makes bluer galaxies, thus broadening and
flattening the relations even more. Then, from the constraints set by
the slope of the C-M relation, Bower, Kodama, & Terlevich (1998)
concluded that not only the bulk of stars in clusters must have formed
at high redshift, but also that they cannot have formed in mass units
much less than about half their present mass.
3.1.2 THE FUNDAMENTAL PLANE Three key observables of
elliptical galaxies, namely the effective radius Re,
the central velocity dispersion
, and the luminosity
L (or equivalently
the effective surface brightness Ie = L /
2 Re2) relate their
structural/dynamical status to their stellar content. Indeed, elliptical
galaxies are not randomly distributed within the 3D space
(Re, ,
Ie), but rather cluster close to a plane, thus known as
the fundamental plane (FP), with Re
Re2) relate their
structural/dynamical status to their stellar content. Indeed, elliptical
galaxies are not randomly distributed within the 3D space
(Re, ,
Ie), but rather cluster close to a plane, thus known as
the fundamental plane (FP), with Re
 a
Ieb
(Dressler et al. 1987;
Djorgovski & Davis
1987),
where the exponents
a and b depend on the specific band used for measuring the
luminosity. The projection of the FP over the (Re,
Ie) coordinate plane generates the Kormendy relation
(Kormendy 1977),
whereas a projection over the
(, L =
2
Re2 Ie) plane generates the
Faber-Jackson relation
(Faber & Jackson
1976).
At a time when testing
the
a
Ieb
(Dressler et al. 1987;
Djorgovski & Davis
1987),
where the exponents
a and b depend on the specific band used for measuring the
luminosity. The projection of the FP over the (Re,
Ie) coordinate plane generates the Kormendy relation
(Kormendy 1977),
whereas a projection over the
(, L =
2
Re2 Ie) plane generates the
Faber-Jackson relation
(Faber & Jackson
1976).
At a time when testing
the  M = 1
standard cosmology had high priority, the FP
was first used to estimate distances, in order to map deviations
from the local Hubble flow and construct the gravitational potential
on large scales. Its use to infer the properties of the stellar
content of galaxies, and set constraints on their formation, came
later. Yet, by relating the luminosity to the structural-dynamical
parameters of a galaxy, the FP offers a precious tool to gather
information on the ages and metallicities of galaxies, at low as well
as at high redshifts.
M = 1
standard cosmology had high priority, the FP
was first used to estimate distances, in order to map deviations
from the local Hubble flow and construct the gravitational potential
on large scales. Its use to infer the properties of the stellar
content of galaxies, and set constraints on their formation, came
later. Yet, by relating the luminosity to the structural-dynamical
parameters of a galaxy, the FP offers a precious tool to gather
information on the ages and metallicities of galaxies, at low as well
as at high redshifts.
The mere existence of a FP implies that ellipticals (a) are virialised systems, (b) have self-similar (homologous) structures, or their structures (e.g., the shape of the mass distribution) vary in a systematic fashion along the plane, and (c) contain stellar populations which must fulfill tight age and metallicity constraints. Here we concentrate on this latter aspect.
To better appreciate the physical implications of the FP,
Bender, Burnstein, &
Faber (1992)
introduced an orthogonal coordinate system
( 1,
2,
3),
in which each new variable is a linear combination
of log 2,
log Re and log Ie. The transformation
corresponds to a rotation of the coordinate system such that in the
(1,
3) projection
the FP is seen almost perfectly
edge-on. Moreover, if structural homology holds all along the plane,
then log M / L = 31/2
3 + const. If
is (almost) unaffected
by the dark matter distribution (as currently understood,
Rix et al. 1997),
then 3
provides a measure of the stellar M / L ratio, and
1
log (2
Re)
log M a measure of the stellar
mass. Bender and colleagues showed that in Virgo and Coma the FP is
remarkably "thin", with a
1- dispersion
perpendicular to the plane of only
(3)
1,
2,
3),
in which each new variable is a linear combination
of log 2,
log Re and log Ie. The transformation
corresponds to a rotation of the coordinate system such that in the
(1,
3) projection
the FP is seen almost perfectly
edge-on. Moreover, if structural homology holds all along the plane,
then log M / L = 31/2
3 + const. If
is (almost) unaffected
by the dark matter distribution (as currently understood,
Rix et al. 1997),
then 3
provides a measure of the stellar M / L ratio, and
1
log (2
Re)
log M a measure of the stellar
mass. Bender and colleagues showed that in Virgo and Coma the FP is
remarkably "thin", with a
1- dispersion
perpendicular to the plane of only
(3)
 0.05, corresponding to
a dispersion in the M / L ratio
10% at any
position along the plane. Moreover, the FP itself is "tilted", with the
M / L ratio
apparently increasing by a factor ~ 3 along the plane, while the
mass is increasing by a factor ~ 100. Note that the tilt does not
imply a departure from virialization, but rather a systematic trend of
the stellar content with galaxy mass, possibly coupled with a
systematic departure from structural homology (e.g.,
Bender, Burstein &
Faber 1992,
Ciotti 1997,
Busarello et al. 1997).
0.05, corresponding to
a dispersion in the M / L ratio
10% at any
position along the plane. Moreover, the FP itself is "tilted", with the
M / L ratio
apparently increasing by a factor ~ 3 along the plane, while the
mass is increasing by a factor ~ 100. Note that the tilt does not
imply a departure from virialization, but rather a systematic trend of
the stellar content with galaxy mass, possibly coupled with a
systematic departure from structural homology (e.g.,
Bender, Burstein &
Faber 1992,
Ciotti 1997,
Busarello et al. 1997).
The narrowness of the FP, coupled to the relatively large tilt
( 3
/ (3)
0.35/0.05 = 7) requires
some sort of fine tuning, which is perhaps the most intriguing property
of the FP
(Renzini & Ciotti
1993).
Although unable to identify one
specific origin for the FP tilt, Renzini & Ciotti argued that
the small scatter perpendicular to the FP implied a small age
dispersion ( 15%)
and high formation redshift, fully consistent with the
Bower, Lucey & Ellis
(1992)
argument based on the narrowness of the C-M and
color- relations.
3
/ (3)
0.35/0.05 = 7) requires
some sort of fine tuning, which is perhaps the most intriguing property
of the FP
(Renzini & Ciotti
1993).
Although unable to identify one
specific origin for the FP tilt, Renzini & Ciotti argued that
the small scatter perpendicular to the FP implied a small age
dispersion ( 15%)
and high formation redshift, fully consistent with the
Bower, Lucey & Ellis
(1992)
argument based on the narrowness of the C-M and
color- relations.
The remarkable properties of the FP for the Virgo and Coma clusters
were soon shown to be shared by all studied clusters in the local
universe.
Jørgensen, Franx,
& Kjærgaard (1996)
constructed the
FP for 230 ETGs in 10 clusters (including Coma), showing that the FP
tilt and scatter are just about the same in all local clusters, thus
strengthening the case for the high formation redshift of cluster ETGs
being universal. However,
Worthey, Trager, &
Faber (1995)
countered that the thinness of the FP, C-M, and
color- relations could
be preserved, even with a large age spread, provided age and
metallicity are anticorrelated (with old galaxies being metal poor
and young ones being metal rich). This is indeed what Worthey and colleagues
reported from their line-indices analysis (see below), indicating
a factor of ~ 6 for the range in age balanced by a factor ~ 10 in
metallicity (from solar to ~ 10 times solar). If so, then the FP
should be thicker in the near infrared, because the compensating
effect of metallicity would be much lower at longer wavelength, thus
unmasking the full effect of a large age spread
(Pahre, Djorgovski, &
De Carvalho 1995).
But Pahre and colleagues found the scatter of the FP
K-band to be the same as in the optical. In addition, its slope
implied a sizable variation of M / LK
M0.16 along the FP,
somewhat flatter than in the optical (M / LV
M0.23), still far from the M /
LK ~ const. predicted by
Worthey et al. (1995).
These conclusions were further documented and reinforced by Pahre, Djorgovski, & De Carvalho (1998), Scodeggio et al. (1998), Mobasher et al. (1999), and Pahre, De Carvalho, & Djorgovski (1998), who finally concluded that the origin of the FP tilt defies a simple explanation, but is likely the result of combined age and metallicity trends along the plane (with the most metal rich galaxies being actually the oldest), plus an unidentified systematic deviation from structural homology. Several possibilities for the homology breaking have been proposed and investigated, such as variation in stellar and/or dark matter content and/or distribution, anisotropy, and rotational support (e.g., Ciotti, Lanzoni, & Renzini 1996, Prugniel & Simien 1996, Ciotti & Lanzoni 1997). Recently, Trujillo, Burkert, & Bell (2004) argued that one fourth of the tilt is due to stellar population (i.e., a combination of metallicity and age), and three quarters of it to structural nonhomology in the distribution of the visible matter.
Of special interest is the comparison of the FP in clusters and in the field, because one expects all formation processes to be faster in high density peaks of the matter distribution. This was tested by Bernardi et al. (2003b, 2006) with a sample of ~ 40,000 SDSS morphology- and color-selected ETGs spanning a wide range of environmental conditions, from dense cluster cores to very low densities. Bernardi and colleagues found very small, but detectable differences in the FP zero point; the average surface brightness is ~ 0.08 mag brighter at the lowest density extreme compared to the opposite extreme. As the sample galaxies are distributed in redshift up to z ~ 0.3, they used the observed lookback time to empirically determine the time derivative of the surface brightness (hence in a model-independent fashion) and estimated that the 0.08 mag difference in surface brightness implies an age difference of ~ 1 Gyr, and therefore that galaxies in low density environments are ~ 1 Gyr younger compared to those in cluster cores.
3.1.3 THE LINE-STRENGTH DIAGNOSTICS Optical spectra of
ETGs present a number of absorption features whose strength must
depend on the distributions of stellar ages, metallicities and
abundance ratios, and therefore may give insight over such
distributions. To exploit this opportunity,
Burstein et al. (1984)
introduced a set of indices now known as the Lick/IDS system, and started
taking measurements for a number of galaxies. The most widely used indices
have been the Mg2 (or Mgb), <Fe>, and the
H indices,
measuring respectively the strength of MgH+MgI at
 5156-5197Å, the average of two FeI lines at
5248
and 5315Å, and of
H.
5156-5197Å, the average of two FeI lines at
5248
and 5315Å, and of
H.
A first important result was the discovery that theoretical
models based on solar abundance ratios adequately describe the
combinations of the values of the <Fe> and Mg2 indices in
low-luminosity ETGs, but fail for bright galaxies
(Peletier 1989,
Gorgas, Efstathiou, &
Aragón-Salamanca 1990,
Faber, Worthey, &
Gonzales 1992,
Worthey, Faber, &
Gonzales 1992,
Davies, Sadler, &
Peletier 1993,
Jørgensen 1997).
This implies either that
population synthesis models suffered from some inadequacy at high
metallicity (possibly due to incomplete stellar libraries), or that
massive ellipticals were genuinely enriched in magnesium relative to
iron, not unlike the halo stars of the Milky Way (e.g.,
Wheeler, Sneden, &
Truran 1989).
As for the Milky Way halo, such an
 -element
overabundance may signal a prompt enrichment in heavy elements from
Type II supernovae, with the short star-formation timescale having
prevented most Type Ia supernovae from contributing their iron while
star formation was still active. Yet, a star-formation timescale
decreasing with increasing mass was contrary to the expectations of
galactic wind/monolithic models (e.g.,
Arimoto & Yoshii
1987),
where the star formation timescale increases with the depth of the potential
well
(Faber, Worthey &
Gonzales 1992).
However, as noted by
Thomas (1999),
the contemporary semi-analytical models did not predict any
-element enhancement at
all, no matter whether in low- or high-mass ETGs. Indeed,
Thomas, Greggio, &
Bender (1999)
argued that the
-enhancement, if real,
was also at variance with a
scenario in which massive ellipticals form by merging spirals, and
required instead that star formation was completed in less than ~
1 Gyr. Therefore, assessing whether the
-enhancement was
real, and in that case measuring it, had potentially far reaching
implications for the formation of ETGs.
-element
overabundance may signal a prompt enrichment in heavy elements from
Type II supernovae, with the short star-formation timescale having
prevented most Type Ia supernovae from contributing their iron while
star formation was still active. Yet, a star-formation timescale
decreasing with increasing mass was contrary to the expectations of
galactic wind/monolithic models (e.g.,
Arimoto & Yoshii
1987),
where the star formation timescale increases with the depth of the potential
well
(Faber, Worthey &
Gonzales 1992).
However, as noted by
Thomas (1999),
the contemporary semi-analytical models did not predict any
-element enhancement at
all, no matter whether in low- or high-mass ETGs. Indeed,
Thomas, Greggio, &
Bender (1999)
argued that the
-enhancement, if real,
was also at variance with a
scenario in which massive ellipticals form by merging spirals, and
required instead that star formation was completed in less than ~
1 Gyr. Therefore, assessing whether the
-enhancement was
real, and in that case measuring it, had potentially far reaching
implications for the formation of ETGs.
Two limitations had to be overcome in order to reach a credible
interpretation of the <Fe> - Mgb plots: (a)
existing synthetic
models for the Lick/IDS indices were based on stellar libraries with
fixed [/Fe]
(Worthey 1994,
Buzzoni 1995),
and (b) an empirical verification of the reality of the
-enhancement was
lacking. In an attempt to overcome the first limitation,
Greggio (1997)
developed a scaling algorithm that allowed one to use existing
models with solar abundance ratios to estimate the Mg overabundance,
and she concluded that an enhancement up to [Mg/Fe]
+0.4 was
required for the nuclei of the most massive ellipticals (see also
Weiss, Peletier, &
Matteucci 1995).
She also concluded that a
closed-box model for chemical evolution failed to explain the very
high values of the Mg2 index of these galaxies. Indeed, the
numerous metal-poor stars predicted by the model would obliterate the
Mg2 feature, hence the nuclei of ellipticals had to lack
substantial numbers of stars more metal poor than ~
0.5Z .
Besides, very old ages
( 10 Gyr) and
-enhancement were
jointly required to account for galaxies with strong
Mg2. Eventually,
Thomas, Maraston, &
Bender (2003)
produced a full set of synthetic models with variable
[/Fe],
and Maraston et
al. (2003)
compared such models to the indices of ETGs
and of metal-rich globular clusters of the Galactic bulge, for which
the -enhancement has
been demonstarted on a star-by-star basis
by high resolution spectroscopy. The result is displayed in
Figure 5,
showing that indeed the new models indicate for the bulge globulars an
enhancement of [/Fe] ~
+0.3, in agreement with the stellar
spectroscopy results, and similar to that indicated for massive ETGs.
.
Besides, very old ages
( 10 Gyr) and
-enhancement were
jointly required to account for galaxies with strong
Mg2. Eventually,
Thomas, Maraston, &
Bender (2003)
produced a full set of synthetic models with variable
[/Fe],
and Maraston et
al. (2003)
compared such models to the indices of ETGs
and of metal-rich globular clusters of the Galactic bulge, for which
the -enhancement has
been demonstarted on a star-by-star basis
by high resolution spectroscopy. The result is displayed in
Figure 5,
showing that indeed the new models indicate for the bulge globulars an
enhancement of [/Fe] ~
+0.3, in agreement with the stellar
spectroscopy results, and similar to that indicated for massive ETGs.
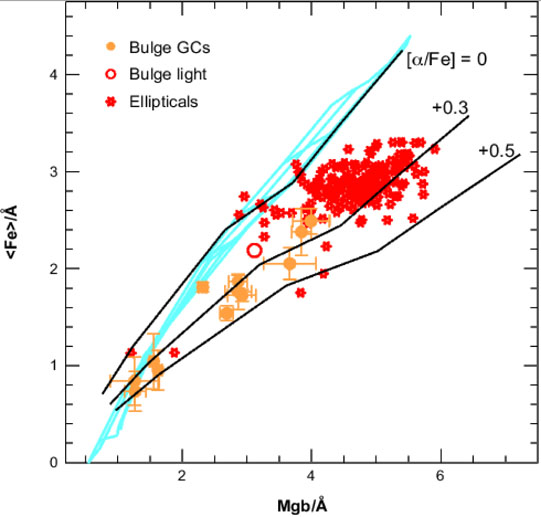 |
Figure 5. The <Fe> index versus the
Mgb index for a sample
of halo and bulge globular clusters, the bulge integrated light in
Baade's Window, and for elliptical galaxies from various
sources. Overimposed are synthetic model indices (from
Thomas, Maraston &
Bender 2003)
with solar metallicity ([Z/H] = 0), various
|
Other widely used diagnostic diagrams involved the
H
index along with <Fe> and Mg2 or Mgb. The
Balmer lines had been suggested as good age indicators (e.g.,
O'Connell 1980;
Dressler & Gunn
1983),
an expectation that was confirmed by the set of synthetic models
constructed by
Worthey (1994)
with the aim of breaking the
age-metallicity degeneracy that affects the broad-band colors of
galaxies. Worthey's models were applied by
Jørgensen (1999)
to a sample of 115 ETGs in the Coma cluster, and by
Trager et al. (2000)
to a sample of 40 ETGs biased toward low-density environments, augmented
by 22 ETGs in the Fornax cluster from
Kuntschner & Davies
(1998),
which showed systematically lower
H
indices. From these samples, and using the
H -
Mgb and
H -
<Fe> plots from Worthey's models,
both Jørgensen and Trager and colleagues concluded that ages ranged
from a few to almost 20 Gyr, but age and metallicity were
anticorrelated in such a way that the Mgb -
, C-M, and FP
relations may be kept very tight. Moreover, there was a tendency for
ETGs in the field to appear younger than those in clusters. Yet,
Trager and colleagues cautioned that
H is most
sensitive to even
low levels of recent star formation, and suggested that the bulk of
stars in ETGs may well be old, but a small "frosting" of younger
stars drives some galaxies toward areas in the
H -
Mgb and
H -
<Fe> plots with younger SSP ages. Finally, for the origin of the
-enhancement Trager and
colleagues favored a tight correlation of the IMF with
, in the sense of more
massive galaxies having
a flatter IMF, hence more Type II supernovae. However, with a flatter
IMF more massive galaxies would evolve faster in luminosity with
increasing redshift, compared to less massive galaxies, which appears
to be at variance with the observations (see below).
These conclusions had the merit of promoting further debates.
Maraston & Thomas
(2000)
argued that even a small old, metal-poor component
with a blue horizontal branch (like in galactic globulars) would
increase the H
index thus making galaxies look significantly
younger than they are. Even more embarrassing for the use of the
H -
Mgb and
H -
<Fe> plots is that a perverse circulation of the
errors automatically generates an apparent anticorrelation of age and
metallicity, even where it does not exist. For example, if
H is
overestimated by observational errors, then age is underestimated,
which in turn would reduce Mgb below the observed value unless the
younger age is balanced by an artificial increase of metallicity.
Trager and colleagues were fully aware of the problem, and concluded
that only data with very small errors could safely be used.
Kuntschner et al. (2001)
investigated the effect by means of Monte Carlo
simulations, and indeed showed that much of the apparent
age-metallicity anticorrelation is a mere result of the tight
correlation of their errors. They concluded that only a few outliers
among the 72 ETGs in their study are likely to have
few-billion-year-old luminosity-weighted ages, and these were
typically galaxies in the field or loose groups, whereas a uniformly
old age was derived for the vast majority of the studied
galaxies. Moreover, younger ages were more frequently indicated
for S0 galaxies (Kuntschner & Davies 1998). Nevertheless, in a
cluster with very tight C-M and FP relations such as Coma, a large age
spread at all magnitudes was found for a sample of 247 cluster members
(Poggianti et al. 2001),
and a sizable age-metallicity anticorrelation
was also found for a large sample of SDSS galaxies
(Bernardi et al. 2005).
As already alluded to, the main pitfall of the procedure is that the
various indices depend on all three population parameters one is
seeking to estimate: thus
H is
primarily sensitive to age, but also to [Fe/H] and
[/Fe], <Fe> is
sensitive to [Fe/H], but
also to age and [Mg/Fe]; etc. Thus, the resulting errors in age,
[Fe/H] and [Mg/Fe] are all tightly correlated, and one is left with
the suspicion that apparent correlations or anticorrelations may be an
artifact of the procedure, rather than reflecting the real properties
of galaxies. In an effort to circumvent these difficulties,
Thomas et al. (2005)
renounced to trust the results galaxy by galaxy. They
rather looked at patterns in the various index-index plots and
compared them to mock galaxy samples generated via Monte Carlo
simulations that fully incorporated the circulation of the errors.
The real result was not a set of ages and metallicities assigned to
individual galaxies, but rather age and metallicity trends with
velocity dispersion, mass and environments. Having analyzed a sample
of 124 ETGs in high- and low-density environments, Thomas and colleagues
reached the following conclusions: (a) all three parameters -age,
metallicity and
[/Fe]- correlate
strongly with , and, on
average, follow the relations:
 |
(2) |
 |
(3) |
 |
(4) |
where quantities in brackets/not in brackets refer to
low-density/high-density environments, respectively. (b) For
ETGs less massive than ~ 1010
M there
is evidence for the presence of intermediate-age stellar populations
with near-solar Mg/Fe. Instead, massive galaxies
( 1011
M) appear
dominated by old stellar populations, whereas at intermediate masses
the strength of
H requires
either some intermediate age component
or a blue horizontal branch (HB) contribution. (c) By and
large this picture applies to both cluster and field ETGs, with
cluster galaxies having experienced the bulk of their star formation
between z ~ 5 and 2, and this activity appears to have been
delayed by ~ 2 Gyr in the lowest density environments, i.e.,
between z ~ 2 and ~ 1. Figure 6
qualitatively summarizes this
scenario, in which the duration of star formation activity decreases
with increasing mass (as required by the [Mg/Fe] trend with
),
and extends to younger ages for decreasing mass (as forced by the
H -
relation). Note that
the smooth star-formation
histories in this figure should be regarded as probability
distributions, rather than as the actual history of individual
galaxies, where star formation may indeed take place in a series of
bursts. Qualitatively similar conclusions were reached by
Nelan et al. (2005),
from a study of ~ 4000 red-sequence galaxies in ~
90 clusters as part of the National Astronomical Observatory
Fundamental Plane Survey. Assuming the most massive galaxies
( ~ 400 km
s-1) to be 13 Gyr old, they derived an age of only
5.5 Gyr for less massive galaxies
( ~ 100 km
s-1). Note that
the age- scaling of
Thomas and colleagues would have given a much
older age (~ 9.5 Gyr). Taken together, Equations 2 and 3 imply a trend
of M / LV by a factor ~ 1.8 along the FP (from
= 100 to 350 km
s-1), thus accounting for almost two thirds of the FP tilt.
 |
Figure 6. The scenario proposed by
Thomas et al. (2005)
for the average star formation history of early-type galaxies of different
masses, from 5 × 10⁹
M |
As extensively discussed by
Thomas et al. (2005),
one residual concern
comes from the possibility that part of the
H strength
may be due to blue HB stars. Besides a blue HB contribution
by low-metallicity stars (especially in less massive galaxies), blue HB
stars may also be produced by old, metal-rich populations, and appear to be
responsible for the UV upturn in the spectrum of local ETGs
(Brown et al. 2000,
Greggio & Renzini
1990).
In the Thomas et al. sample, some S0 outliers
with strong H
and strong metal lines would require very young ages and
extremely high metallicity (up to ~ 10 times solar), and may better be
accounted for by an old, metal-rich population with a well-developed
blue HB.
The Mg2 -
relation has also been used to quantify
environmental differences in the stellar population content. The
cluster/field difference turns out to be small, with
Mg2 ~
0.007 mag, corresponding to ~ 1 Gyr difference - field galaxies
being younger - within a sample including ~ 900 ETGs
(Bernardi et al. 1998),
though no statistically significant environmental
dependence of both Mg2 and
H was
detected within a sample of ~ 9,000 ETGs from the SDSS
(Bernardi et al. 2003a).
Still from SDSS, coadding thousands of ETG spectra in various luminosity
and environment bins,
Eisenstein et al. (2003)
detect clear trends with
the environment thanks to the resulting exquisite S/N, but the
differences are very small, and Eisenstein and colleagues refrain from
interpreting them in terms of age/metallicity differences.
These results from the analysis of the Lick/IDS indices, including
large trends of age with ,
or even large age-metallicity
anticorrelations, have yet to be proven consistent with the FP and C-M
relations of the same galaxies as established specifically for the
studied clusters. Feeding the values of the indices, the synthetic
models return ages, metallicities, and
-enhancements. But
along with them the same models also give the colors and the stellar
M / L ratio of each galaxy in the various bands, hence
allowing one to
construct implied FP and C-M relations. It would be reassuring for
the soundness of the whole procedure if such relations were found to
be consistent with the observed ones. To our knowledge, this sanity
check has not been attempted yet. The mentioned trends and
correlations, if real, would also have profound implications for the
evolution of the FP and C-M relations with redshift, an opportunity
that will be exploited below.
3.2. Ellipticals Versus Spiral Bulges
The bulges of spiral galaxies are distinguished in "true bulges",
typically hosted by S0-Sb galaxies, and "pseudobulges" usually (but
not exclusively) in later-type galaxies
(Kormendy & Kennicutt
2004).
True (classical) bulges have long been known as similar to
ellipticals of comparable luminosity, in both structure, line
strengths and colors (e.g.,
Bender, Burnstein &
Faber 1992,
Jablonka, Martin, &
Arimoto 1996,
Renzini 1999,
and references therein).
Peletier et al. (1999)
were able to quantify this similarity using Hubble
Space Telescope (HST) WFPC2 (Wide Field Planetary Camera 2) and
NICMOS (Near Infrared Camera and Multiobject Spectrometer)
observations, and concluded that most (true) bulges in their sample of
20 spirals (including only 3 galaxies later than Sb) had optical and
optical-IR colors similar to those of Coma ellipticals. Hence, like in
Coma ellipticals their stellar populations formed at
z 3, even
if most of the galaxies in their sample are in small groups or in the
field. More recently,
Falcon-Barroso, Peletier,
& Balcells (2002)
measured the central velocity dispersion for the same sample observed
by Peletier and colleagues, and constructed the FP for these
bulges, showing that bulges in
this sample tightly follow the same FP relation as cluster
ellipticals, and therefore had to form their stars at nearly the same
epoch. The similarity of true bulges and ellipticals includes the
tendency of less massive objects to have experienced recent star
formation, as indicated by their location in the Mg2 -
diagram
in Figure 7. These
similarities between true (classical) bulges and ellipticals suggest a
similar origin, possibly in merger-driven starbursts at high
redshifts. Pseudobulges, instead, are more likely to have originated
via secular evolution of disks driven by bars and other deviations
from axial symmetry, as extensively discussed and documented by
Kormendy & Kennicutt
(2004).
Several of the objects in the Prugniel
and colleagues sample in Figure 7 are likely to
belong to the
pseudobulge group. From the Lick/IDS indices of a sample of bulges,
Thomas and Davies
(2006)
argue that the same scenario depicted in
Figure 6 for ETGs, applies to bulges as well, the main difference
being that bulges are on average less massive, hence on average
younger than ETGs.
 |
Figure 7. The Mg2 -
|
Looking near to us, HST and ground based photometry of individual stars
in the Galactic bulge have shown that they are older than at least 10
Gyr, with no detectable trace of an intermediate age component
(Ortolani et al. 1995,
Kuijken & Rich 2002,
Zoccali et al. 2003).
HST/NICMOS photometry of stars in the bulge of M31 has also
shown that their H-band luminosity function is virtually identical
to that of the Galactic bulge, and by inference should have
nearly identical ages
(Stephens et al. 2003).
These two bulges belong
to spirals in a rather small group, and yet appear to have formed
their stars at an epoch corresponding to z
2, not unlike most
ellipticals.
3.3. Summary of the Low-Redshift (Fossil) Evidence
The main observational constraints on the epoch of formation of the stellar populations of ETGs in the near universe can be summarized as follows:
 The C-M,
color- and FP relations
for ETGs in
clusters indicate that the bulk of stars in these galaxies formed at
z 2-3.
The C-M,
color- and FP relations
for ETGs in
clusters indicate that the bulk of stars in these galaxies formed at
z 2-3.
The same relations
for the field ETGs suggest that
star formation in low density environments was delayed by ~ 1-2 Gyr.
The more massive
galaxies appear to be enhanced in Mg
relative to iron, which indicates that the duration of the
star-formation phase decreases with increasing galaxy mass, having
been shorter than ~ 1 Gyr in the most massive galaxies.
Interpretations of
the Lick/IDS indices remains partly controversial,
with either an age-metallicity anticorrelation, or an increase of
both age and metallicity with increasing
.
These trends are qualitatively illustrated in
Figure 6, showing that the
higher the final mass of the system, the sooner star formation starts
and more promptly subsides, in an apparently "antihierarchical"
fashion. A trend in which the stellar population age and metallicity
are tightly correlated to the depth of the potential well (as measured
by ) argues for star
formation, metal enrichment, supernova
feedback, merging, and violent relaxation having been all concomitant
processes rather than having taken place sequentially.
The fossil evidence illustrated so far is in qualitative agreement
with complementary evidence at low as well as high redshift, now
relative to star-forming galaxies as opposed to quiescent ones. At low
z,
Gavazzi (1993) and
Gavazzi, Pierini, &
Boselli (1996)
showed that in local (disk) galaxies the specific star-formation rate
anticorrelates with galaxy mass, a trend that can well be extended
to include fully quiescent ellipticals. On this basis, Gavazzi and
collaborators emphasized that mass is the primary parameter
controlling the star-formation history of galaxies, with a sharp
transition at LH
2 × 10¹⁰
L
(corresponding to ~ 2 × 10¹⁰
M)
between late-type, star-forming galaxies and
mostly passive, early-type galaxies
(Scodeggio et al. 2002).
This transition mass has then been precisely located at ~ 3 ×
1010
M with
the thorough analysis of the SDSS database
(Kauffmann et al. 2003).
In parallel, high redshift observations have
shown that the near-IR luminosity (i.e., mass) of galaxies undergoing
rapid star formation has declined monotonically from z ~ 1 to the
present, a trend for which
Cowie et al. (1996)
coined the term down-sizing. This is becoming a new paradigm for galaxy
formation, as the anticorrelation of the specific star-formation rate
with mass is now recognized to persist well beyond z ~ 2 (e.g.,
Juneau et al. 2005,
Feulner et al. 2005).