


In order to quantify the clustering of galaxies, one must survey not
only galaxies in clusters but rather the entire galaxy density
distribution, from voids to superclusters. The most commonly used
quantitative measure of large scale structure is the galaxy two-point
correlation function,
 (r),
which traces the amplitude of galaxy clustering as a function of scale.
(r) is
defined as a measure of
the excess probability dP, above what is expected for an unclustered
random Poisson distribution, of finding a galaxy in a volume element
dV at a separation r from another galaxy,
(r),
which traces the amplitude of galaxy clustering as a function of scale.
(r) is
defined as a measure of
the excess probability dP, above what is expected for an unclustered
random Poisson distribution, of finding a galaxy in a volume element
dV at a separation r from another galaxy,
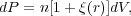 |
(1) |
where n is the mean number density of the galaxy sample in question
(Peebles 1980).
Measurements of
(r) are
generally performed in comoving
space, with r having units of h-1 Mpc.
The Fourier transform of the two-point correlation function is the
power spectrum, which is often used to describe density fluctuations
observed in the cosmic microwave background.
To measure
(r),
one counts pairs of galaxies as a function of
separation and divides by what is expected for an unclustered
distribution. To do this one must construct a "random catalog" that
has the identical three dimensional coverage as the data - including
the same sky coverage and smoothed redshift distribution - but is
populated with randomly-distribution points. The ratio of pairs of
galaxies observed in the data relative to pairs of points in the
random catalog is then used to estimate
(r).
Several different estimators for
(r)
have been proposed and tested. An early estimator that was widely used
is from
Davis & Peebles
(1983):
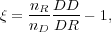 |
(2) |
where DD and DR are counts of pairs of galaxies (in bins of separation) in the data catalog and between the data and random catalogs, and nD and nr are the mean number densities of galaxies in the data and random catalogs. (Hamilton 1993) later introduced an estimator with smaller statistical errors,
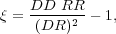 |
(3) |
where RR is the count of pairs of galaxies as a function of separation in the random catalog. The most commonly-used estimator is from Landy & Szalay (1993),
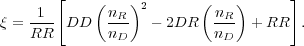 |
(4) |
This estimator has been shown to perform as well as the Hamilton estimator (Eqn. 3), and while it requires more computational time it is less sensitive to the size of the random catalog and handles edge corrections well, which can affect clustering measurements on large scales (Kerscher et al. 2000).
As can be seen from the form of the estimators given above, measuring
(r)
depends sensitively on having a random
catalog which accurately reflects the various spatial and redshift
selection affects in the data. These can include effects such as
edges of slitmasks or fiber plates, overlapping slitmasks or plates,
gaps between chips on the CCD, and changes in spatial sensitivity
within the detector (i.e., the effective radial dependence within X-ray
detectors). If one is measuring a full three-dimensional
correlation function (discussed below) then the random catalog must
also accurately include the redshift selection of the data. The random
catalog should also be large enough to not introduce Poisson error in
the estimator. This can be checked by ensuring that the RR pair counts
in the smallest bin are high enough such that Poisson errors are
subdominant.