


The mass of the H-exhausted core (hereafter core mass) at the end of core He-burning is the prime determinant of many important features of AGB evolution including luminosity and nucleosynthesis (e.g., Dominguez et al. 1999; Imbriani et al. 2001; Straniero et al. 2003b; Ekström et al. 2012; Halabi, El Eid, & Champagne 2012; Valle et al. 2013). When the star begins to ascend the AGB the core becomes increasingly electron degenerate and the star’s energy output is mostly provided by He burning, which proceeds through the material outside the C-O core as a thin He-burning shell is established. In intermediate-mass stars the H shell is extinguished, which allows the inward movement of the convective envelope and the SDU. It is at this time that middle and massive intermediate-mass stars ignite C in the C-O core, which results in an O-Ne core prior to the start of the thermally-pulsing phase. While the evolution of AGB stars with O-Ne cores (super-AGB stars) is qualitatively similar to C-O core AGB stars, we discuss these objects separately in Section 3.9.
The He shell thins as the star evolves up the AGB and eventually becomes thermally unstable. At the first thermal instability of the He shell (also known as a ‘thermal pulse’ or ‘shell flash’) the star is said to have entered the thermally-pulsing-AGB (or TP-AGB) phase. The evolution along the AGB prior to the first instability is referred to as the early AGB phase. The structure of an AGB star, illustrated in Figure 14, is qualitatively the same for all masses. We now focus on the thermally-pulsing AGB phase of evolution, which alters the surface abundances of the models in two distinct and important ways. The first is through the operation of the third dredge-up (TDU), which can occur periodically after each thermal pulse and is the mechanism for turning (single) stars into C-rich stars. The second mechanism is hot bottom burning.
 |
Figure 14. Schematic structure of an AGB star showing the electron-degenerate core surrounded by a helium-burning shell above the core, and a hydrogen-burning shell below the deep convective envelope. The burning shells are separated by an intershell region rich in helium (~ 75%) and carbon (~ 22%), with some oxygen and 22Ne. A super-AGB star has an O-Ne degenerate core otherwise the qualitative schematic structure remains the same. From Karakas, Lattanzio, & Pols (2002). Click on the image to run an animation of a pulse cycle. |
3.1. The thermally-pulsing asymptotic giant branch
Here we briefly review the main features of AGB evolution. Previous reviews include Iben (1991), Frost & Lattanzio (1996a), Wood (1997), Busso et al. (1999), and more recently Herwig (2005).
The thermally-pulsing AGB phase of evolution is characterised by relatively long periods of quiescent H-shell burning, known as the interpulse phase, interrupted by instabilities of the He-burning shell. Helium burning is ignited at the base of the He-rich intershell region (see Figure 14), which is composed of material exposed to previous He-shell flashes plus the ashes of H-shell burning which have accumulated over the previous interpulse phase. The He shell burns fiercely and can produce ≳ 108 L⊙ for a short time. Figure 15 shows the luminosities of the H and He shells, along with the surface luminosity for a 6 M⊙, Z = 0.02 model star during the first 10 thermal pulses. This figure illustrates the beginning of the TP-AGB phase where the strength of thermal pulses grows with time owing to the overall contraction of the H-exhausted core, which leads to hotter, more electron degenerate conditions in the burning shells. For the 6 M⊙ model shown in Figure 15 the luminosity produced by the He shell is already ≈ 106 L⊙ by the third thermal pulse, a figure that grows to over 4 × 10⁸ L⊙ by the final thermal pulses.
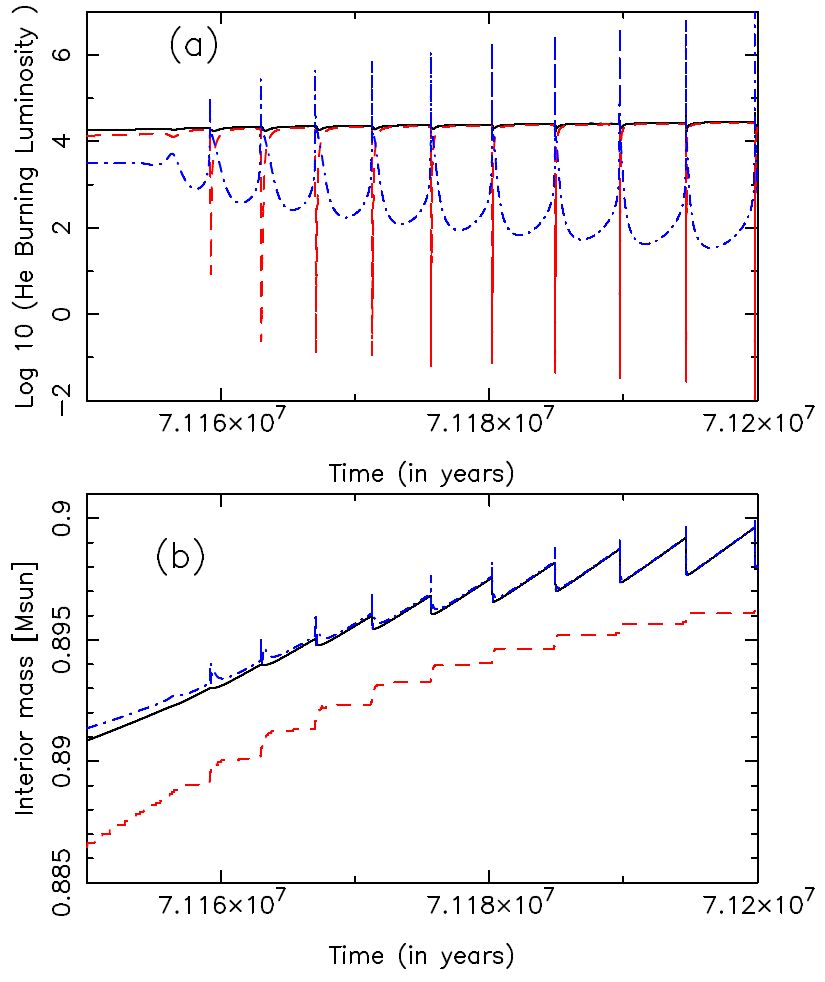 |
Figure 15. Evolution of the luminosities and core masses (in solar units) for a 6 M⊙, Z = 0.02 model during the start of the TP-AGB. Each panel shows the evolution during the first 10 thermal pulses. Panel (a) shows the surface (or radiated) luminosity (black solid line), H-burning shell luminosity (blue dot-dashed line), and He-burning shell luminosity (red dashed line). Panel (b) shows the masses of the H-exhausted core (black solid line), He-exhausted core (red dashed line), and the inner edge of the convective envelope (blue dot-dashed line). |
The energy produced by the flash powers a convective region which begins in the He-burning shell and extends almost all the way to the H-burning shell. This has the effect of homogenising abundances in this region. In Figure 16 we show the flash-driven convective regions in the intershell during the first five thermal pulses of the 6 M⊙, Z = 0.02 model. The teardrop-shaped green pockets represent flash-driven convection, which lasts for ≲ 102 years, depending on the core mass. Convection in the intershell retreats once the energy from the thermal pulse starts to die down, in what is referred to as the power down phase. During power down, the huge amount of energy produced by the thermal pulse does not reach the stellar surface but goes into expanding the star, which cools the material outwards of the He shell and shuts off the H shell. The power down phase is seen in the decrease of the H-shell luminosity in Figure 15. Note that while the H-shell luminosity drops by many orders of magnitude, the surface luminosity is only seen to dip by about 10% during the expansion stage.
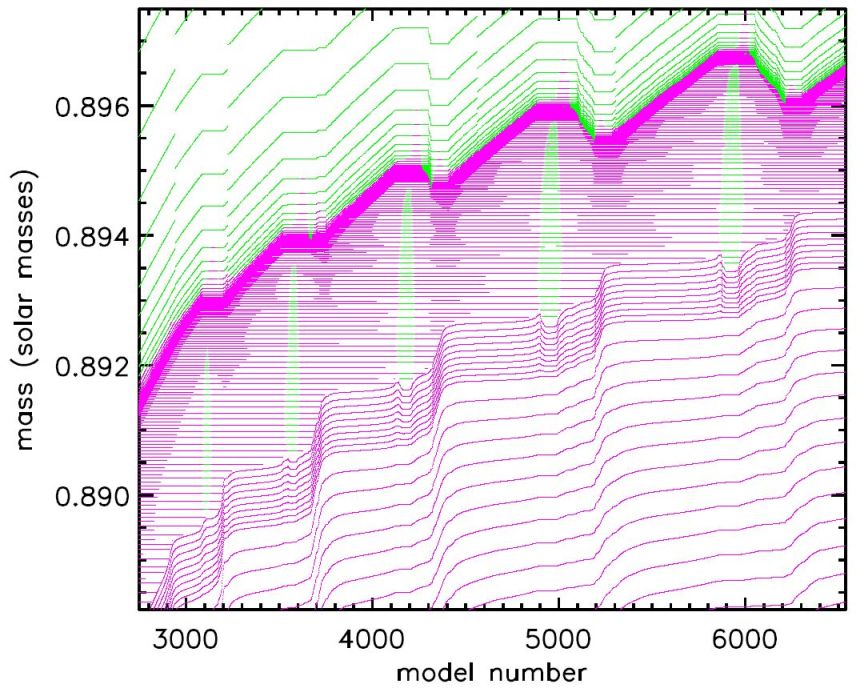 |
Figure 16. Convective regions for the 6 M⊙, Z = 0.02 model during the first five thermal pulses. The x-axis is nucleosynthesis time-step number, which is a proxy for time. For each model, along the x-axis, a green dot represents a convective mass shell and a magenta dot is a radiative shell. The dense magenta regions mark the H and He shells. The teardrop-shaped pockets correspond to the flash-driven convective region that extends over most of the intershell. These have the effect of homogenising the abundances within the intershell. For this model, the duration of the convective zones is about 25 years and the interpulse periods about ≈ 4000 years. |
The cooling of these inner layers leads to an increase in the stellar opacity, which allows the base of the outer convective envelope to move inwards in mass, interior to the erstwhile H-burning shell, and to regions previously mixed by intershell convection. Hence material from the interior, which has been exposed to He burning, is mixed into the envelope where it can be observed at the surface. This phase is known as third dredge-up and may occur after each thermal pulse.
In Figure 15 we show the evolution of the masses of the H-exhausted core, of the He-exhausted core, and of the inner edge of the convective envelope for the 6 M⊙, Z = 0.02 model during the first 10 thermal pulses. By the third thermal pulse we can see a small temporary decrease in the mass of the H-exhausted core, which is seen more clearly in Figure 16. The decrease is caused by the TDU, where the inner edge of the convective envelope penetrates into the top layers of the He intershell. This mixes H into a H-poor region, reducing the mass of the core while mixing the products of H and He nucleosynthesis into the envelope. Following the third dredge-up, the star contracts, the H-burning shell is re-ignited and the star enters a new interpulse phase. The cycle of interpulse-thermal pulse-power down-dredge-up may occur many times on the AGB, depending on the initial mass, composition, and mass-loss rate. For the 6 M⊙, Z = 0.02 model, this cycle occurs 42 times before the model experienced convergence problems of the type discussed by Lau et al. (2012) and calculations were terminated.
In summary, the AGB evolutionary cycle can be broken down into four distinct phases (Iben 1981):
It has been known for some time that intermediate-mass stars over about 5 M⊙ develop deep convective envelopes with very high temperatures at the base, allowing for nuclear burning and some energy generation (Scalo, Despain, & Ulrich 1975; Lattanzio 1992; Lattanzio et al. 1996). In fact, what happens is that the bottom of the convective envelope is situated near the top of the H-burning shell. The observational evidence that HBB is occurring in intermediate-mass AGB stars came from the lack of optically-bright C-rich stars in the Magellanic Clouds (Wood, Bessell, & Fox 1983). Many of these luminous, O-rich stars were later found to be rich in lithium (Smith & Lambert 1989, Smith & Lambert 1990a; Plez, Smith, & Lambert 1993). The first detailed calculations were made in the early 1990's by Blöcker & Schoenberner (1991) and Lattanzio (1992). Boothroyd, Sackmann, & Ahern (1993) found that HBB prevents the formation of a C-rich atmosphere by burning 12C into 14N thus providing a mechanism for the lack of bright C-stars in the Magellanic Clouds.
HBB can dramatically alter the surface composition. This is because the temperature in a thin region at the very base of the envelope, hereafter Tbce, can exceed 50 × 106K (50 MK), which is hot enough for activation of the CNO cycle and also the Ne-Na and Mg-Al chains (if the temperature is high enough). In the most massive, lowest metallicity AGB models, and super-AGB models, the temperature can exceed 100 MK (e.g., Karakas & Lattanzio 2007; Ventura et al. 2013; Doherty et al. 2014a).
The convective envelopes of AGB stars are well mixed, with a convective turnover time of about 1 year, which means that the whole envelope will be exposed to the hot region at least 1 000 times per interpulse period. In Figure 17 we show the evolution of the temperature at the base of the convective envelope for the 6 M⊙, Z = 0.02 model. The temperature reaches a peak of 82 MK at the 28th thermal pulse, before decreasing to below 20 MK, at which point HBB has been shut off. The decrease in temperature is caused by mass loss, which slowly erodes the envelope. The minimum envelope mass required to support HBB is about 1 M⊙, depending on the metallicity.
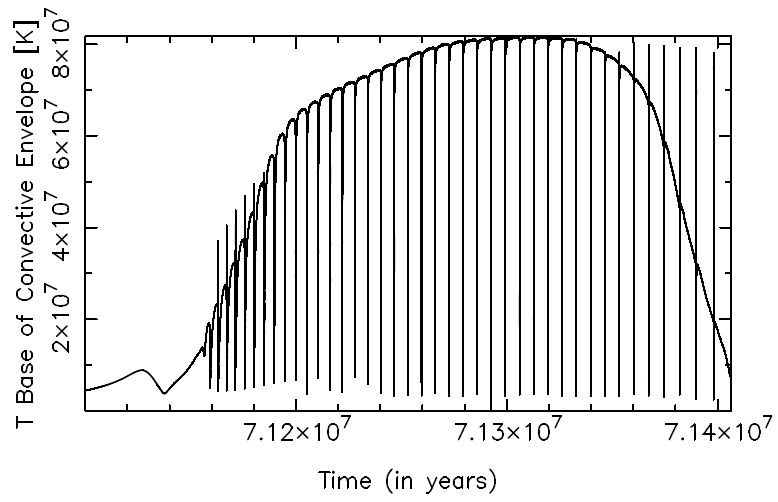 |
Figure 17. The evolution of the temperature at the base of the convective envelope in the 6 M⊙, Z = 0.02 model. |
3.2.1. Dredge-up, HBB and the brightest C stars
Third dredge-up can continue after the cessation of HBB, which allows the C abundance to increase instead of being burnt to N. The envelope mass is relatively small at this stage (≲ 1 M⊙), which means that dilution is also lower. It is possible the star will become C-rich at the very tip of the AGB where C/O ≥ 1 (Frost et al. 1998a), depending on the number of TDU episodes after the end of HBB and the O abundance in the envelope (noting that some O can also be destroyed by HBB). van Loon, Zijlstra, & Groenewegen (1999b) presented observational evidence that supports this scenario, finding a sample of very luminous, dust-obscured AGB stars in the Magellanic Clouds. The existence of very bright, C-rich AGB stars is also evidence that stars in this mass range experience TDU, at least down to the metallicities of the Magellanic Clouds.
3.2.2. The core-mass vs. luminosity relation
The surface luminosity will reach a maximum value during the interpulse and this is reached just before the onset of the next thermal pulse. Paczyński (1970) was the first to derive a linear relationship between the maximum surface luminosity during the quiescent interpulse phase and the H-exhausted core mass:
 |
(1) |
Paczyński's calculations infer that there is a maximum luminosity an AGB model can have of 52021 L⊙, determined by the maximum possible core mass of ≈ 1.4 M⊙. Subsequent calculations of intermediate-mass AGB stars revealed that hot bottom burning can violate the conditions of the core-mass luminosity relationship (Blöcker & Schoenberner 1991; Lattanzio 1992; Boothroyd & Sackmann 1992) and that an AGB model can have luminosities larger than predicted by Paczyński. The core-mass luminosity relationship on the AGB is also a key ingredient in a synthetic AGB model because it determines many fundamental features of AGB evolution including the growth of the H-exhausted core with time. The most accurate fits to the core-mass luminosity relationship are those that include a correction for the extra luminosity provided by HBB (Wagenhuber & Groenewegen 1998; Izzard et al. 2004, 2006). In Figure 18 we show the core-mass luminosity relationship for a selection of models at Z = 0.02. HBB occurs in models with M ≥ 4.5 M⊙ at Z = 0.02 and we can see for these models that the luminosity strongly increases with core mass before peaking and then declining. The decline is caused by mass loss, which reduces the temperature at the base of the convective envelope and in turn the luminosity from the CN cycle. In comparison, the lower mass AGB models do not experience HBB and show a reasonably linear core-mass luminosity relationship.
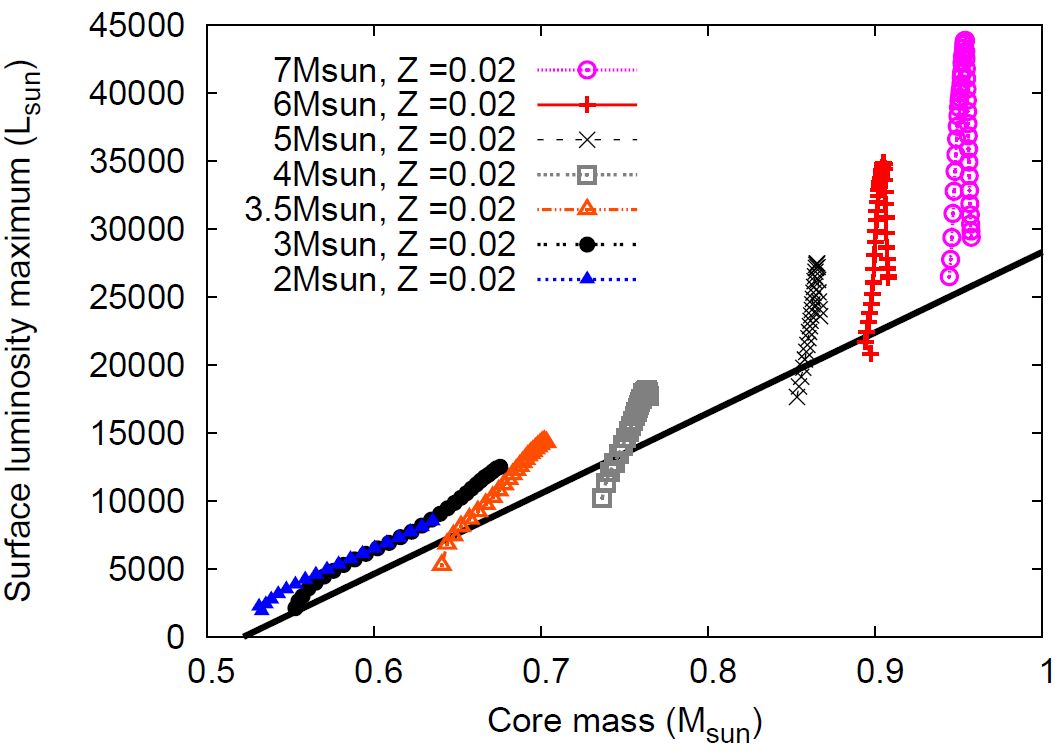 |
Figure 18. The core-mass versus luminosity relationship for a selection of Z = 0.02 models between 2 M⊙ and 7 M⊙. The models with M ≥ 4.5 M⊙ have hot bottom burning and deviate from the Paczyński relation, shown by the solid black line. |
The chemical enrichment at the surface of AGB stars is governed by the TDU mixing event that follows a thermal pulse. TDU is responsible for the largest changes to the surface composition of low-mass AGB stars and has important consequences for nucleosynthesis in intermediate-mass AGB stars as well owing to the production of primary C which is converted to primary N by HBB.
3.3.1. The dredge-up parameter
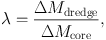
If there is dredge-up, then a fraction of the outer-most part of the H-exhausted core will be mixed into the envelope according to
 |
(2) |
where λ is the third dredge-up efficiency parameter, ΔMdredge is the mass mixed into the envelope, and ΔMcore is the amount by which the H-exhausted core increases over the previous interpulse phase; see Figure 19. From the above definition, when λ = 1, the core mass does not grow from pulse to pulse but remains constant. The value of λ depends on physical parameters such as the core mass and metallicity of the star. Exactly how λ depends on these quantities is unknown and reflects our lack of understanding about how convection operates in stellar interiors. Different stellar codes predict different behaviour, a point we will come back to in Section 4.1. Note that there is no a priori reason why λ cannot exceed unity.
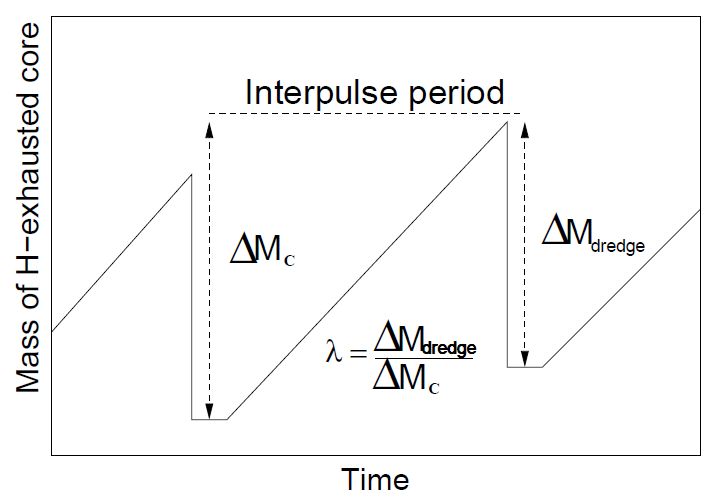 |
Figure 19. The definition of λ, shown schematically, where the x-axis represents time and the y-axis represents the mass of the H-exhausted core. |
So in summary, AGB nucleosynthesis depends on
Karakas et al. (2002) provided the first parameterisation of λ and Mminc as functions of the total mass, envelope mass, and metallicity (see also Straniero et al. 2003a). The general trend is that λ increases with increasing stellar mass, at a given Z. The parameter λ also increases with decreasing metallicity, at a given mass (e.g., Boothroyd & Sackmann 1988). Naively, this means that it should be easier to make C stars in lower metallicity or higher mass models. But there is also a second reason why C stars are more easily made at lower metallicity. Carbon production is a primary product of the triple-α process, and hence the C intershell abundance does not depend on the global metallicity, Z. In a low-metallicity star the amount of C added per pulse is roughly independent of metallicity, whereas the amount of O that must be overcome to produce C > O is lower. So fewer pulses are required to make a C star. This is true even for α-enhanced compositions where [O/Fe] ≈ +0.4. As we note, stars of lower metallicity are predicted to have deeper dredge-up which accelerates the effect further. Both mechanisms act to make C-stars easier to form at lower metallicities.
For intermediate-mass stars the situation is more complex. Even though the calculations of Karakas et al. (2002) predict larger values of λ, the effect of TDU is mitigated by the mass of the He intershell which is approximately a factor of 10 smaller in intermediate-mass AGB stars compared to AGB stars of lower mass. This means that even if λ ≈ 0.9, the amount of material added to the envelope per TDU event (λ × ΔMcore) is smaller by about an order of magnitude. Second, the mass of the convective envelope is large in intermediate-mass stars, which means that the material will be more diluted. Finally, HBB will act to prevent the formation of C-rich luminous AGB stars at the highest metallicities (e.g., Karakas et al. 2012), which is in agreement with observations of O-rich luminous AGB stars in our Galaxy (García-Hernández et al. 2006, 2013). So even though the conventional wisdom is that C-star production does not happen at intermediate-mass for the above reason, calculations of low-metallicity (Z ≤ 0.001) intermediate-mass stars suggest that C-star formation will occur before HBB ceases (Herwig 2004a, 2004b; Karakas 2010; Lugaro et al. 2012; Fishlock, Karakas, & Stancliffe 2014; Straniero, Cristallo, & Piersanti 2014). This is driven by the combination of primary C production plus the effect of HBB destroying some O.
It is important to know if the stellar models are providing an accurate description of the efficiency of mixing in AGB stars. For example, the models of Karakas et al. (2002) do not predict any TDU for models less than 2 M⊙ at Z = 0.02 and quite efficient TDU for models of intermediate mass. While it is notoriously difficult to determine the masses of stars in our Galaxy, observations suggest that the minimum initial stellar mass for C-star formation is ≈ 1.5 M⊙ (Wallerstein & Knapp 1998). The Large and Small Magellanic Clouds (LMC, SMC, respectively) are the closest satellite galaxies of our Milky Way and they both have thousands of known C stars (Frogel, Mould, & Blanco 1990; Groenewegen 2004). We know the distances to these two galaxies reasonably well, enabling us to construct C-star luminosity functions (CSLFs).
3.3.2. The carbon star luminosity function and other observational constraints
Is it possible to constrain the efficiency of third dredge-up by using the CSLF of the LMC and the SMC? That the stellar luminosity on the AGB is a nearly linear function of the H-exhausted core mass (e.g., Equation (1) and Figure 18) has stimulated the development of synthetic AGB evolution models, as a quick way of simulating populations of AGB stars. The main observational constraint which models must face is the CSLF for the Magellanic Clouds.
Synthetic AGB evolution calculations performed by Groenewegen & de Jong (1993) and Marigo, Bressan, & Chiosi (1996) treat λ as a constant free parameter, calibrated by comparison with the CSLF. Synthetic AGB calculations designed to reproduce the CSLF in the LMC and SMC require an average λ = 0.5 and λ = 0.65 respectively, and Mminc ≈ 0.58 M⊙ (Groenewegen & de Jong 1993; Marigo, Girardi, & Bressan 1999; Izzard et al. 2004; Marigo & Girardi 2007). The values for Mminc are lower than found in detailed models by e.g., Karakas et al. (2002) and shown in Figure 20 and the synthetic best fit values for λ are higher than those found for the low-mass AGB models that become C-rich (e.g., λ ≲ 0.4 in Figure 20) unless considerable overshoot is applied (e.g., Herwig 2000; Cristallo et al. 2009; Weiss & Ferguson 2009).
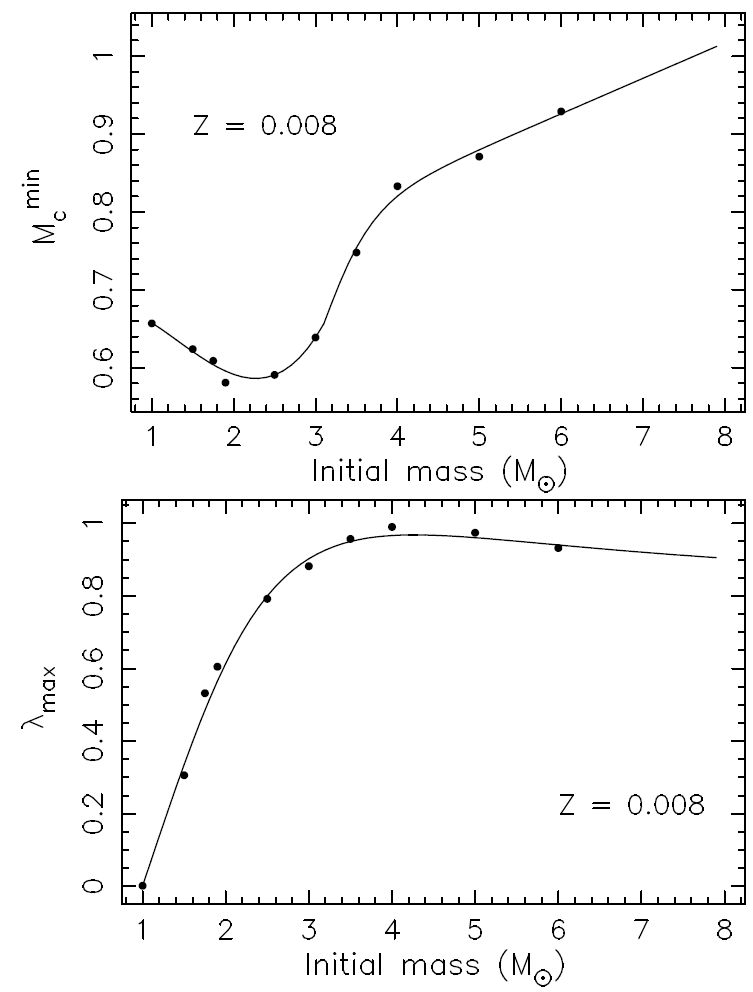 |
Figure 20. The minimum core mass for TDU (upper panel) and the maximum value of λ plotted against initial mass for the Z = 0.008 models from Karakas et al. (2002)) Only models with M ≥ 1.9 M⊙ become C-rich. Figure taken from Karakas et al. (2002). |
Stancliffe, Izzard, & Tout (2005) were able to reproduce the CSLF of the LMC by computing AGB models without convective overshoot using the Cambridge STARS code, which predicts deeper TDU at smaller core masses than Straniero et al. (1997) or Karakas et al. (2002). However, the CSLF in the SMC cannot be reproduced from detailed STARS models, indicating that the problem is not yet fully solved.
Star clusters are ideal sites to constrain the TDU in AGB stars as they contain stars of similar age and metallicity. Open clusters of solar metallicity in the Milky Way Galaxy can be used to study the TDU and the growth of the core using observations of white dwarf masses in comparison to theoretical models (Kalirai, Marigo, & Tremblay 2014). Star clusters in the Magellanic Clouds in particular prove very valuable as they span a wide range of age, which enables us to study the evolution of stars with masses around 1.5 to 5 M⊙ (e.g., Girardi et al. 1995; Girardi, Rubele, & Kerber 2009; Maceroni et al. 2002; Mucciarelli et al. 2006; Mackey et al. 2008; Milone et al. 2009).
The clusters NGC 1978 and NGC 1846 in the LMC have been the subject of much study owing to the availability of accurate estimates of AGB structural parameters such as pulsation masses, effective temperatures, and luminosity. Kamath et al. (2010) obtained (current day) pulsation masses for NGC 1978 (and the SMC cluster NGC 419), while Lebzelter & Wood (2007) obtained masses for the LMC cluster NGC 1846. Abundance studies have also been done (Ferraro et al. 2006; Mucciarelli et al. 2008; Lebzelter et al. 2008; Lederer et al. 2009), along with attempts to explain the observed C and O abundances for NGC 1978 and NGC 1846 using stellar evolution models (Lebzelter et al. 2008; Lederer et al. 2009).
Kamath et al. (2012) presented stellar models for AGB stars in NGC 1978, NGC 1846, and NGC 419 with the aim of constraining the TDU and mass loss on the AGB. The stellar evolution models were constrained to reflect the observed AGB pulsation mass, cluster metallicity, giant branch effective temperature, M-type to C-type transition luminosity, and the AGB-tip luminosity. A major finding from the study by Kamath et al. (2012) is that a large amount of convective overshoot (up to 3 pressure scale heights) is required at the base of the convective envelope during third dredge-up in order to get the correct O-rich to C-rich transition luminosity. Such large overshoot leads to λ values in the range 0.66 to 0.82 for the best fitting models. The first shell flashes with dredge-up occur for core masses of Mminc ≈ 0.56 − 0.58 M⊙. These values are much closer to the those values above suggested by synthetic AGB models to fit CSLFs and suggest that considerable convective overshoot occurs in low-mass AGB stars (see also studies by Herwig et al. 1997; Herwig 2000; Cristallo et al. 2009; Weiss & Ferguson 2009; Karakas et al. 2010).
It is important to note that this overshoot is measured from the formal Schwarzschild boundary. We know that this point is unstable to growth, but it does form a convenient position from which to measure the required amount of overshoot. Knowing the Schwarzschild boundary to be unstable has motivated some authors to implement an algorithm to try to search for a neutrally stable point (e.g., Lattanzio 1986). We note that this was not able to reproduce the observations in Kamath et al. (2012), and further mixing was required (although the required depth was not compared to the position of the neutral point).
The large spread in the amount of overshoot required to match the observations could be telling us that is not the best way to quantify the required deeper mixing. It may indicate a mass dependence, with lower masses requiring deeper mixing. It is good to remember that although we call this ‘overshoot’ because it is mixing beyond the Schwarzschild boundary, we are not identifying the cause of the deeper mixing as ‘convective overshoot’ in the usual sense, that is to say, the mixing caused by conservation of momentum in the moving gas, which causes it to cross the point of zero acceleration (the Schwarzschild boundary). Rather, we mean any process that mixes beyond the Schwarzschild border.
3.4.Nucleosynthesis during asymptotic giant branch evolution
Thermal pulses and dredge-up may occur many times during the TP-AGB phase. Each TDU episode mixes 12C from the He intershell into the envelope and this has the effect of slowly increasing the C/O ratio of the surface, illustrated in Figure 21 for models of 3 M⊙ and 6 M⊙ at Z = 0.02. Repeated TDU episodes can explain the transition from M-type (C/O ≈ 0.5, similar to the Sun) to C-type stars:
 |
(3) |
where SC-type stars have C/O of approximately unity, and C-type stars have C/O > 1 by definition (Wallerstein & Knapp 1998).
 |
Figure 21. The surface C/O ratio as a function of thermal pulse number for (a) a 3 M⊙, Z = 0.02 model AGB star, and (b) a 6 M⊙, Z = 0.02 model. The lower mass 3 M⊙ model does not experience HBB and becomes C-rich. In contrast, efficient HBB occurs for the 6 M⊙ model and the C/O ratio never reaches unity. The C/O ratio is given by number, and the initial abundance is the solar ratio at C/O = 0.506. |
Many C stars also have surface enrichments of heavy elements synthesised by the s-process (e.g., Zr, Y, Sr, Ba, Tc; Smith & Lambert 1986; Smith, Lambert, & McWilliam 1987; Smith & Lambert 1990b; Abia et al. 2002). The element technetium has no stable isotopes. The presence of this radioactive element in AGB star spectra is a particularly important indicator of ‘recent’ s-process nucleosynthesis and mixing (Merrill 1952; Little-Marenin & Little 1979; Smith & Lambert 1988; Vanture et al. 1991; Van Eck & Jorissen 1999; Lebzelter & Hron 2003; Vanture et al. 2007; Uttenthaler 2013). This is because the half-life of 99Tc (the isotope produced by the s-process) is 210 000 years, much shorter than the main-sequence lifetime of low-mass stars.
While C and s-process elements are the most obvious and easily verifiable examples of He-shell nucleosynthesis and TDU, there are other elements that are produced during thermal pulses including F, Na, 22Ne, and the neutron-rich Mg isotopes. Some of these isotopes are synthesised through a combination of H burning and He burning (e.g., Na). Hot bottom burning occurs in the most massive AGB stars and the main observable product of H burning is N which is produced by the CNO cycles, although other H-burning products may also be made (e.g., Na, Al etc.). The stellar yields of intermediate-mass AGB stars are strongly dependent on the complex interplay between HBB and TDU, as TDU is a supplier of primary C and 22Ne. Overall, the TP-AGB gives rise to a combination of H and He-processed material that is expelled by the star as its envelope is lost through stellar winds.
3.5. Nucleosynthesis via thermal pulses
A He-shell flash produces heat and mixing throughout the intershell region, which is composed mostly of the ashes of H-shell burning (≈ 98% 4He and 2% 14N). The two main He-burning reactions are:
During a thermal pulse some of the 4He in the shell is converted into 12C by partial He burning, leaving the composition of the well-mixed intershell approximately 70% - 75% 4He (by mass), 20% - 25% 12C and a few percent 16O (e.g., Figure 14). These approximate numbers reflect the intershell composition of canonical stellar evolution models without overshoot into the C-O core. The inclusion of overshoot into the core increases the intershell composition of 12C and 16O as discussed in Herwig (2000) and Section 3.5.3. There is a few percent (by mass) of 22Ne and trace amounts of other species including 17O, 23Na, 25Mg, 26Mg, and 19F. Sodium and 27Al are produced by H-burning during the preceding interpulse phase but are not destroyed by α-capture reactions during the thermal pulse. The exact composition of the He intershell after a thermal pulse depends on the mass and composition of the He shell before the pulse, the duration of the shell flash, as well as the peak temperature and density under which the burning takes place. These quantities in turn depend on the stellar mass and metallicity. The core contracts with time along the AGB which means that the thermodynamic conditions of the He shell become somewhat more extreme toward the end of the TP-AGB compared to the beginning (e.g., higher temperatures and densities resulting from a thinner, slightly more electron-degenerate shell).
3.5.1. The carbon isotopic ratio: 12C / 13C
The C isotope ratio 12C / 13C is a useful probe of AGB nucleosynthesis. Dredge-up increases the amount of 12C, so the ratio will increase from 12C / 13C ≈ 10 − 20 at the tip of the RGB to between 30 and > 100, depending on the number of TDU episodes and the initial mass. For the 3 M⊙ model star the predicted 12C / 13C ratio goes from ≈ 20 before the AGB to 119 at the tip of the AGB.
The 12C / 13C ratio has been observed in samples of C-rich AGB stars (Lambert et al. 1986; Abia & Isern 1997) as well as PNe (Palla et al. 2000; Rubin et al. 2004). The C isotopic composition of pre-solar mainstream silicon carbide (SiC) grains, which are assumed to form in the extended envelopes of C-rich AGB stars, show a well-defined distribution where 40 ≲ 12C / 13C ≲ 100, which matches the ratios observed in C(N) stars (e.g., Zinner 1998).
The 12C/ < sup>13C ratios are difficult to measure in PNe, with values spanning the range from ~ 4, the equilibrium value of the CN cycle, to upper limits of ≈ 38 (Palla et al. 2000, 2002; Rubin et al. 2004). These ratios are, in general, lower than measured in C-rich AGB stars and lower than found in pre-solar SiC grains and suggest efficient mixing of H-burning material with the observed nebula. Atacama large millimeter/sub-millimeter array (ALMA) observations of R Sculptoris however show the surprising result that the 12C / 13C ratio at the stellar photosphere is much lower, at 19, compared to the ratio obtained in the present-day mass loss (≳ 60; Vlemmings et al. 2013). These authors speculate that the lower C isotopic ratio is due to an embedded source of UV-radiation that is primarily photo-dissociating the 13CO molecule. This suggests that we need to be wary of the ratios obtained from PNe, where the star is a strong UV source illuminating the nebula.
The C and N abundances predicted by models do not match those observed in AGB stars (e.g., Lambert et al. 1986; Abia & Isern 1997; Milam, Woolf, & Ziurys 2009). In particular the observed 12C / 13C ratios are lower than predicted by standard AGB models (e.g., Forestini & Charbonnel 1997; Cristallo et al. 2009; Karakas 2010). For example, standard AGB models predict that by the time C/O ≥ 1 then 12C / 13C ≥ 80, which is already close to the upper limit observed in AGB stars or measured in SiC grains.
It is possible to match the observed N and C isotopic ratios by artificially lowering the 12C / 13C ratio at the tip of the RGB to values observed in RGB stars (Kahane et al. 2000; Lebzelter et al. 2008; Karakas et al. 2010; Kamath et al. 2012). By adopting a 12C / 13C ratio of 12 at the tip of the RGB, Kahane et al. (2000) found that they could match the observed 12C / 13C ratio of 45 for CW Leo. Similarly Karakas et al. (2010) were able to reproduce the observed 12C / 13C ratios for most of the Galactic C-rich stars. Whereas most C-rich AGB stars have 12C / 13C ratios between about 30 and 80, there is a small number with 12C / 13C ratios below 30 (e.g., Lambert et al. 1986; Abia & Isern 1997) that cannot be explained using the method above. That is, for a minimum 12C / 13C ratio of 10 at the tip of the RGB the minimum predicted value at the tip of the AGB is about 30 (depending on mass and composition). A value lower than this will require some form of extra mixing on the AGB.
3.5.2. Nitrogen isotopic ratios
Nitrogen isotopic measurements have been made for a small number of evolved stars. Measurements were made for the cool C star IRC + 10216, where the 14N / 15N ratio was estimated at > 4 400 (Guelin et al. 1995; Kahane et al. 2000). A tentative value of ≈ 150 was made for the J-type star Y CVn (Olson & Richter 1979), and lower limits (along with two detections) were obtained in eight C stars and two proto-PNe (Wannier et al. 1991). In this last study six of the lower limits (> 500) were significantly larger than the ratio found in giant molecular clouds (330). Note that the Wannier et al. (1991) 14N / 15N abundance ratio for Y CVn is 70, and for IRC + 10216 it is 5 300.
The most recent measurements by Hedrosa et al. (2013) were made for a selection of AGB stars of type C, SC, and J, where J-type C stars are defined mainly by their low 12C / 13C ratio and by the absence of s-process elements (Wallerstein & Knapp 1998). While almost all the data for C-type AGB stars show 14N / 15N ≳ 1 000, a few C-type AGB stars have N isotopic values close to solar. These are difficult to reconcile with current models because known mixing events either increase the 14N / 15N ratio by mixing with regions that have experienced H burning (e.g., FDU, SDU with typical values shown in Table 1 and extra mixing) or leave it largely unchanged because the material mixed to the surface is not primarily from H-burning regions (e.g., TDU). Furthermore, some of the SC type AGB stars, which are defined by having C/O ≈ 1, and presumably on an evolutionary path that takes them from M-type (O-rich) to C-type (C-rich) should have N isotopic ratios similar to C-type AGB stars. Instead, Hedrosa et al. (2013) find the SC-type AGB stars to be 15N-rich (with 14N / 15N ≲ 1 000), regardless of their C isotopic ratios. The reason for this deviation between SC and C-type AGB stars is unclear and difficult to understand from a theoretical viewpoint. Furthermore, the J-type stars, whose origin is already a mystery, show 14N / 15N ratios ≲ 1 000. The origin of the 15N enrichments is not clear but the only way that this isotope can be produced in low-mass AGB stars is via the CNO cycle reaction 18O(p,α)15N, which can take place in the He-burning shell provided there is a supply of protons (as discussed below in the context of F production).
3.5.3. The intershell oxygen abundance
The short duration of thermal pulses and the low C content of the region means that the 12C(α, γ)16O reaction produces negligible energy and does not produce much 16O. Canonical stellar evolution calculations of AGB stars find 16O intershell compositions of ≲ 2% (by mass, e.g., Boothroyd & Sackmann 1988; Karakas et al. 2010). Here by ‘canonical’ we are referring to model calculations with no convective overshoot of the flash-driven convective pocket into the C-O core. Herwig (2000) does include convective overshoot at the inner border of the flash driven convective zone and finds that some C and O from the C-O core is mixed into the intershell. This has the effect of increasing the C and O intershell abundances to up to ≈ 40% and 20%, respectively. The inclusion of such overshoot means that the oxygen stellar yields from low-mass AGB stars may become significant (Pignatari et al. 2013). We discuss this further in Section 3.5.7.
Fluorine is produced through a complex series of reactions as outlined in detail by Forestini et al. (1992), Mowlavi, Jorissen, & Arnould (1996), Mowlavi, Jorissen, & Arnould (1998) and more recently by Lugaro et al. (2004). The main reaction pathway involves the production of 15N which is burnt to 19F via 15N(α,γ)19F. The difficulty here is in making 15N which is destroyed by proton captures in the CNO cycles, which means that the composition of the He shell before a thermal pulse will be almost devoid of this isotope. If protons can be produced by secondary reactions (e.g., 14N(n,p)12C which itself requires free neutrons) then the CNO chain reaction 18O(p,α)15N can make 15N. Because F is produced in the He intershell the composition in the envelope correlates with the abundance of C and s-process elements, as shown in Figure 22 (for C).
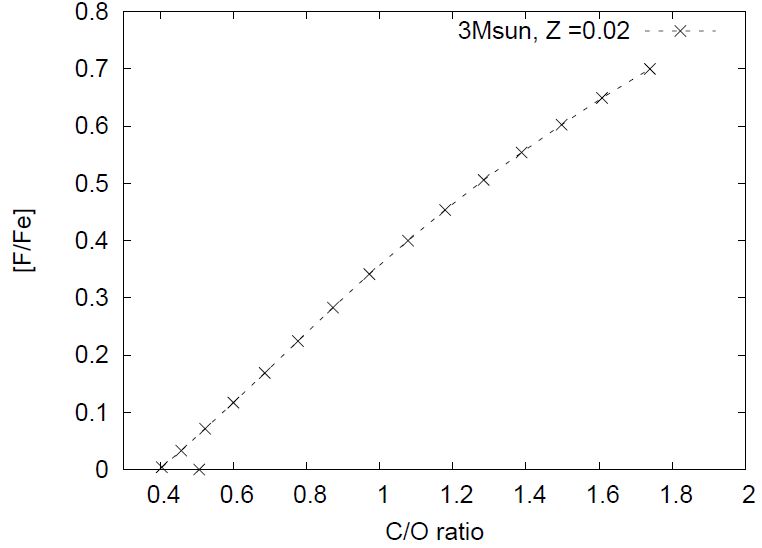 |
Figure 22. The C/O ratio versus the [F/Fe] abundance at the surface of a 3 M⊙, Z = 0.02 AGB model. Other products of helium nucleosynthesis include 22Ne, and the final 22Ne/Ne ratio in this model increases to ≈ 0.4 from 0.068 initially. The total Ne abundance increases from log ε(Ne) = log 10(Ne/H) + 12 = 8.11 at the main sequence to 8.33 at the tip of the AGB where He/H = 0.119, C/O = 1.74 (shown in Figure 21), 12C / 13C = 119, 14N / 15N ≈ 2 500, and N/O = 0.40. |
Fluorine has been observed in AGB stars in our Galaxy and in Local Group Galaxies (Jorissen, Smith, & Lambert 1992; Lebzelter et al. 2008; Abia et al. 2009, 2010), PG 1159 post-AGB stars and PNe (Werner, Rauch, & Kruk 2005; Otsuka et al. 2008), and in barium stars (Alves-Brito et al. 2011), which are hypothesised to have received their C and Ba through mass transfer from a previous AGB companion.
The observations of Jorissen et al. (1992) revealed F abundances that were much higher than model predictions (Forestini et al. 1992; Lugaro et al. 2004; Karakas et al. 2008), especially for the SC-type AGB stars with C/O ≈ 1. A re-analysis of the F abundance in three Galactic AGB stars (TX Psc, AQ Sgr, and R Scl) by Abia et al. (2010) revealed the cause of the discrepancy to be the model atmospheres used in the original analysis, which did not properly take into account blending with C-bearing molecules. The new abundances are up to 0.8 dex lower, bringing the models into agreement with the observations. Observations of F in the C-rich AGB stars in the LMC cluster NGC 1846 however show a discrepancy with models (Lebzelter et al. 2008; Kamath et al. 2012), with the observed F abundance increasing more strongly with the C/O ratio than in the theoretical model. While observations of F in extra-galactic C stars show most of the stars to be F rich, the models over predict the amount of C relative to the observations; see Abia et al. (2011), who also suggested possible solutions including the hypothesis that most of the C might be trapped in dust grains.
3.5.5. Other species in the intershell
There is a wealth of other He-burning products produced as a consequence of thermal pulses including 19F, 22Ne, 23Na, 25Mg, 26Mg, and 27Al (Forestini & Charbonnel 1997; Mowlavi 1999b; Herwig 2000; Karakas & Lattanzio 2003a, 2003b; Lugaro et al. 2004; Cristallo et al. 2009; Karakas 2010; Cristallo et al. 2011). The isotope 22Ne is produced by the reaction 14N(α, γ)18F, where 18F β-decays to 18O allowing for the reaction 18O(α, γ)22Ne. The composition of 22Ne in the intershell is fairly high, at ≈ 2%. This is because the abundant 14N is completely converted into 22Ne during a thermal pulse. The 22Ne abundance is predicted to increase by almost an order of magnitude (~ 1 dex) in some AGB models (Karakas & Lattanzio 2003a). If the 22Ne abundance exceeds or is equal to the 20Ne abundance we should expect an observable enhancement in the elemental Ne composition. The intershell is also enriched in 23Na and 27Al. Na and 27Al are not He-burning products but are synthesised in the H shell during the previous interpulse. Unlike other H-burning products (e.g., 14N) these are left unburnt by the subsequent TP and mixed into the envelope by the next TDU episode.
3.5.6. Heavy magnesium isotopes
If the peak temperature of the thermal pulse exceeds 300 × 106 K, the neutron-rich Mg isotopes, 25Mg and 26Mg, can be synthesised by the 22Ne(α, n)25Mg and 22Ne(α, γ)26Mg reactions. These two 22Ne + α reactions have similar although uncertain rates at He-shell burning temperatures (Angulo et al. 1999; Karakas et al. 2006b; Longland, Iliadis, & Karakas 2012; Wiescher, Käppeler, & Langanke 2012). Owing to the relatively high temperatures required for these two reactions, they are predicted to occur efficiently in intermediate-mass AGB stars with masses greater than about 4 M⊙ depending on metallicity (Karakas & Lattanzio 2003b; Karakas et al. 2006b). The He intershell of lower mass AGB stars will only reach 300 MK during the last few thermal pulses (if at all). This means that the 22Ne(α, n)25Mg reaction is only marginally activated near the end of the AGB. The 22Ne(α, n)25Mg is particularly important because it produces free neutrons that can be captured by iron-peak elements enabling the s-process (Iben 1975; Wiescher et al. 2012). It is the dominant neutron-producing reaction in the He and C-burning regions of massive stars (The, El Eid, & Meyer 2007; Heil et al. 2008; Pignatari et al. 2010) and the dominant neutron source in intermediate-mass AGB stars (García-Hernández et al. 2006; Karakas et al. 2012). We will come back to this reaction when we discuss s-process nucleosynthesis in Section 3.7.
3.5.7. Planetary nebulae and post-AGB stars
Comparisons to observations of AGB stars and their progeny can be made for many of the species considered so far. Comparisons with Ne measured in PG 1159 stars reveal good agreement with 22Ne intershell abundances found in standard models (Werner & Wolff 1999). Neon abundances can be reliably measured in PNe so observations of these objects can be used as a probe of AGB nucleosynthesis. A correlation is observed to exist between the Ne/H and O/H abundance in PNe in the Galaxy, LMC, SMC and M31, within a small but probably real spread (Kaler 1978; Aller & Czyzak 1983; Henry 1989; Dopita et al. 1997; Stasińska, Richer, & McCall 1998; Leisy & Dennefeld 2006; Stanghellini et al. 2000, 2006; Bernard-Salas et al. 2008). While AGB models can produce considerable 22Ne which results in an overall increase in the elemental Ne abundance, this is predicted to occur in only a narrow mass range and the overall agreement with the observations is good (Marigo 2001; Karakas & Lattanzio 2003a; Henry et al. 2012; Shingles & Karakas 2013).
We can compare AGB predictions to the surface abundance observations of PG 1159-type post-AGB stars, which are thought to be in transition from central stars of PNe to white dwarfs (Werner et al. 2009). These H-deficient objects are quite rare, with only about two dozen known, and their atmospheres are mostly composed of He, C, and O (Werner & Rauch 1994; Werner & Herwig 2006; Jahn et al. 2007; Werner et al. 2009). Spectroscopic observations of the PG 1159 central stars reveal O mass fractions as high as 20% (e.g., Werner & Herwig 2006) clearly at odds with standard stellar models. Spectroscopic observations of Ne and F reveal abundances consistent with the models (Werner & Wolff 1999; Werner et al. 2005). The diffusive convective overshooting models of Herwig (2000) have intershell abundances that are consistent with the abundance patterns observed in PG 1159 central stars (see also, e.g., Miller Bertolami & Althaus 2006; Althaus et al. 2009), as discussed in Section 3.5.3. The degenerate thermal pulses found by Frost, Lattanzio, & Wood (1998b) may have a similar effect. In this case, deep third dredge-up following the degenerate pulse can mix material from the C-O core into the envelope, enhancing the envelope in 16O.
There is other observational evidence for increased O intershell content. The high [O/Fe] abundances measured in post-AGB stars in the Galaxy and Magellanic Clouds are difficult to reconcile with standard O intershell abundances of 2% or less (Van Winckel & Reyniers 2000; De Smedt et al. 2012). In particular the low-metallicity SMC post-AGB star J004441.04-732136.4 has a [Fe/H] ≈ -1.3, a low C/O ratio of 1.9, combined with a high [O/Fe] ≈ 1.10. These numbers cannot be explained by canonical stellar evolution models as discussed in De Smedt et al. (2012), which produce very high C/O ratios ≈ 20 at this low metallicity. One way to reconcile the models and observations would be through changing the O intershell abundances. Further evidence for non-standard intershell compositions comes from the O isotope ratios measured in evolved red giant stars (see discussion in Karakas et al. 2010), which show an increase in the 16O / 17O and 16O / 18O ratios with evolution along the AGB. The C/O and 12C / 13C ratios measured in the C-rich AGB stars in NGC 1978 are also difficult to reconcile with standard models and require higher O intershell compositions of 15% (Kamath et al. 2012). One source of uncertainty in these conclusions is the large error bars present in the O isotopic data measured by Harris, Lambert, and collaborators (Harris et al. 1983; Harris & Lambert 1984; Harris, Lambert, & Smith 1985a, 1985b; Harris et al. 1987; Smith & Lambert 1990b).
3.6. Nucleosynthesis from hot bottom burning
H-burning occurs primarily via the CNO cycles but also via the Ne-Na and Mg-Al chains if the temperature is high enough. In this section we summarise the main H-burning reactions and their products and review the results of HBB that are predicted to be observed at the surface of intermediate-mass AGB stars.
In Section 2.2.1 we discussed the CNO cycle in the context of FDU abundance changes. During HBB the temperatures at the base of the convective envelope are higher than in the H shell during the first ascent of the giant branch, reaching Tbce ≳ 100 MK in the lowest metallicity, massive AGB stars (with C-O and O-Ne cores, e.g., Karakas & Lattanzio 2007; Ventura & D’Antona 2009; Siess 2010; Doherty et al. 2014a). While these high temperatures are normally associated with He burning, the density at the base of the envelope is only a few grams cm-3, much lower than in the H shell and other H-burning regions (e.g., the central density in the Sun is ρ⊙ ≈ 160 gram cm-3; at the base of the H shell the typical densities during the interpulse are ≈ 30 − 40 gram cm-3 in an intermediate-mass AGB star). This means that higher temperatures are required for nucleosynthesis and energy production than in a typical H-burning environment and also partly explains why HBB is more efficient at lower metallicities where the stars are more compact.
During HBB the CN cycle, which results in an increase in the abundance of 13C and 14N from the destruction of other CNO species, comes into equilibrium quickly. The isotopes 12C and 15N are first destroyed by the CN cycle and later the oxygen isotopes 16O and 18O are also destroyed to produce 14N. The abundance of 17O can be enhanced by the CNO bi-cycle, depending on the uncertain rates of the 17O + p branching reactions whereas 19F is destroyed (e.g., Angulo et al. 1999; Arnould et al. 1999; Iliadis et al. 2010).
In Figure 21(b) we show the evolution of the C/O ratio at the surface of a 6 M⊙, Z = 0.02 model with HBB. The C/O ratio stays below unity for the entire TP-AGB phase and only starts to increase from C/O ≲ 0.1 during the final eight thermal pulses, which is when HBB starts to shut down owing to the erosion of the envelope by mass loss. By the final calculated thermal pulse the C/O ratio is just above the starting (solar) value of 0.5. The evolution of the 12C / 13C ratio and elemental N abundance in Figure 23 also demonstrates efficient activation of the CNO cycles. The 12C / 13C ratio behaves similarly to the C/O ratio and stays close to the equilibrium value of ≈ 3 for much of the TP-AGB. The N abundance is seen to increase by almost an order of magnitude, more than would be allowed if the initial C + N + O was consumed to produce 14N. This is because primary 12C is mixed from the intershell by the TDU into the envelope, where it is converted into N. Note also that the 14N / 15N ratio during the TP-AGB is ≳ 10 000, reaching essentially the CN cycle equilibrium value. The O isotopic ratios also evolve, where the 16O / 17O ratio increases with evolution to a final value of ≈ 465 whereas the 16O / 18O ratio increases to above 106 as almost all of the available 18O is destroyed. The elemental O abundance in the 6 M⊙ model only decreases however by ≈ 0.06 dex.
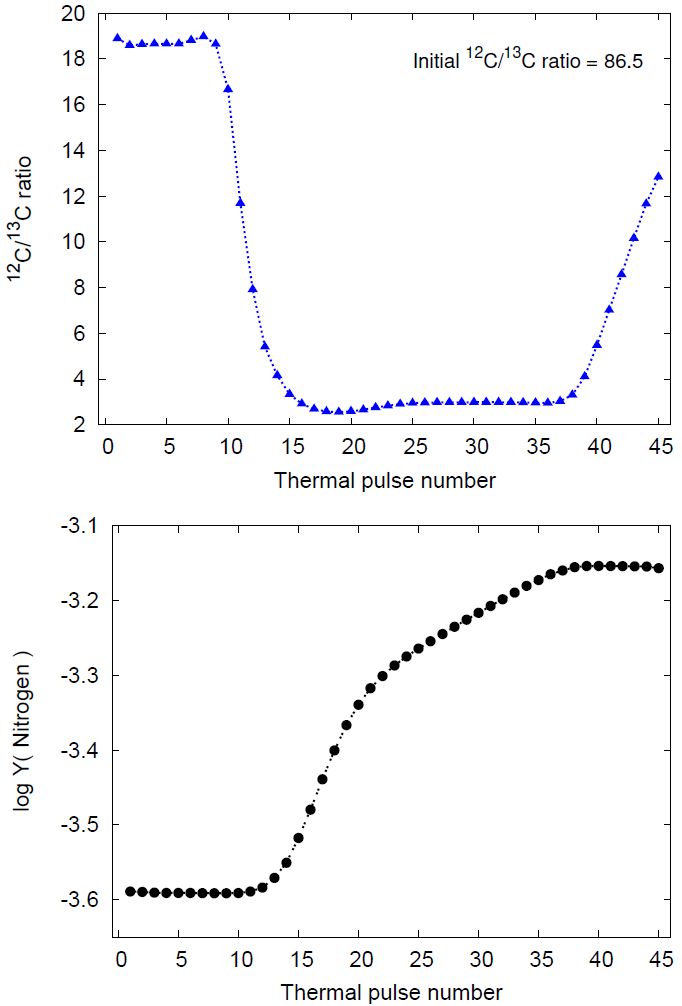 |
Figure 23. The evolution of the 12C / 13C ratio and the nitrogen elemental abundance at the surface of the 6 M⊙, Z = 0.02 model during the TP-AGB. The ratio is given by number and the abundance of nitrogen is in units of log 10(Y), where Y = X / A and X is mass fraction and A is atomic mass. |
In the left part of Figure 24 we show the reactions of the Ne-Na chain (Rolfs & Rodney 1988; Arnould et al. 1999), where unstable isotopes are denoted by dashed circles. The main result of the Ne-Na chain is the production of 23Na at the expense of the Ne isotopes, primarily 22Ne but also 21Ne, which is the rarest neon isotope. The production of Na by the Ne-Na chain was examined in detail by Mowlavi (1999b), who predicted that AGB stars could play an integral role in the chemical evolution of Na in the Galaxy.
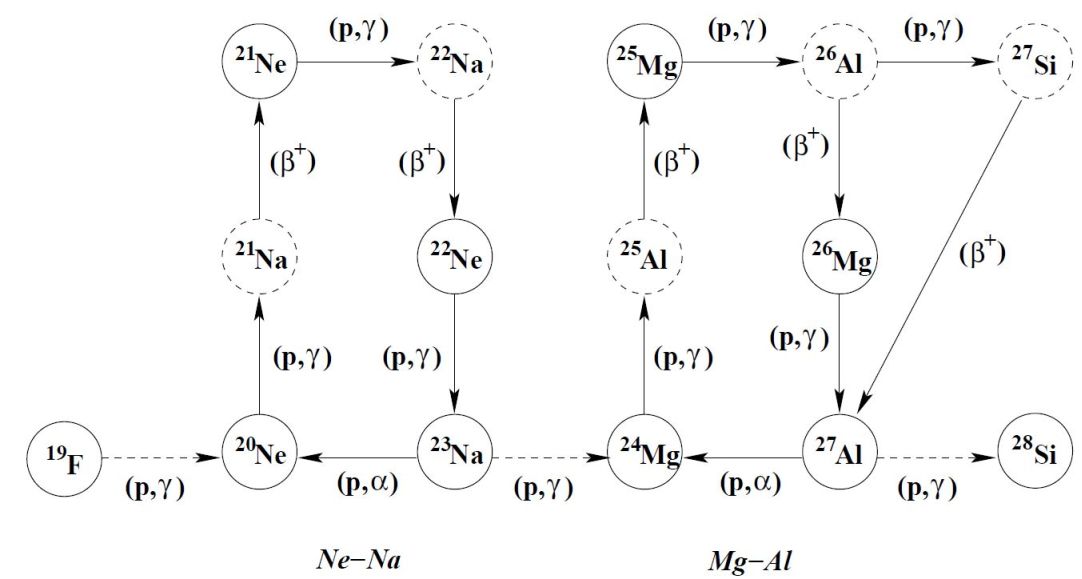 |
Figure 24. Reactions of the Ne-Na and Mg-Al chains. Unstable isotopes are denoted by dashed circles. From Karakas & Lattanzio (2003a) and based on a similar figure in Arnould et al. (1999). |
The dominant 20Ne is not significantly altered by H-shell burning, but the destruction of 23Na at temperatures over 90 MK can lead to a slight enhancement in the 20Ne abundance. The rate of 23Na destruction is important for determining Na yields (e.g., Iliadis et al. 2001; Izzard et al. 2007). Whether there is leakage out of the Ne-Na chain into the Mg-Al chain depends on the relative rates of the uncertain 23Na(p,α)20Ne and 23Na(p,γ)24Mg reactions. Hale et al. (2004) presented revised rates of both of these reactions and found them to be faster than previous estimates (e.g., Angulo et al. 1999; Iliadis et al. 2001) which had a significant impact on Na yields from AGB stars as we discuss in Section 5.
Magnesium and aluminium are altered in the H-burning shell via the activation of the Mg-Al chain, whose reactions are shown on the right-hand side of Figure 24. This series of reactions involves the radioactive nuclide 26Al which has a ground state 26Alg with a half-life of τ1/2 = 700 000 years along with a short-lived (τ1/2 = 6.35 s) isomeric state 26Alm. These have to be considered as separate species since they are out of thermal equilibrium at the relevant temperatures (Arnould et al. 1999). Hereafter, when we refer to 26Al we are referring to the ground-state, 26Alg.
The first isotope in the Mg-Al chain to be affected is 25Mg, which is burnt to 26Al. The β-decay lifetime of 26Al relative to proton capture generally favours proton capture within the H-burning shell. This produces the unstable 27Si which quickly β-decays (with a lifetime on the order of a few seconds) to 27Al. The abundance of 26Mg is enhanced by the β-decay of 26Al in the H-shell ashes. Proton capture on 24Mg requires higher temperatures than those required for the other reactions in the Mg-Al chain but model predictions (e.g., Figure 25) suggest that this dominant isotope can be efficiently destroyed by HBB.
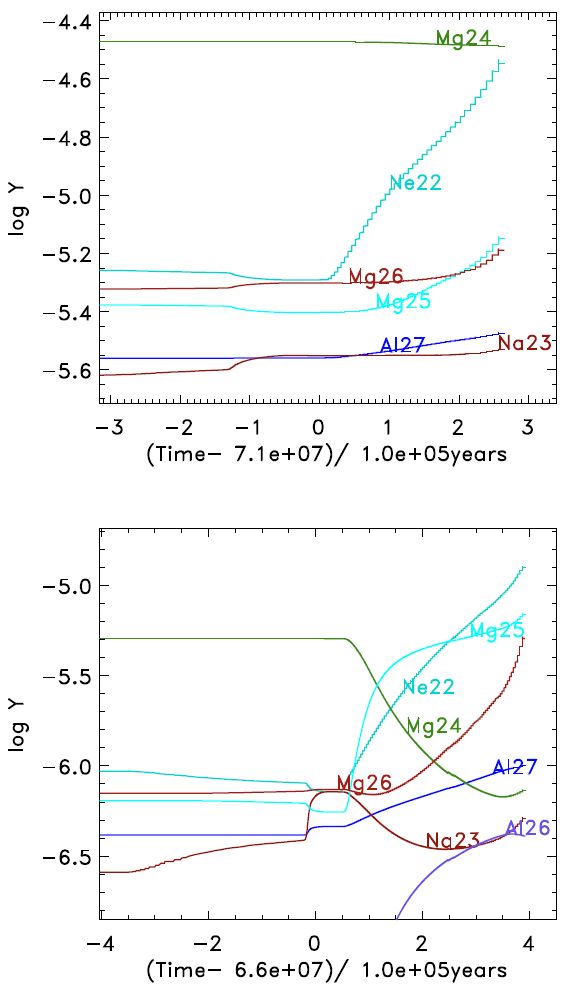 |
Figure 25. The evolution of various species involved in the Ne-Na and Mg-Al chains at the surface of the 6 M⊙, Z = 0.02 model (upper panel) and 6 M⊙, Z = 0.004 model (lower panel) during the TP-AGB. Time on the x-axis is scaled such that t = 0 is the time at the first thermal pulse. Abundances on the y-axis are in units of log 10Y, where Y = X / A, where X is mass fraction and A is atomic mass. Both calculations used the same set of of reaction rates and scaled solar abundances. The 6 M⊙, Z = 0.004 model has been described previously in Karakas (2010). |
In Figure 25 we show the evolution of various isotopes involved in the Ne-Na and Mg-Al chains at the surface of two models of 6 M⊙. The upper panel shows the predicted nucleosynthesis for the 6 M⊙, Z = 0.02 model we have been describing so far, which has a peak Tbce of 82 MK. The lower panel shows results from a 6 M⊙, Z = 0.004 model which has a peak Tbce of 95 MK. While the CNO isotopes for the 6 M⊙, Z = 0.02 model (Figure 23) clearly show the effects of HBB on the predicted surface abundances, the abundances of heavier isotopes show only marginal activation of the Ne-Na and Mg-Al chains. Most of the increase in 22Ne, 25Mg, and 26Mg is from the TDU bringing He-shell burning products to the surface. The slight increase in 27Al ([Al/Fe] ≈ 0.1 at the tip of the AGB) is mostly from Al produced in the H shell and mixed to the surface by the TDU and not from HBB. Sodium barely increases from the post-SDU value. In contrast, the lower metallicity 6 M⊙ model, which is not only hotter but more compact, shows considerable destruction of 24Mg, an increase in 26Al which can only come from H burning and the Mg-Al chains, and variations in 25Mg and 26Mg consistent with HBB. Sodium initially increases before being destroyed again by proton-capture reactions.
There is a paucity of observational evidence for constraining stellar models of intermediate-mass stars during their TP-AGB phase. This is partly because there are few stars found at the AGB-luminosity limit near Mbol ≈ −7 but also because of the complexity of the model atmospheres required for the interpretation of the spectra. Evolved intermediate-mass AGB stars are long-period pulsators with low effective temperatures, which means that the dynamics of the atmosphere must be taken into consideration (McSaveney et al. 2007). The few observations of stars in our Galaxy suggest that most of them, even the optically obscured stars, are O-rich and s-process-rich which points to both efficient HBB and TDU (Wood et al. 1983; García-Hernández et al. 2006, 2013). In the Magellanic Clouds, most of the bright AGB stars are also O-rich but some dust-obscured objects are also C-rich as we have already noted.
The study by McSaveney et al. (2007) obtained abundances for a small sample of bright AGB stars for comparison to theoretical models. The observations of C, N, and O were a relatively good match to stellar evolution models but no observed enrichments were found for Na and Al. We note that the latest nuclear reaction rates suggest much lower Na production than previously calculated (Karakas 2010) so perhaps this is not surprising. Al production is also predicted to be highly metallicity dependent with little production in AGB stars with [Fe/H] ≳ −0.7 (Ventura et al. 2013).
Predictions such as those presented here (or by others, e.g., Ventura et al. 2013) that intermediate-mass AGB stars result in nucleosynthesis variations in the Ne, Na, Mg, and Al isotopes are particularly useful for comparison to GC abundance anomalies. All well-studied GCs show star-to-star abundance variations in C, N, O, F, and Na, and some show variations in Mg, Al, and Si (e.g., Gratton et al. 2004, 2012; Carretta et al. 2009; Yong et al. 2013, and references therein) and only a few GCs show variations in iron-peak and heavy elements (e.g., ω Cen and M22 Norris & Da Costa 1995; Johnson et al. 2008; Da Costa & Marino 2011). The lack of star-to-star variations in Fe and Eu have led to the conclusion that core-collapse supernovae did not play a role in the self enrichment of these systems and have suggested an important contribution from intermediate-mass AGB stars. Globular cluster star abundances show C and N are anti-correlated with each other, as are O and Na, and (sometimes) Mg and Al. That is the pattern expected if H burning at relatively high temperatures has caused the observed abundance patterns (Prantzos et al. 2007).
At the highest HBB temperatures, breakout of the Mg-Al cycle can occur via the 27Al(p,γ)28Si reaction. If this occurs then we would expect to see correlations between enhanced Al and Si (Ventura, Carini, & D’Antona 2011). Yong et al. (2008) find that N abundances in the giant stars of the GC NGC 6752 are positively correlated with Si, Al, and Na, indicating breakout of the Mg-Al chain. Carretta et al. (2009) also find a spread in the Si abundances of the GCs NGC 6752 (see also Yong et al. 2013) and NGC 2808, and a positive correlation between Al and Si. Models by Ventura et al. (2011) show that the most Al-enriched models are also enriched in Si so it seems that hot H burning can produce such a trend, even if the site of the proton-capture nucleosynthesis in GCs is still unknown.
It is possible to obtain isotopic ratios for Mg by using the MgH line (Guelin et al. 1995; Shetrone 1996a, 1996b; Gay & Lambert 2000; Kahane et al. 2000; Yong et al. 2003a; Yong, Lambert, & Ivans 2003b; Yong, Aoki, & Lambert 2006; Da Costa, Norris, & Yong 2013). The Mg isotopic ratios therefore become an important probe of the site of the nucleosynthesis that has added to the chemical enrichment of GC systems. The GCs show an intriguing trend: the stars that are considered normal or ‘not polluted’ are (relatively) O-rich and Na-poor, and sometimes Mg-rich and Al-poor. These stars show a near solar Mg isotopic ratio. The stars that are considered ‘polluted’ show O-depletions and sometimes Mg-depletions, are rich in Na and sometimes Al. For those globular clusters that do show stars with variations in Mg and Al we find that 24Mg is depleted at the expense of 26Mg with essentially no star-to-star variations in 25Mg (e.g., Da Costa et al. 2013).
In Figure 26 we show the evolution of the Mg isotopes at the surface of a 6 M⊙, Z = 0.004 ([Fe/H] ≈ -0.7) AGB model. The metallicity of this model matches some of the stars in ω Cen studied by Da Costa et al. (2013) and the sole M 71 star analysed by Yong et al. (2006), and may help reveal a trend with metallicity. If we focus just on ω Cen, then at all metallicities the stars show approximately solar ratios for 25Mg / Mg ≈ 0.1 (e.g., Figure 9 in Da Costa et al. 2013). In contrast, 24Mg / Mg shows a decrease with [Fe/H], while 26Mg / Mg shows an increase, with the most extreme cases showing 24Mg/Mg ≈ 0.5 and 26Mg / Mg ≈ 0.4 at [Fe/H] ≈ −1.5. At the metallicity of the 6 M⊙ AGB model shown in Figure 26, all observed ratios are again approximately solar, in disagreement with model predictions.
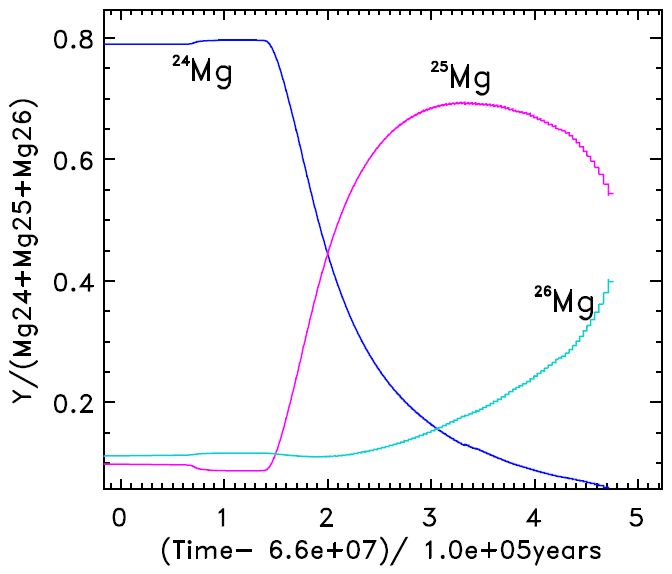 |
Figure 26. The evolution of stable Mg isotopes at the surface of the 6 M⊙, Z = 0.004 model during the TP-AGB. Time on the x-axis is scaled such that t = 0 is the time at the first thermal pulse. Abundances on the y-axis are scaled to the total Mg composition, Y(iMg) / {Y(24Mg) + Y(25Mg) + Y(26Mg)}, where Y = X / A, where X is mass fraction and A is atomic mass. The initial Mg isotopic ratios on the main sequence are solar: 24Mg / 25Mg = 7.89 and 24Mg / 26Mg = 7.17 (e.g. Asplund et al. 2009). By the tip of the TP-AGB, the model ratios are 24Mg / 25Mg = 0.11 and 24Mg / 26Mg = 0.14 indicating that most of the 24Mg has been destroyed by proton captures. |
What is particularly unusual about these observed abundance ratios is: (1) at the low metallicities of the GC stars examined to date, chemical evolution models suggest a dominant contribution from core-collapse supernovae that produce mostly 24Mg and there should be almost no 25Mg or 26Mg (e.g., Kobayashi et al. 2011b). That is, the normal stars should be completely dominated by 24Mg (about 97% of the total Mg) and not show a solar Mg isotopic ratio. (2) H burning in AGB stars or massive stars, regardless of the stellar evolution code used, struggles to explain these isotopic ratios and unchanging 25Mg abundances without resorting to variations in reaction rates (Fenner et al. 2004; Herwig 2004b; Decressin, Charbonnel, & Meynet 2007; de Mink et al. 2009; Ventura & D’Antona 2009). Parametric models can explain the observed abundances but provide few clues as to the physical site responsible (Prantzos et al. 2007). We note that reaction rates involving the Mg and Al species are quite uncertain and the new reaction rates presented by Straniero et al. (2013) may help resolve the issue.
The discovery that the brightest AGB stars are rich in Li (Smith & Lambert 1989, 1990a; Plez et al. 1993; García-Hernández et al. 2013) gave further credibility to the idea that HBB was actually occurring in intermediate-mass AGB stars. The production of 7Li is thought to occur via the Cameron-Fowler mechanism (Cameron & Fowler 1971): Some 3He, created earlier in the evolution (during central H-burning), captures an α-particle to create 7Be. The 7Be can either (1) capture a proton to complete the ppIII chain, or (2) capture an electron to produce 7Li. Whether the 7Be follows path (1) or path (2) depends critically on the temperature of the region. Owing to efficient mixing in the convective envelope, some of the 7Be is mixed into a cooler region which prevents proton capture. The 7Be will undergo electron capture instead, producing 7Li. The 7Li is also subject to proton capture and is eventually mixed into the hot temperature region and subsequently destroyed. Once the envelope is depleted in 3He, 7Li production stops. In Figure 27 we illustrate the evolution of 7Li at the surface of a 6 M⊙, Z = 0.02 model during the TP-AGB. The Li-rich phase occurs when the abundance of Li exceeds log ε(Li) ≳ 2 and lasts for ~ 200 000 years for the 6 M⊙, Z = 0.02 model shown in Figure 27.
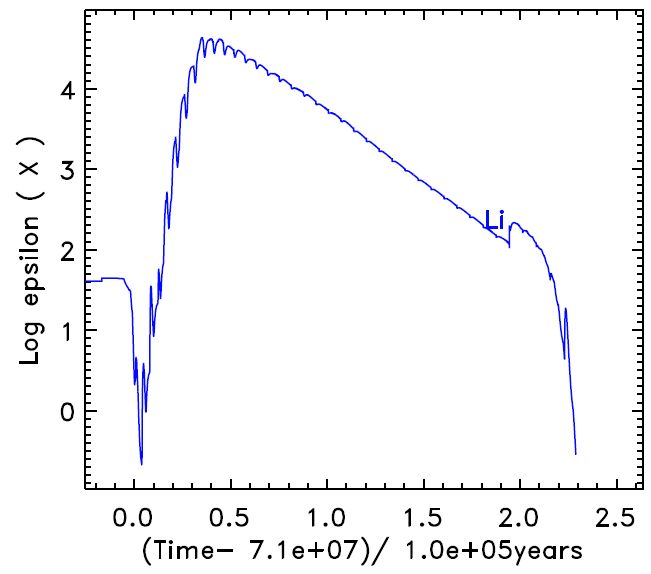 |
Figure 27. The surface abundance of 7Li during the TP-AGB phase for a 6 M⊙, Z = 0.02 model. The units on the y-axis are log 10(n(Li)/n(H) + 12) and time on the x-axis is scaled such that t = 0 is the beginning of the TP-AGB. The lithium-rich phase lasts for about 200 000 years. |
Some approximation to time-dependent mixing is required to produce 7Li in a HBB calculation because the nuclear timescale for the reactions involved in the Cameron-Fowler mechanism is similar to the convective turnover timescale (see Figure 2 in Boothroyd & Sackmann 1992). Stellar evolution calculations usually use the diffusion equation to approximate mixing in stellar interiors, although we warn that this is only an approximation and that mixing is advective rather than diffusive.
Stellar evolution models are able to account for the magnitude of the Li-enrichment observed in intermediate-mass AGB stars, even though there are considerable modelling uncertainties (van Raai et al. 2012; García-Hernández et al. 2013). Ventura, D’Antona, & Mazzitelli (2000) were able to use the Li-rich phase of bright intermediate-mass AGB stars in the Magellanic Clouds as a constraint of mass-loss rates, which are a highly uncertain but important ingredient in stellar evolution modelling. Ventura et al. (2000) concluded that large mass-loss rates of 10-4 M⊙/year are required to fit the observations of Li-rich AGB stars in the Magellanic Clouds. Using the Blöcker mass-loss rate (Blöcker 1995), they were able to constrain the ηr parameter to ≈ 0.01, where higher values of ≥ 0.05 lead to too high mass-loss rates when compared to the population of optically visible luminous, Li-rich AGB stars in the Magellanic Clouds.
3.6.4. Type I planetary nebulae
Type I PNe are defined as a separate class based on both abundances and morphology. Peimbert & Torres-Peimbert (1987) originally defined Type I PNe to have He/H > 0.125, N/O > 0.5 and to show, in general, bipolar morphologies (Peimbert 1978; Peimbert & Torres-Peimbert 1987; Peimbert 1990). Kingsburgh & Barlow (1994) propose a modified N threshold (N/O > 0.8) based on nuclear processing constraints and find that Type I PNe constitute about 16% of their sample. This fraction is close to the fraction of bipolar PNe found by Manchado (2003), at 17%. The bipolars are more or less the same as the Type Is, with an average N/O = 1.3. Note that selection effects are uncertain and can be substantial (e.g., not accounting for selection effects, roughly 23% of the PNe are Type I in the sample of Sterling & Dinerstein 2008).
Type I PNe are associated with a younger, metal-rich population that evolved from initial stellar masses of 2 - 8 M⊙ (Peimbert 1990; Corradi & Schwarz 1995; Peña, Rechy-García, & García-Rojas 2013). The origin of Type I PNe has been associated with intermediate-mass stars experien-cing HBB (Vassiliadis et al. 1996) but the large number of Type I objects (roughly 17%), combined with the very short post-AGB crossing time for M ≥ 4 M⊙ stars (e.g., Bloecker 1995) suggest that the initial progenitor masses are closer to 3 M⊙.
Standard AGB models of ≈ 3 M⊙ do not produce the high He/H and N/O ratios that are typical of Type I PNe (e.g., Figure 22). While some Type I PNe may be associated with binary evolution owing to the high frequency of Type I objects associated with non-spherical/elliptical morphologies (e.g., Shaw et al. 2006; Stanghellini & Haywood 2010) some fraction of the Type I PNe will have evolved as essentially single stars. Rotation rates peak in main sequence stars of ≳ 3 M⊙ and it has been suggested that rotationally induced mixing on the main sequence could be one mechanism to increase the post-FDU He and N abundance (Karakas et al. 2009; Lagarde et al. 2012; Miszalski et al. 2012; Stasińska et al. 2013).
3.7. The slow neutron capture process
Most heavy nuclei with atomic masses greater than A > 56 are formed by neutron addition onto abundant Fe-peak elements. The solar abundance distribution shown in Figure 28 is characterised by peaks that can be explained by:
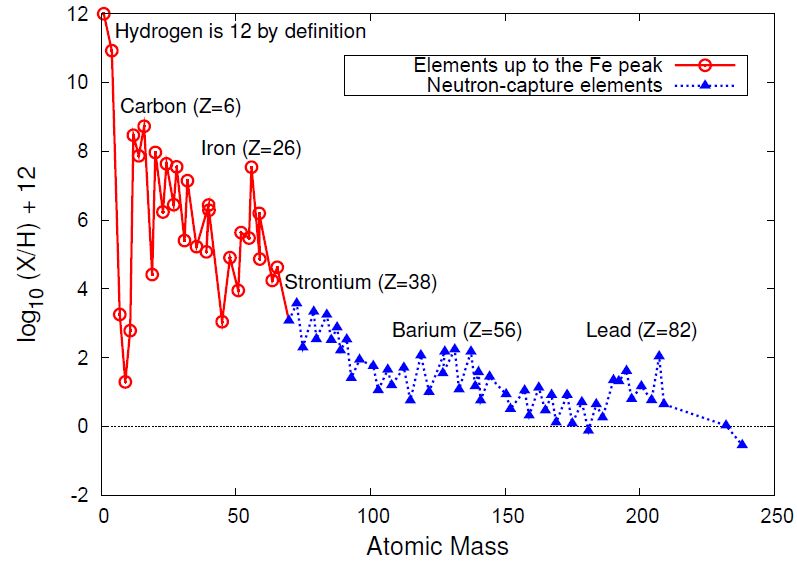 |
Figure 28. Solar abundance distribution using data from Asplund et al. (2009). The main features of the abundance distribution include the hydrogen (proton number, Z = 1) and helium peaks, resulting from Big Bang nucleosynthesis, followed by the gorge separating helium from carbon where the light elements lithium, beryllium, and boron reside. From carbon there is a continuous decrease to scandium followed by the iron peak and then a gentle downwards slope to the elements predominantly produced by neutron captures. These include elements heavier than zinc and are highlighted in blue. Proton numbers are also given for a selection of elements. |
The seminal papers by Burbidge, Burbidge, Fowler, & Hoyle (1957) and Cameron (1957) laid down the foundations for these processes and Wallerstein et al. (1997) provides an updated review (see also the reviews by Meyer 1994; Busso et al. 1999; Herwig 2005; Lattanzio & Lugaro 2005; Käppeler et al. 2011).
During the r-process neutron densities as high as Nn ≳ 1020 neutrons cm− 3 are produced. This means that the timescales for neutron capture are much faster than β-decay rates. The r-process will produce isotopes essentially up to the neutron drip line. These isotopes then decay to stable, neutron-rich isotopes once the neutron flux is gone. Given the extreme conditions required for the r-process, it has been hypothesised to occur during supernovae explosions (Fryer et al. 2006; Wanajo et al. 2009, 2011; Arcones, Janka, & Scheck 2007; Arcones & Montes 2011; Winteler et al. 2012) but other sites have also been proposed including colliding neutron stars (Argast et al. 2004; Korobkin et al. 2012), and black hole/neutron star mergers (Surman et al. 2008). We refer to Meyer (1994), Arnould, Goriely, & Takahashi (2007), and Thielemann et al. (2011) for further details.
For the rest of this section we will concern ourselves with the s-process, which occurs under conditions of relatively low neutron densities (Nn ≲ 108 neutrons cm-3). In Figure 29 we show the typical path of the s-process through a section of the chart of the nuclides around the Zr to Ru region. During the s-process the timescale for neutron capture is slower, in general, than the β-decay rate of unstable isotopes. In Figure 29 we can see that when neutrons reach a relatively short-lived isotope, such as 95Zr with a half-life of approximately 64 days, the isotope will have time to decay to 95Mo instead of capturing another neutron. The s-process will therefore produce isotopes along the valley of β-stability and is responsible for the production of roughly half of all elements heavier than Fe.
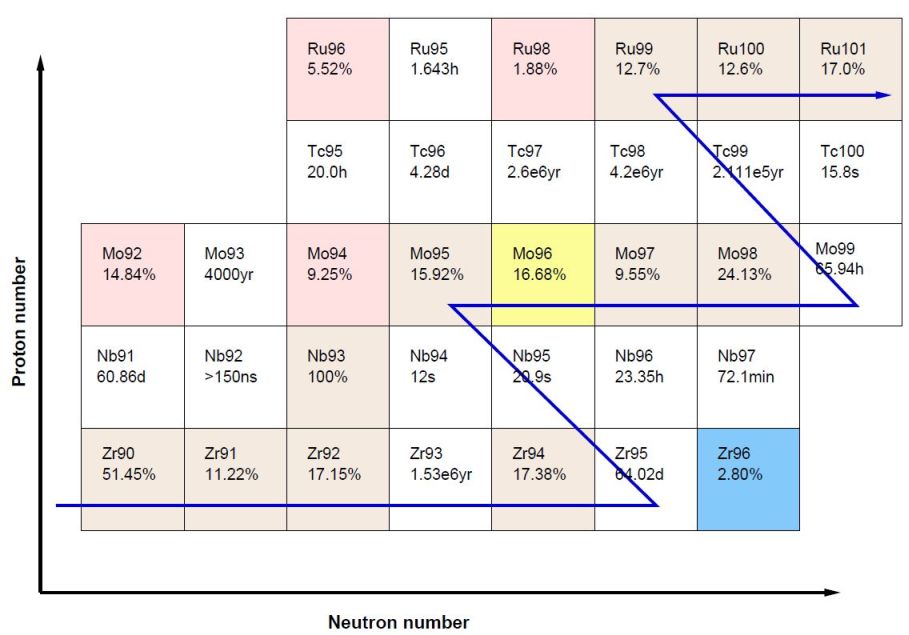 |
Figure 29. Schematic showing the Zr to Ru region of the chart of the nuclides. Neutron number increases along the x-axis and proton number on the y-axis. Unstable isotopes are shown as white squares with the half-life of the ground state. Stable isotopes are shown in colour with the solar-system percentage shown (not all isotopes are shown, so the total may not sum to 100). The typical s-process path that results from neutron densities typical of the 13C(α,n)16O neutron source is shown by the thick blue line. Under these conditions, the isotope 96Zr is not reached by the s-process and is an r-process only isotope (in blue). Similarly, the isotope 96Mo is an s-only isotope (in yellow) because it is shielded from the r-process by 96Zr. The isotopes that are not reached by neutron capture are shown in pink and are produced either by proton addition or spallation under extreme conditions. The unstable isotope 99Tc is on the main s-process path. |
While it is common to characterise elements as being produced by one of the neutron-capture processes (e.g., Eu is an r-process element), we stress that most heavy elements are produced in part by both the s- and the r-processes. However, there are some isotopes that are only produced by the s-process (e.g., 96Mo in Figure 29) because of shielding from the r-process, while some neutron-rich isotopes cannot be easily reached by the s-process (e.g., 96Zr). Some proton-rich heavy isotopes cannot be reached by either the s- or r-process and are usually rare in nature and a small component of the total elemental fraction. Examples include 92, 94Mo, shown in Figure 29, which together make up 24% of elemental Mo in the solar system. Arlandini et al. (1999) used detailed AGB stellar models to provide a breakdown of the solar system isotopic abundance distribution according to an origin in either the r- or s-process (their Table 2; see similar breakdowns by Goriely 1999; Travaglio et al. 2004; Simmerer et al. 2004; Sneden, Cowan, & Gallino 2008). Examples of elements where the solar-system abundance fraction is mainly produced by the s-process include Sr, Y, Zr, Ba, La, and Pb, where 91% of solar-system Pb was produced in the s-process (Table 3 in Travaglio et al. 2001a). Similarly some elements such as Ag, Xe, Eu are predominantly produced by the r-process (e.g., 97% of solar-system Eu, see Sneden et al. 2008).
In Figure 28 we show the distribution of elements in our solar system using the latest set of solar abundances from Asplund et al. (2009). We have highlighted elements heavier than Fe in blue, and an examination of this figure shows peaks around Sr, Ba, and Pb (corresponding to atomic masses 88, 137, 207 respectively). These elements are dominated by nuclei with a magic number of neutrons (n = 50, 82, 126). Note that for lighter elements there are also peaks at n = 2, 8, 20, and 28. A nucleus composed of a magic number of protons and a magic number of neutrons is very stable and considered to be ‘doubly magic’. Examples include 16O with 8 protons and 8 neutrons, and 208Pb, with 82 protons and 126 neutrons. Supernovae produce a considerable amount of 56Ni, which is doubly magic with 28 protons and 28 neutrons and eventually decays to 56Fe and is the cause of the Fe-peak seen in Figure 28. The stability of nuclei with a magic number of nucleons follows from the closed shells in the quantum mechanical model of the nucleus (Mayer 1950). In practice, nuclei with a magic number of neutrons are more stable against neutron capture than surrounding nuclei because of their low neutron capture cross sections. These nuclei act as bottlenecks and are consequently seen as s-process peaks in the abundance distribution.
Theoretically there are two main astrophysical ‘sites’ of the s-process in nature. The first are AGB stars, which are observationally and theoretically confirmed as factories for the production of heavy elements. The first evidence that stars and not the Big Bang are responsible for the production of elements heavier than Fe came from observations by Merrill (1952) of radioactive Tc in red giant stars. The second main s-process site is massive stars, where the s-process occurs during core He burning and in the convective C-burning shell, prior to the supernova explosion (The, El Eid, & Meyer 2000; The et al. 2007; Pignatari et al. 2010; Frischknecht, Hirschi, & Thielemann 2012). We will concentrate on the s-process occurring in AGB stars.
3.7.1. Neutron sources in AGB stars
Neutron capture processes require a source of free neutrons, given that neutrons are unstable and decay in about 15 minutes. There are two important neutron sources available during He-shell burning in AGB stars:
The 22Ne(α, n)25Mg reaction was first identified as a neutron source for AGB stars by Cameron (1960). The intershell region is rich in 14N from CNO cycling and during a thermal pulse 14N can suffer successive α captures to produce 22Ne. If the temperature exceeds 300 × 106 K, 22Ne starts to capture α particles to produce 25Mg and 26Mg in almost equal proportions. Neutrons are released by the 22Ne(α, n)25Mg reaction during convective thermal pulses. Given the high temperatures required for the 22Ne(α, n)25Mg to operate efficiently, it is theoretically predicted to be effective in AGB stars with initial masses ≳ 4 M⊙.
The observational data for the s-process mainly comes from ‘intrinsic’ low-mass AGB stars and their progeny, with initial progenitor masses ≲ 4 M⊙. The 22Ne(α, n)25Mg is not efficient in these stars and requires operation of the 13C(α, n)16O neutron source instead. Observations come from stars with spectral types M, S, SC, C(N), post-AGB stars, and planetary nebulae (Smith & Lambert 1986; Vanture et al. 1991; Abia et al. 2001, 2002; Abia, de Laverny, & Wahlin 2008; Van Winckel & Reyniers 2000; Reyniers et al. 2007; Sterling & Dinerstein 2008; van Aarle et al. 2013). Extrinsic s-process rich objects also provide a wealth of observational data and include barium and CH-type stars, carbon-enhanced metal-poor (CEMP) stars, dwarf C stars, and some planetary nebulae (Luck & Bond 1991; Allen & Barbuy 2006a, 2006b; Allen & Porto de Mello 2007; Suda et al. 2008, 2011; Masseron et al. 2010; Pereira, Gallino, & Bisterzo 2012; Miszalski et al. 2013). These observations are consistent with theoretical models covering a broad range in metallicity and mass (e.g., Hollowell & Iben 1988; Gallino et al. 1998; Goriely & Mowlavi 2000; Busso et al. 2001; Lugaro et al. 2003; Karakas, Lugaro, & Gallino 2007; Karakas et al. 2009; Cristallo et al. 2009, 2011; Karakas & Lugaro 2010; Bisterzo et al. 2010, 2011, 2012; Lugaro et al. 2012; Pignatari et al. 2013).
Efficient activation of the 13C(α, n)16O reaction requires some 13C to be present in the intershell. CNO cycling during the previous interpulse phase leaves a small amount of 13C but not enough to account for the s-process enrichments of AGB stars (e.g., Gallino et al. 1998; Karakas et al. 2007). For the 13C neutron source to produce enough neutrons to feed the s-process there has to be an additional source of 13C. This requires the operation of both proton and α-capture reactions in the He intershell, a region normally devoid of protons.
If some protons are mixed from the convective envelope into the top layers of the He intershell then these protons will react with the abundant 12C to produce 13C via the CN cycle reactions: 12C(p,γ)13N(β+ ν)13C (Iben & Renzini 1982b). This results in a thin layer rich in 13C and 14N known as the ‘13C pocket’ (Iben & Renzini 1982a). Straniero et al. (1995) discovered that the 13C nuclei then burn via (α,n) reactions in radiative conditions before the onset of the next thermal pulse. The neutrons are released in the 13C pocket, and the s-process occurs between thermal pulses in the same layers where the 13C was produced. When the next convective thermal pulse occurs, it ingests this s-element rich layer, mixing it over the intershell.
It does appear that there is a dichotomy in models of the s-process in AGB stars. This arises because low-mass models do not reach temperatures high enough to activate the 22Ne source and as a consequence the 13C neutron source is dominant. At a metallicity of Z = 0.02 the mass at which the importance of the two neutron sources switch is ≃ 4 M⊙ (Goriely & Siess 2004). This dichotomy has important implications for the yields of s-process elements produced by AGB stars of different mass ranges.
The 13C and the 22Ne neutron sources produce s-process abundance distributions that are very different from each other. There are two main reasons for this. The first is that the 13C source operates over long timescales (≈ 103 years), which means that the time integrated neutron fluxes are high even if the peak neutron densities are lower (≲ 107 neutrons cm-3) than for the 22Ne source (Busso et al. 2001). This means the s-process can reach isotopes beyond the first s-peak at Sr-Y-Zr to Ba and Pb (Gallino et al. 1998). It is for this reason that the 13C source is responsible for the production of the bulk of the s-process elements in low-mass AGB stars reaching, as mentioned above, up to Pb at low metallicities (Gallino et al. 1998). In contrast, the 22Ne source operates on timescales of ≈ 10 years and even though the peak neutron densities are high (up to 1015 neutrons cm-3) the time integrated neutron fluxes are low and the s-process will not, in general, reach beyond the first s-process peak.
The second reason for the difference in the predicted distribution is that branching points on the s-process path are activated by the 22Ne source (Abia et al. 2001; van Raai et al. 2012; Karakas et al. 2012). For example, the amount of Rb produced during the s-process depends on the probability of the two unstable nuclei 85Kr and 86Rb capturing a neutron before decaying. These two isotopes therefore act as ‘branching points’ and the probability of this occurring depends on the local neutron density (Beer & Macklin 1989). When the 22Ne source is active, branching points at 85Kr and 86Rb are open and 87Rb is produced. In particular, more Rb is produced relative to Sr (or Y or Zr). In constrast, during the operation of the 13C neutron source these branching points are not efficiently activated and the ratio of Rb to Sr (or Y or Zr) remains less than unity.
3.7.2. The formation of 13C pockets
For the 13C(α, n)16O reaction to occur efficiently, some partial mixing is required at the border between the H-rich envelope and the C-rich intershell. This mixing pushes protons into a C-rich region suitable for the production of 13C. It is important that there are not too many protons mixed into this region because then the CN cycle goes to completion, producing 14N rather than 13C. Now 14N is a neutron poison, which means that it is an efficient neutron absorber and will change the resulting abundance distribution. In the region of the pocket where 14N is more abundant than 13C, no s-process nucleosynthesis occurs because of the dominance of the 14N(n,p)14C reaction over neutron captures by Fe-seed nuclei and their progeny.
In the intermediate-mass AGB stars that experience HBB, the formation of a 13C pocket may be inhibited by proton captures occurring at the hot base of the convective envelope during the TDU, which produces 14N and not 13C (Goriely & Siess 2004). Extremely deep TDU may also inhibit the activation of the 13C(α,n)16O reaction by penetrating into regions of the stellar core with a low abundance of He (Herwig 2004a). Furthermore, a lack of Tc in the spectra of intermediate-mass AGB stars that are rich in Rb is observational evidence that 13C pocket formation is inhibited (García-Hernández et al. 2013).
The details of how the 13C pocket forms and its shape and extent in mass in the He intershell are still unknown. These are serious uncertainties and mostly arise from our inability to accurately model convection in stars (Busso et al. 1999). Various mechanisms have been proposed including partial mixing from convective overshoot (Herwig 2000; Cristallo et al. 2009, 2011), rotation (Herwig, Langer, & Lugaro 2003; Piersanti, Cristallo, & Straniero 2013), and gravity waves (Denissenkov & Tout 2003).
Progress will come from continued three-dimensional hydrodynamical simulations of the interface between the envelope and the intershell of AGB stars. The first simulations by Herwig et al. (2006) have provided some insight into the nature of convection during thermal pulses but are still too crude in spatial resolution, and cover such a small amount of star time that we are still very limited in any insights into the nature of 13C pocket formation in low-mass AGB stars.
Models that include artificial 13C pockets produce s-process abundance distributions that fit the observational data reasonably well. Free parameters allow us to adjust the features of the mixing zone (e.g., the shape of the 13C profile and its extent in mass) in order to match the observations (Goriely & Mowlavi 2000; Cristallo et al. 2009; Bisterzo et al. 2010; Kamath et al. 2012; Lugaro et al. 2012). Some of the best observational constraints come from post-AGB stars, where the higher photospheric temperatures allow for more accurate abundance determinations. Observations suggest that stochastic variations in the size of the 13C pocket in AGB stars are present. Bonačić Marinović et al. (2007a) find that Galactic disk objects are reproduced by a spread of a factor of two or three in the effectiveness of the 13C pocket, lower than that found by Busso et al. (2001), who needed a spread of a factor of about 20. Comparisons to lower metallicity post-AGB stars infer spreads of a factor of 3 - 6 (Bonačić Marinović et al. 2007b; De Smedt et al. 2012), while comparison to even lower metallicity CEMP stars require spreads of up to a factor of 10 or more (Bisterzo et al. 2012; Lugaro et al. 2012).
In summary, there is observational evidence that a spread in effectiveness of the 13C pocket is needed in theoretical models, but there is no consensus on how large that spread actually is. This problem indicates a significant lack of understanding of the mechanism(s) responsible for the formation of 13C pockets in AGB stars. In Section 4.5 we discuss other uncertainties related to the modelling of the s-process in AGB stars such as stellar rotation.
3.7.3. The s-process in low-mass AGB stars
We first define the s-process indices light ‘ls’ and heavy ‘hs’. We choose the three main elements belonging to the first s-process peak Sr, Y, and Zr to define [ls/Fe] = ([Sr/Fe] + [Y/Fe] + [Zr/Fe]) / 3, and three main elements belonging to the second s-process peak Ba, La, and Ce to define [hs/Fe] = ([Ba/Fe] + [La/Fe] + [Ce/Fe]) / 3. These are chosen because data for these elements are often available in observational compilations, e.g., CEMP stars (see the SAGA database and other compilations; Suda et al. 2008, 2011; Frebel 2010; Masseron et al. 2010).
The ‘intrinsic’ ratios [hs/ls] and [Pb/hs] reflect ratios of elements only produced by AGB stars, differing from, e.g., [C/Fe] and [Ba/Fe], because Fe is not produced during AGB nucleosynthesis. These intrinsic ratios move away from their initial solar values towards their s-process values after a small number of thermal pulses in low-mass AGB models (in intermediate-mass models this is not necessarily the case owing to the large dilution of the envelope). The intrinsic ratios are, in a first approximation, independent of stellar modelling uncertainties that affect comparison to the observations including TDU, mass loss, stellar lifetime, and accretion and mixing processes on a binary companion. Instead, they mostly constrain the nucleosynthesis occurring in the deep layers of the star.
We have seen that some partial mixing is assumed to produce a 13C pocket that provides the neutrons for low-mass stars. Some authors add a partially mixed region by parameterising an overshoot zone where the mixing velocity falls to zero (Herwig 2000; Cristallo et al. 2009, 2011). The models by Bisterzo et al. (2010) instead artificially introduce a 13C pocket into a post-processing code. The details of the pocket are free parameters and kept constant from pulse by pulse. Starting from a ‘standard case’ first adopted by Gallino et al. (1998) in order to match the s-process main component, Bisterzo et al. (2010) multiply or divide the 13C and 14N abundances in the pocket by different factors.
In our calculations the inclusion of the 13C pocket was made artificially during the post-processing by forcing the code to mix a small amount of protons from the envelope into the intershell (e.g., Karakas et al. 2007; Lugaro et al. 2012). We assume that the proton abundance in the intershell decreases monotonically from the envelope value of ≃ 0.7 to a minimum value of 10-4 at a given point in mass located at Mmix below the base of the envelope. This method is described in detail in Lugaro et al. (2012) and is very similar to that used by Goriely & Mowlavi (2000). The protons are subsequently captured by 12C to form a 13C-rich layer during the next interpulse, where the 13C pocket is much less than Mmix and is typically about 1/10th the mass of the intershell region. In the calculations shown in Figures 30 and 31 we set Mmix = 2 × 10⁻³ M⊙ and this value is held constant for each TDU episode. For further details on our method for introducing 13C pockets we refer to Lugaro et al. (2004), Karakas (2010), Karakas et al. (2007), and Kamath et al. (2012).
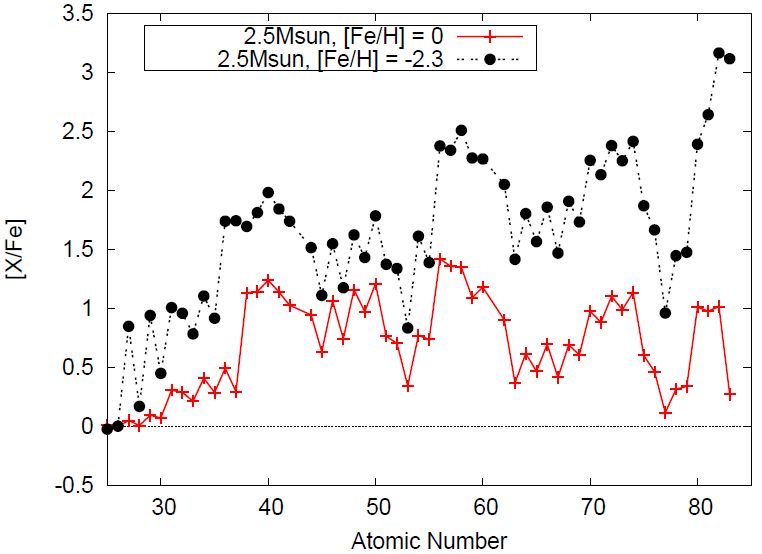 |
Figure 30. Average abundance in the stellar wind (in [X/Fe]) for elements heavier than iron for AGB models of 2.5 M⊙ at two different metallicities: Z = 0.0001 using data published in Lugaro et al. (2012), and new predictions for the Z = 0.02 model. In both models the same size partially mixed zone is inserted into the post-processing nucleosynthesis calculations to produce a 13C pocket (see text for details). The average abundance is calculated from the integrated yield of mass expelled into the interstellar medium over the model star's lifetime. |
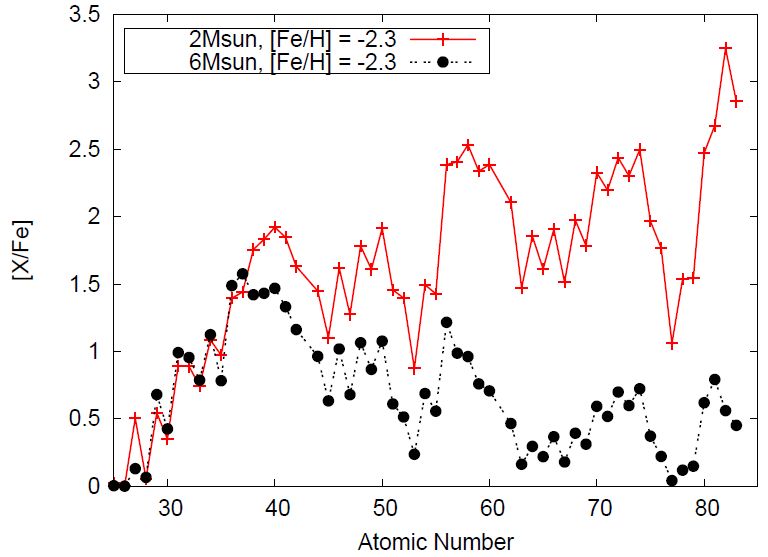 |
Figure 31. Average abundance predicted in the ejected wind (in [X/Fe]) for elements heavier than iron for AGB models of 2 M⊙ and 6 M⊙ at a metallicity of Z = 0.0001 ([Fe/H] = − 2.3) using data published in Lugaro et al. (2012). No 13C pocket is included in the 6 M⊙ model, while we set Mmix = 2 × 10⁻³ M⊙ in the 2 M⊙ case (see Section 3.7.3 for details). |
In Figure 30 we show s-process predictions from models of 2.5 M⊙ at two different metallicities: [Fe/H] = − 2.3 and [Fe/H] = 0.0. In both models we manually add a 13C pocket into the top layers of the He intershell at the deepest extent of each TDU episode, as discussed above. The operation of the 13C(α,n)16O reaction produces [hs/ls] ≥ 0 for low-mass AGB models, regardless of metallicity and the size of the 13C pocket. For example, for the 2.5 M⊙ models shown in Figure 30 the average [hs/ls] in the ejected wind is 0.20 and 0.58, for the Z = 0.02 and Z = 0.0001 models, respectively. Figure 30 illustrates that the initial metallicity has a strong impact on s-process abundance predictions, with significantly more Pb produced at lower metallicity.
The metallicity dependence arises because (most of) the 13C nuclei needed for the 13C(α,n)16O are produced from the H and He initially present in the model star, which is fused into 12C and then to 13C. That is to say that it is a primary neutron source, and is essentially independent of the metallicity of the star, or in other words, largely independent of [Fe/H]. These neutrons are captured on the heavy-element seeds, whose number is roughly proportional to [Fe/H], which is again roughly proportional to the metallicity Z.
This means that the number of time-integrated neutron captures from the 13C source is proportional to 13C / Z (Clayton 1988). Thus there are more neutron captures, producing heavier elements, for stars of lower [Fe/H] (Busso et al. 2001). This property allowed Gallino et al. (1998) to predict the existence of low-metallicity Pb-rich stars, which was confirmed by observations of Pb-rich CEMP stars (Van Eck et al. 2001, 2003). Note that for our 2.5 M⊙ examples, the [Pb/hs] ratio in the ejected stellar wind is − 0.36 for the Z = 0.02 model and increases to 0.76 for the Z = 0.0001 model. Here we have focused on predictions for AGB models with [Fe/H] ≳ −2.5; lower metallicity AGB models will be discussed in Section 3.8.
3.7.4. The s-process in intermediate-mass AGB stars
Wood et al. (1983) noted that the brightest, O-rich AGB stars in the Magellanic Clouds exhibit strong molecular bands of ZrO, indicating that the atmospheres of these stars are enriched in the s-process element Zr. García-Hernández et al. (2006) and García-Hernández et al. (2009) identified several bright, O-rich Galactic and Magellanic Cloud AGB stars with significant enrichments of the neutron-capture element Rb. These observations support the prediction that efficient TDU and HBB has occurred in these stars (García-Hernández et al. 2007).
An enrichment in the element Rb over the elements Sr, Y, and Zr is an important clue that points toward the efficient operation of the 22Ne(α,n)25Mg neutron source in intermediate-mass AGB stars (Truran & Iben 1977; Cosner, Iben, & Truran 1980; Lambert et al. 1995; Abia et al. 2001; van Raai et al. 2012). Under conditions of high neutron densities two branching points open that allow Rb to be synthesised (van Raai et al. 2012). At Nn = 5 × 10⁸ n/cm3, ≈ 86% of the neutron flux goes through 85Kr allowing for 85Kr(n, γ)86Kr(n, γ)87Kr that decays to 87Rb. Note that 87Rb has a magic number of neutrons and the probability to capture neutrons is extremely low. Also, high neutron densities allow neutrons to bypass the branching point at 85Kr and 86Rb, allowing for the chain 86Rb(n, γ)87Rb. For this reason, the elemental ratios of Rb/Sr and Rb/Zr are indicators of the neutron densities, and have been used as evidence that the 13C(α, n)16O reaction is the major neutron source in low-mass AGB stars (Lambert et al. 1995; Abia et al. 2001).
In Figure 31 we show the predicted s-process abundance pattern from a 6 M⊙, Z = 0.0001 AGB model alongside predictions from a low-mass 2 M⊙, Z = 0.0001 AGB model. The predictions for the 6 M⊙ model are typical of intermediate-mass AGB stars and the operation of the 22Ne neutron source in that elements at the first peak around Rb dominate over elements at the second peak, around Ba. This is in contrast to the s-process abundance pattern from the 2 M⊙ model, which is typical of the 13C neutron source operating in a low-mass, low-metallicity AGB model in that it produces significant amounts of Sr, Ba, and Pb, where the average ejected [Pb/Fe] ≈ 3.2 (see also Figure 30).
The 6 M⊙ model produces considerable Rb, where the average [Rb/Fe] = 1.60 in the ejected wind, higher than the neighbouring [Sr/Fe] = 1.4, which gives [Sr/Rb] < 0. The s-process indicators, [hs/ls] and [Pb/hs] are negative (− 0.38 and − 0.50, respectively for the 6 M⊙, Z = 0.0001 model), indicating that elements at the first s-process peak around Rb-Sr-Y-Zr are predominantly produced. Figure 31 highlights why it is important to have s-process yields covering a large range in mass, not just metallicity as shown in Figure 30.
There are few model predictions of s-process nucleosynthesis from intermediate-mass AGB stars, in contrast to the situation for lower mass AGB stars. This is partly because the models experience many thermal pulses and computations involving hundreds of isotopes are particularly time-consuming. It is also because there are few observational constraints that there is much debate as to the occurrence (or not) of the TDU in intermediate-mass AGB stars.
The s-process predictions published for intermediate-mass stars include the following works: Goriely & Siess (2004), who studied the interplay between hot TDU episodes and the s-process as a function of mass; Karakas et al. (2009), who provided predictions up to the first s-process peak for comparison to Type I PNe; Lugaro et al. (2012) who provided predictions for a mass grid (M = 1 to 6 M⊙) at Z = 0.0001 (or [Fe/H] ≈ −2.3); Karakas et al. (2012) who extended the study to Z = 0.02 for comparison to the Galactic OH/IR sample; D’Orazi et al. (2013) who presented new predictions for comparison to globular cluster stars; Pignatari et al. (2013) who provided NuGrid s-process predictions from a 5 M⊙ model at two metallicities (Z = 0.02, 0.01); and Straniero et al. (2014) who provide predictions for 4, 5, and 6 M⊙ models at one metallicity (Z = 0.0003 and [α/Fe] = + 0.5). The models by Pignatari et al. (2013) are calculated with the MESA stellar evolution code 4 and include convective overshoot into the C-O core and consequently have higher peak temperatures than canonical models without such overshoot.
3.8. Proton ingestion episodes: PIEs
Stellar evolution at low metallicity presents a new phenomenon, which we have briefly discussed in Section 2.6.3. We saw that during the core flash in very low metallicity models ([Fe/H] ≲ -3) we can find contact between the flash-driven convective region, which is rich in He, and the H-rich envelope. There are two reasons why this happens preferentially in lower metallicity stars: first, the core flash is ignited far off centre, and relatively close to the H-rich envelope. Second, there is normally a substantial entropy gradient that acts to keep these two regions separated. But at lower metallicity this gradient is greatly reduced, enabling the two convective regions to make contact. This results in H-rich material being mixed down to temperatures where He is burning almost explosively, at T ≳ 100MK. There are many names for these events in the literature, some quite convoluted. We follow Campbell & Lattanzio (2008) and refer generically to these events as ‘proton ingestion episodes’ or PIEs. We shall define two different kinds below. We note in passing that three-dimensional simulations show that turbulent entrainment of material could produce similar PIEs at higher metallicities (Mocák et al. 2008, 2009) although this is not found in simple one-dimensional models.
It was realised some time ago that PIEs may arise in the evolution of low-mass and low-metallicity stars (D’Antona & Mazzitelli 1982; Fujimoto et al. 1990; Hollowell et al. 1990; Cassisi, Castellani, & Tornambe 1996). Later work studied how such events depended on the numerical details (Schlattl et al. 2001) and the possibility of explaining some of the abundances seen in CEMP stars (Hollowell et al. 1990; Fujimoto, Ikeda, & Iben 2000; Chieffi et al. 2001; Schlattl et al. 2001, 2002; Picardi et al. 2004; Weiss et al. 2004; Suda et al. 2004; Lau, Stancliffe, & Tout 2009) including possible s-process nucleosynthesis (Goriely & Siess 2001).
A PIE is defined as any event that mixes protons into a very hot region, typically at temperatures where He burns, or is already burning. These naturally occur during a He flash which drives strong convection. They could be He-core flashes or even He-shell flashes on the AGB. When the H is exposed to very high temperatures it produces a secondary ‘H-flash’ and a PIE results in a ‘dual-flash’ event: a He-flash rapidly followed by the initiation of a H-flash. Although both are defined as PIEs, Campbell & Lattanzio (2008) distinguish between them according to whether the initiating He flash is a result of a core flash or an AGB shell flash: hence we have dual core flashes (DCFs) and dual shell flashes (DSFs).
Note that PIEs are also seen in the ‘late hot flasher’ scenario (Sweigart 1997; Brown et al. 2001; Cassisi et al. 2003) and the ‘born-again’ or ‘(very) late thermal pulse’ scenario for explaining objects like Sakurai's Object (Iben et al. 1983; Asplund et al. 1997; Herwig et al. 1999). We do not discuss these phenomena here, but we remind the reader that the essential physics is the same, involving dredge-up of CNO-processed material to the surface and even neutron captures, as we discuss below. For a comparison of nucleosynthesis predictions in very late thermal pulses and data from pre-solar grain analysis see Fujiya et al. (2013) and Jadhav et al. (2013).
The largest uncertainty with calculating the evolution during a PIE is how to handle the convective mixing. This must be done in a time-dependent way because the convective turnover timescale is close to the burning timescale for H at the high temperatures found during a PIE. Usually convective mixing is approximated by solving a diffusion equation, and usually in one dimension. Within this approximation the diffusion coefficient D is naively given by 1/3 v l where v is the velocity of the blob and l is its mean-free-path. These values are normally taken from the Mixing-Length Theory (MLT). The results are to be taken with all of the caveats that come with a literal interpretation of this phenomenological theory. Note that one of the assumptions of the MLT is that nuclear burning is negligible in the blob of gas, and this is clearly untrue in the present case.
Within the one-dimensional diffusive mixing approximation the protons are mixed down to a region where they burn fiercely and generate essentially as much energy as the He-burning reactions, which initiated the convection in the first place. This leads to a split in the convective zone: two separate convective burning shells develop, the inner one burning He and the outer burning H, with the two separated by an initially narrow radiative region. Clearly the details of this process will depend on how one calculates the burning and mixing, and that is essentially a three-dimensional process as we expect burning plumes to develop, rather than strict spherical symmetry. Fortunately, multi-dimensional hydrodynamical simulations have progressed to the stage where exploratory calculations are possible (to see simulations of normal shell flash convection see Herwig et al. 2006). We will discuss this further below in Section 3.8.4.
3.8.1. Overview of one-dimensional PIEs
Most calculations of PIEs have been done within the paradigm of one-dimensional models using the diffusion approximation for mixing (for some recent calculations see Campbell & Lattanzio 2008; Cristallo et al. 2009; Lau et al. 2009; Campbell et al. 2010; Suda & Fujimoto 2010). Following the PIE, dredge-up mixes the products of H and He burning to the stellar surface, and the surface layers of the models are dramatically enriched in 12C and 14N. One of the motivations for the study of such events initially was that they share some of the characteristics of CEMP stars (see references given above). Although there has been a reasonable number of calculations of such events, most authors have stopped their calculations after the PIE rather than go to the end of the star’s evolution. It is only if that is done that we can determine the yields for such stars (see Section 3.8.3). Until we have reliable calculations of PIEs, it will be hard to provide improved yields for stars undergoing PIEs.
Campbell & Lattanzio (2008) calculated the complete evolution for low and zero metallicity stars of low mass, through to the end of the AGB phase, so that they included the PIEs, third dredge-up, and HBB. They were able to delimit regions in mass and metallicity space where specific nucleosynthesis events dominates. For example, the DCF dominate the nucleosynthesis for M ≲ 1.5 M⊙ and [Fe/H] ≲ −5. For higher metallicities, in the same mass range, the DSF dominates. Increasing the mass allows for the TDU and HBB to become active, and dominate the production of elements. For [Fe/H] ≳ −4 (with a slight mass dependence) the DSF does not occur and normal AGB evolution results. The various regions are shown in Figure 32 taken from Campbell & Lattanzio (2008). Note that uncertainties in the location of convective borders, in particular, have a substantial effect on the borders of the various regimes shown in the figure. Nevertheless, the agreement with a similar plot in Fujimoto et al. (2000) is very good.
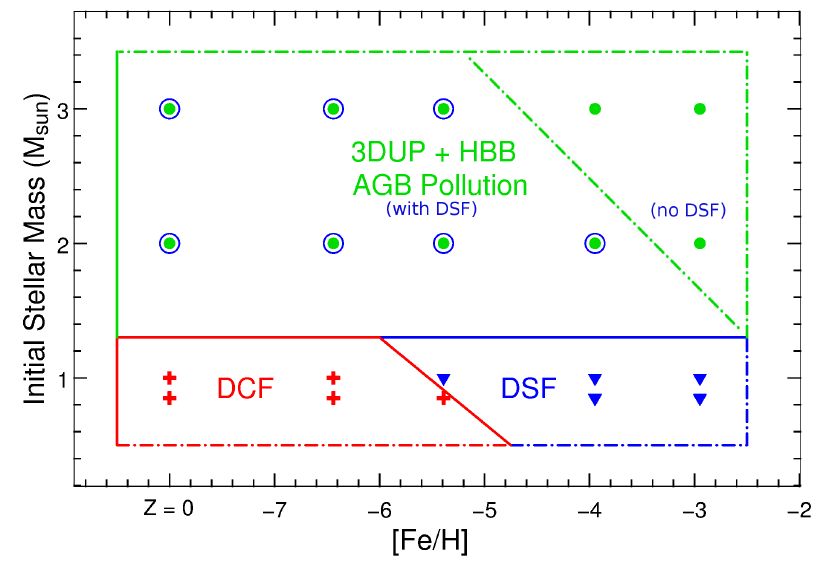 |
Figure 32. Models calculated by Campbell & Lattanzio (2008) in the [Fe/H]-mass plane. Red crosses represent models where the DCF dominates the nucleosynthesis. Filled blue triangles show where DSFs dominate. Open blue circles indicate models that experience DSFs, although they are not the dominant event for those models. Green filled circles are used where TDU and HBB on the AGB dominate the nucleosynthesis occurring. The models for Z = 0 are plotted at the position of [Fe/H] = -8. |
3.8.2. One-dimensional PIEs and the i-process
With protons and 12C in abundance one may expect neutrons to be present, provided by the 13C neutron source. This indeed is the case, with calculations showing a ‘neutron super-burst’ when convection engulfs the long H tail left behind by the H shell (Fujimoto et al. 2000; Iwamoto et al. 2004; Campbell et al. 2010). This tail is longer than normal because of the very low metallicity in these stars, which means that the pp chains (showing a relatively low temperature dependence) play a significant role in the H burning, and the shell is more extended than is the case when there are enough catalysts for efficient CNO cycling (which has a much higher temperature dependence). During the peak of the burst we find neutron densities as high as 1015 neutrons cm-3 (Cristallo et al. 2009; Campbell et al. 2010; Herwig et al. 2011).
Similar, but not identical, results were found by Cruz, Serenelli, & Weiss (2013) and Bertolli et al. (2013). The neutron densities are higher than expected for the s-process, but well short of what is needed for the r-process. These neutron exposure events have been called the i-process, for ‘intermediate’ neutron capture. These stars are of great interest to those trying to understand the CEMP-r/s stars, which show evidence of neutron capture nucleosynthesis that lies between the s- and r-process extremes (Lugaro, Campbell, & de Mink 2009; Lugaro et al. 2012; Bisterzo et al. 2012; Bertolli et al. 2013). The patterns predicted by the models do a reasonably good job of matching the observations, assuming that the observed CEMP-r/s stars result from mass transfer in a binary (with appropriate dilution). The fit is not perfect, however, with too much Ba (Campbell et al. 2010) and N (Cruz et al. 2013) produced to match HE1327-2326. Clearly the field is ripe for further study, but see caveats concerning one-dimensional models below. For a study of the (not insignificant) impact of nuclear uncertainties, see Bertolli et al. (2013).
3.8.3. Yields from one-dimensional PIEs
To the best of our knowledge, the only yields available at present for the complete evolution of low-mass stars, including PIEs and later AGB phases, are those given by Campbell & Lattanzio (2008) and Iwamoto (2009). One reason for the dearth of such calculations is the legitimate question over the validity of the one-dimensional and MLT approximations used in most calculations. Further there is the question of mass-loss rates for low metallicity stars, although this is mitigated somewhat by the fact that dredge-up events produce substantial contamination of the envelope during the star's evolution. We are only now beginning to develop hydrodynamical models that may be used for guidance in such cases.
3.8.4. Multi-dimensional PIE calculations
Since PIEs clearly challenge the assumptions used in most one-dimensional stellar models, they have been the subject of various multi-dimensional hydrodynamical calculations. Extra motivation for this is the work of Herwig (2001) who showed that he could match the observed evolutionary timescale of Sakurai's Object if the convective timescale during the PIE was about 30 to 100 times slower than predicted from the MLT.
The simulations performed with the Djehuty code by Stancliffe et al. (2011) found significant inhomogeneities in the mixing process (see also Herwig et al. 2011), with plumes of H mixed all the way down to the CO core where they burned rapidly. These calculations showed no sign of the split into two convective zones that is a universal feature of one-dimensional MLT calculations. Similarly, Mocák et al. (2010) found that a calculation that started with a split convective zone soon showed merging into one zone. The final word is yet to be spoken, but a significant step forward was made by Herwig et al. (2013). They found an initial period showing one deep convective region, but that this soon developed an entropy step that seems to divide two mixing zones within a single convective zone. The mixing between the zones seems to be inefficient but not negligible. Indeed, they may later separate, but we cannot be sure because the three-dimensional simulations covered only a relatively short simulation time of ~ 10 hours. It is noteworthy that Herwig et al. (2011) found that such a history of mixed regions was able to match the nucleosynthesis of Sakurai’s Object and that these new results are also in agreement with the convection constraints imposed by the evolutionary timescale of Sakurai's Object.
It is a common result from these hydrodynamical models that the radial velocities of the material are significantly higher than found in the MLT, by factors of 20 - 30. Whereas MLT predicts velocities of a few km s-1 the simulations show spherically averaged values of 10 - 20 km s-1 with individual plumes reaching even higher velocities at times (Stancliffe et al. 2011; Herwig et al. 2011). This seems to contradict the one-dimensional models of Herwig (2001) who could only match the observed evolutionary timescale of Sakurai's object by decreasing the MLT mixing efficiency by factors of 30 - 100. But this need not be the case. Reducing the convective efficiency places the H-burning closer to the surface, where the response time to thermal perturbations is shorter. This was found to occur in the simulations of Herwig et al. (2013), who found the position of the split in the convective zone matched the location found by the one-dimensional code using the reduced convective efficiency. Further, Herwig et al. (2011) showed that if there was a single mixed zone for the first ~ 900 minutes of the simulation, before the split into two zones occurs, then the simulation was able to match the observed abundances also.
In summary, it appears the PIEs are crucial events in the nucleosynthesis of low mass, low metallicity stars. They may be involved in explaining some of the observations of CEMP stars. However, we should have some serious concerns about the reliability of the one-dimensional models during this phase. Although the deviations in temperature from spherical symmetry are small (Stancliffe et al. 2011) there are substantial inhomogeneities in the composition in the mixed regions. The details of the PIE and how (and if) the resulting convective zone splits into two require much further work. Significant work has been done but we are only at the beginning, and are still restricted by numerical resolution. Indeed, to the best of our knowledge there is only one calculation that has shown convergence of results with increasing resolution (Woodward, Herwig, & Lin 2013), which is crucial for these studies. Most calculations are almost certainly limited by resolution in a way that has not been quantified. The fact that these numerical simulations can only cover a few hours of star time is another concern: we need to be confident that the behaviour seen is representative of the behaviour of the star over longer timescales. Much work remains to be done, but at least it has started.
3.9. Beyond the AGB: Super-AGB stars
Stars in a relatively narrow mass range will ignite C off-centre under degenerate conditions. These stars will experience thermal pulses on the ‘super-AGB’. The upper mass limit for this range is set by those stars that go on to burn Ne and heavier species, ending with an iron core and dying as a core-collapse supernova (these are the traditional ‘massive’ stars). In the nomenclature introduced in this paper the super-AGB stars are the middle intermediate and massive intermediate stars, as shown in Figure 1.
These stars are particularly difficult to calculate for many reasons, including high sensitivity to spatial and temporal resolution, a large number of thermal pulses (hundreds to thousands), and dramatically different final fates (electron-capture supernova or white dwarf) depending on the uncertain mass loss and its importance compared to core growth. The first studies of the evolution of super-AGB stars were by Garcia-Berro & Iben (1994), Ritossa et al. (1996), Garcia-Berro, Ritossa, & Iben (1997), Iben, Ritossa, & Garcia-Berro (1997), and Ritossa, García-Berro, & Iben (1999). These early calculations ignored mass loss and looked only at solar compositions, as is entirely appropriate for the first explorations. In the last decade researchers have extended the investigations to cover a wide range of metallicities, now that computers have enabled us to face the difficult computational task these stars present. There has been an increasing number of studies of super-AGB stars in recent years (Gil-Pons & García-Berro 2002; Gil-Pons et al. 2005; Gil-Pons, Gutiérrez, & García-Berro 2007; Siess 2007; Poelarends et al. 2008; Ventura & D’Antona 2009, 2010; Doherty et al. 2010; Ventura & D’Antona 2011; Ventura et al. 2011; Karakas et al. 2012; Herwig et al. 2012; Doherty et al. 2014a; Gil-Pons et al. 2013; Ventura et al. 2013; Jones et al. 2013; oherty et al. 2014b).
These calculations all agree qualitatively on the evolution of super-AGB stars, although there are substantial and important quantitative differences. The stars ignite C off-centre when the temperature reaches 600 - 650 MK, and develop a convective shell reaching outward from the ignition point. After this C burning dies down and contraction resumes, secondary convective zones develop and the C burning eventually reaches the centre where it ceases before consuming all of the C, leaving a mass fraction of C of around 1%. Carbon burning continues just outside the inner core generating more convective flashes when regions of high C content are traversed. At the completion of C burning we are left with an O-Ne core surrounded by an inactive C-O shell, as well as He- and H-burning shells and the large convective envelope.
Quantitative details are harder to agree upon. This is mostly due to uncertainties in how to treat convection and semiconvection, as much during the core He burning phase as during C burning. It is the size of the C-O core at the end of He burning that is the prime determinant of super-AGB evolution during C burning. For a comparison between different codes and the resulting differences in evolution, and critical mass boundaries (see Figure 1) we refer to Poelarends et al. (2008) and Doherty et al. (2010).
During, or soon after, core C burning (which need not go to completion) the star will experience second dredge-up. This relatively simple event is much more complicated in the case of super-AGB stars. Sometimes, usually in the more massive models, we find ‘corrosive’ SDU, where the convection extends inward of the He-burning shell with the result that it dredges C (and sometimes O) to the surface (Doherty et al. 2014a; Gil-Pons et al. 2013). Similarly we can find ‘dredge-out’ episodes, first encountered by Ritossa et al. (1996), where H diffuses into a He-burning convective zone. This mixes the H to extreme temperatures, resulting in a H flash. Thus these dredge-out events are another form of proton-ingestion episode (Campbell & Lattanzio 2008). As expected, the details of these events, and even their occurrence or not, depend on the previous evolution, especially the mass of the core, and how the borders of convection are treated.
Once the super-AGB stars settle on the TP-AGB their evolution is similar to other intermediate-mass AGB stars, showing recurring thermal pulses and HBB, with the usual associated nucleosynthesis. The differences here are that the thermal pulses are not very strong, reaching typically LHe ≃ 106L⊙ for models without much dredge-up (e.g., Siess 2007, 2010), compared with values more like 108L⊙ where there is deep dredge-up in lower mass C-O core AGB stars. These pulses have short duration, and the flash-driven convective pocket is only in existence for about 6 - 12 months. The pulses repeat every 100 years or so with the result that the expected number of pulses can be hundreds to thousands, depending on the uncertain mass-loss rate. For this reason most of the calculations to date do not cover the full evolution, but only a few pulses at the start of the TP-AGB. Detailed models of the full super-AGB evolution include Pumo, D’Antona, & Ventura (2008), Siess (2010), Karakas et al. (2012), Gil-Pons et al. (2013), Ventura et al. (2013), and Doherty et al. (2014a, 2014b).
Note that all authors find convergence difficulties near the end of the evolution of intermediate-mass AGB stars. Lau et al. (2012) attribute this to the opacity bump produced by Fe, which has also been noted in models of Wolf-Rayet stars by Petrovic, Pols, & Langer (2006) (but not, apparently, by Dray et al. 2003). The convergence problem is believed due to the disappearance of a hydrostatic solution for large core masses, when a region of super-Eddington luminosity develops (Wood & Faulkner 1986). Exactly how the star responds to this is uncertain. Lau et al. (2012) show that there is not enough energy available to eject the envelope so after some dynamical motion the envelope may again settle on the star and further evolution may occur. For this reason Doherty et al. (2014a) and Gil-Pons et al. (2013) provide yields for two cases: (a) assuming the envelope is ejected with the composition it had when the instability developed, and (b) assuming that pulses similar to the last few continue until the envelope is removed by the stellar wind. Reality is likely to lie somewhere between these two extremes.
One area that requires further study is the occurrence, or not, of third dredge-up in super-AGB stars. Siess (2010) and Ventura & D’Antona (2011) find no dredge-up in their detailed models, whereas Karakas et al. (2012), Doherty et al. (2014a), and Gil-Pons et al. (2013) do find reasonably efficient TDU. This is again a sensitive function of mixing details and how the numerical calculations are performed (Frost & Lattanzio 1996b). In any event, even if TDU is very efficient, as measured by the dredge-up parameter λ, it is unlikely to be very important for most species, because of the masses involved.
In a typical low to intermediate-mass AGB star the intershell region contains a mass within a factor of two of mis ≈ 0.01 M⊙ and the increase in core mass between thermal pulses is similar with ΔMc ≈ 0.01 M⊙. Compare these with typical values found for super-AGB stars, which are at least two orders of magnitude smaller: mis ≈ 10-4 M⊙, and ΔMc ≈ 10-4 − 10-5 M⊙. Hence dredging up such a small amount, albeit over many pulses, has only a small effect on surface abundances. The total amount dredged to the surface is usually less than ≈ 0.1 M⊙ (Doherty et al. 2014a). This has a negligible effect, especially when one considers that this material is diluted in a much larger envelope than is the case for lower mass AGB stars.
3.9.3. Super-AGB nucleosynthesis
The nucleosynthesis in super-AGB stars is again qualitatively similar to that in their lower mass AGB star siblings. Here the intershell is very hot, where temperatures can reach well above 400 MK, depending on the initial mass and metallicity. This results in substantial s-processing with α-captures on 22Ne providing the neutron source. If the TDU proceeds as in the models of Doherty et al. (2014a) then we expect this material to be mixed to the surface. The sizes of the regions involved, however, are small and from a chemical evolution viewpoint any species that is primarily produced by dredge-up is unlikely to be substantially produced by super-AGB stars. (Note that this is not true at very low metallicity, where the small amount of heavy elements added to the surface can be a significant perturbation on the original content.)
The other main nucleosynthesis pathway for AGB and super-AGB stars is HBB. Indeed, for super-AGB stars the temperature at the bottom of the convective envelope can exceed 100 MK which is high enough for substantial and extensive H burning. We expect CNO cycling, in near equilibrium conditions, as well as the more exotic Ne-Na and Mg-Al chains to be very active.
Detailed calculations by Siess (2010) conclude that these stars may produce significant amounts of 13C, 14N, 17O, 22Ne, 23Na, 25, 26Mg, 26Al, and 60Fe. These results were confirmed by Doherty et al. (2014a, 2014b), and Gil-Pons et al. (2013), who present yields for super-AGB stars (see also Ventura et al. 2013).
It is because of their strong HBB that these stars have been discussed frequently as being implicated in explaining the chemical compositions of globular clusters. There is an extensive literature on the problem (Cottrell & Da Costa 1981; Pumo et al. 2008; Ventura & D’Antona 2009, 2010; D’Ercole et al. 2010; D’Ercole, D’Antona, & Vesperini 2011; Ventura & D’Antona 2011; Ventura et al. 2011; D’Ercole et al. 2012; D’Antona et al. 2012; Ventura et al. 2012, 2013; Doherty et al. 2014b). Although super-AGB stars qualitatively have many of the required properties for the polluters of GCs, there are still substantial difficulties, and one has to tune many inputs to get models that are close to the observations. While super-AGB stars may be involved in the GC abundance problems, they are not apparently the magic bullet.
3.10. Final fates of AGB and super-AGB stars
The most massive AGB stars, the lower intermediate mass stars, will end their lives as C-O white dwarfs (Althaus et al. 2010). The super-AGB stars, however, produce a richer variety of remnants (e.g., Jones et al. 2013). At the lower mass limit of stars that ignite C, the ignition is in the outermost layers, and does not proceed to the centre. This leads to a class of hybrid white dwarfs that we refer to as CO(Ne)s. In these stars a C-O core is surrounded by a shell of 0.1-0.4 M⊙ that has seen C burning and is mostly O and Ne. We note that the 8 M⊙, Z = 0.02 model presented here is an example of a CO(Ne)-core model, and these are also found by other authors (Heger 2013, private communication; Ventura & D’Antona 2011; Denissenkov et al. 2013a). Stars with more massive cores will undergo off-centre Ne ignition with convective flashes (Ritossa et al. 1999; Eldridge & Tout 2004).
Following core He-exhaustion, most of the middle and massive intermediate-mass stars have core masses that exceed the Chandrasekhar mass, which we take to be MCh = 1.37 M⊙ as determined by Miyaji et al. (1980), Hillebrandt, Nomoto, & Wolff (1984), and Nomoto (1984). The core masses we find are typically 2 - 2.5 M⊙. Following the SDU (or dredge-out, if it occurs) the core mass is reduced to below the critical Chandrasekhar value. The final fate of these stars is crucially dependent on SDU and dredge-out, for if these do not reduce their core mass to below MCh then the star will continue on through the various nuclear burning stages and explode as an iron core-collapse supernova; i.e., as a true massive star. If the core mass is reduced sufficiently by SDU or dredge-out then the fate depends on the competition between core growth and mass loss. If the former dominates and the core reaches MCh then an electron-capture supernova will result. If mass loss keeps the mass below the critical value then the star ends as an O-Ne WD.
The existence of massive WDs in the Galaxy with oxygen-rich atmospheres (Gänsicke et al. 2010) lends credence to the idea that at least some of the super-AGB stars avoid core-collapse supernova explosions. Furthermore, there is evidence that some classical novae explode in a binary where the compact companion is an O-Ne WD (e.g., Jose & Hernanz 1998; Denissenkov et al. 2013b).
Figure 33 is taken from Doherty et al. (in preparation) and shows the predicted fate for models in the AGB and super-AGB mass range. We note that these results are in reasonably good agreement with other authors (Siess 2007; Poelarends et al. 2008) given the sensitivity inherent in the calculations. We find the electron-capture supernovae comprise just a few percent of all supernovae in the metallicity range Z = 0.02 to 10-4.
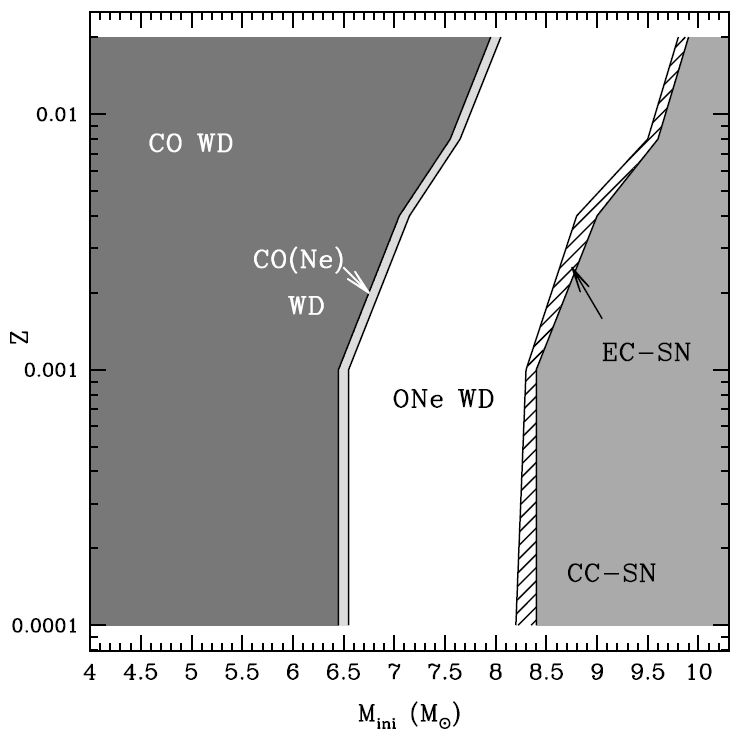 |
Figure 33. Predicted final fates for the super-AGB mass range, as a function of metallicity Z. CC-SN refers to core collapse supernovae and EC-SN refers to electron capture supernovae. The regions of C-O, CO(Ne) and O-Ne white dwarfs are also indicated. See text for details. |
4 MESA stands for ‘Modules for Experiments in Stellar Astrophysics’: http://mesa.sourceforge.net/. Back.