


On small scales, intrinsic alignments are expected to be intimately connected to the environment of the galaxy, in terms of the morphology of the local cosmic web. Details of the galaxy's evolution, including feedback processes, mergers etc. may also be expected to play a role. In contrast it is believed that the mechanisms that give rise to alignments which persist in pairwise correlations of galaxies on large scales can be related to the large-scale gravitational tidal field. Examples of such mechanisms are introduced in Joachimi et al. 2015 and discussed in more technical detail in Kiessling et al. (2015), but many open questions about galaxy alignments including their amplitude, dependence on galaxy type and luminosity and their evolution with redshift, have no obvious analytic answer. Precise and accurate observations are therefore critical.
To understand alignments on small scales we need to consider the dependence on the environment of the galaxies under consideration, which we do in the next section. In this section we start by reviewing the observational status of alignments from the linear regime (> 10 Mpc / h) into the quasi-linear regime (∼ 5−10 Mpc / h). On these scales the matter power spectrum of density fluctuations is fairly well understood from linear theory and largely unaffected by baryonic physics (e.g. Semboloni et al., 2011). Furthermore, the measurements are based on datasets and methods that are similar to those used for cosmic shear studies.
The first large scale study of intrinsic alignments in the cosmic shear era was Brown et al. (2002). This paper used 2 × 10⁶ galaxies from the SuperCOSMOS sky survey (Hambly et al., 2001) with a median redshift of z ∼ 0.1. An observed excess correlation above that expected from cosmic shear was seen as evidence of intrinsic alignments. The observed amplitude was subsequently used widely to normalise intrinsic alignment models at low redshift to the value C1 = 5 × 10⁻¹⁴(h2 M⊙ Mpc−3)−1 (Bridle & King, 2007). The Brown et al. (2002) observations immediately required several popular IA models (Heavens et al., 2000, Croft & Metzler, 2000, Catelan et al., 2001) to be revised downwards in amplitude as they had over-predicted the SuperCOSMOS signal. Brown et al. (2002) also offered the first observation-based assessment of the likely impact for cosmic shear measurements, see Section 6 for more discussion.
In the following we split the results by galaxy type because the leading theories predict that different processes dominate for late- and early-types (see Kiessling et al. 2015). For example, the linear alignment model for dispersion-dominated galaxies (Hirata & Seljak, 2004) and tidal torque theory for angular momentum-dominated galaxies (Peebles, 1969, Doroshkevich, 1970, White, 1984) motivate a split into early- and late-type galaxies. We therefore review results for late-type galaxies in Section 4.1 and for early-type galaxies in Section 4.2. Alternatively, the samples are split by rest-frame colour or spectral energy distribution. Although we note that a split into blue and red galaxies is not exactly the same as a morphological selection, we consider this implicitly to be the case when reviewing the different galaxy samples. Finally, in Section 4.3, we review indirect methods of measuring intrinsic alignments for both early- and late-type galaxies.
The most commonly accepted scenario for the alignments of disc galaxies is the quadratic alignment model, which describes how the angular momentum of dark matter haloes is spun up to produce correlations between the orientations of galaxies (Hirata & Seljak, 2004). Disc-galaxies are believed to be nearly circular when viewed face-on, they appear elliptical as a result of projection due to their orientation with respect to the observer. Total observed ellipticity is the sum of this projection effect and any small intrinsic ellipticity the galaxy may have. If the orientation of the disc is determined by the spin vector of the galaxy, and these are correlated between galaxies, then there will be a correlation between the observed intrinsic ellipticities. These can be observed by simply measuring the correlations in measured shapes (Hirata et al., 2007, Mandelbaum et al., 2011). Before reviewing these results, we note that this paradigm gives us another avenue to study intrinsic alignments of disc galaxies: we can measure the correlation of galaxy spins. Note that the quadratic alignment model is so-called because the II three-dimensional power spectrum depends on the square of the linear matter power spectrum and therefore the alignment signal is expected to be suppressed compared to the linear alignment model which is believed to apply to early-type galaxies and has a linear dependence on the matter power spectrum.
Slosar et al. (2009) presented an early example of such a measurement using data from the Galaxy Zoo citizen science project 1. In Galaxy Zoo, spiral galaxies are classified as clockwise, anti-clockwise or edge-on. For each face-on galaxy there is therefore one bit of information corresponding to the sign of the galaxy spin vector projected along the line-of-sight. This information enabled the measurement of the correlation function of spin chirality of face-on spirals. The authors tentatively reported that galaxy spin directions are correlated at very small scales (< 0.5 Mpc), albeit with low significance (2 − 3σ). There is no obvious reason, under the tidal torquing model, why this chiral correlation should exist. If confirmed to high significance in future studies, it might provide useful insight into the sourcing of galaxy angular momentum.
Going beyond correlations in spin chirality (clockwise vs. anticlockwise), Cervantes-Sodi et al. (2010) searched for correlations between the orientations of the spin vectors themselves in pairs of spiral galaxies from the SDSS survey. They computed correlations in the spin parameter, λ (Peebles, 1969):
 |
(29) |
where G, E, M and J are Newton's constant, the total energy, mass and angular momentum of the configuration, respectively. λ accounts for the magnitude of the spin, while the position angle was used as an estimate of direction.
Cervantes-Sodi et al. (2010) reported a weak (1.5σ) correlation between the spin magnitude of neighbouring galaxies, but, contrary to Slosar et al. (2009), no clear alignment between their orientation. The authors suggested that this is due to some late-time dilution of a primordial correlation laid down at the time of galaxy formation. They suggest that interactions with close neighbours can significantly redistribute angular momentum through clumpy and irregular mass accretion, reducing the value of λ.
Lee (2011) presented another measurement of intrinsic alignments using spin statistics. This paper used large (angular size ≥ 7.92 arcsec) late-type spiral galaxies from the SDSS DR7 over 0 ≤ z ≤ 0.02. The SDSS observations provide information on the galaxy's axial ratio, q, and position angle, ϑP, from which the unit spin vector for each galaxy is reconstructed. These spin vectors are combined to form the two-point spatial correlation function for galaxy spin axes. For this sample a positive spatial correlation is detected at 3.4σ (separation r ≲ 1 Mpc / h) and 2.4σ (separation r ≲ 2 Mpc / h). The correlations are stronger for galaxies located in dense regions, which have more than 10 neighbours within 2 Mpc / h. The measured correlations are consistent with the predictions of the quadratic alignment model that the spin two-point correlation should follow a quadratic scaling with the linear density correlations. We note that the estimation of the spin vector relies on the assumption that galaxies form thin discs. If this is not the case across the galaxy sample, this assumption can introduce a systematic error of order 10% in the measured spin correlation (Lee & Erdogdu, 2007, Lee, 2011).
Andrae & Jahnke (2011) also used SDSS data to analyse angular momentum correlations of disc galaxies. They found that positive correlations of spiral-arm handedness and angular momentum orientations on distance scales of 1 Mpc/h are plausible but not statistically significant. Furthermore, they suggested that previous studies such as the ones presented by Slosar et al. (2009) and Lee (2011) overestimated the correlation of spins for spiral galaxies because of bias in ellipticity estimates based on second moments due to galactic bulges. This highlights the importance of how orientations are determined.
Thanks to large imaging surveys, pre-eminently the SDSS, much progress has been made over the last decade in the correlation of galaxy ellipticities. The first to take advantage of SDSS, in the context of late-type galaxies, is the study by Hirata et al. (2007) who attempted to measure intrinsic alignments for a low-redshift sample of blue galaxies, selected from the SDSS main spectroscopic redshift sample. This is a flux-limited sample primarily covering the range 0.05 < z < 0.2. Hirata et al. (2007) split a colour-selected blue subset of this flux-limited sample into four luminosity bins for analysis, but detected no significant signal in any of those bins (Hirata et al. (2007) did make a positive detection for intrinsic alignments in SDSS red galaxies). While this null result for blue galaxies can be interpreted as beneficial for cosmic shear studies, the statistical uncertainties are relatively large due to the small number of blue galaxies in the high luminosity bins. Furthermore, given the low redshift of the sample, applying the results to cosmic shear surveys, which target galaxies at much higher redshifts, requires a large extrapolation. This motivated attempts to repeat a similar measurement at higher redshifts.
Such a sample was provided by the overlap of the SDSS imaging and the WiggleZ redshift survey (Drinkwater et al., 2010), which targeted a population of blue galaxies, whose mean redshift was zmean ∼ 0.6, with a primary science goal of measuring Baryon Acoustic Oscillations (BAO) Mandelbaum et al., (2011) measured the intrinsic alignments of the subset of galaxies for which ellipticities were determined from the SDSS. The full WiggleZ sample was used to trace the density field, assuming a linear galaxy bias. While previous papers, notably Hirata et al. (2007), had measured intrinsic alignments for blue galaxies at low redshifts, this was the first paper to push the measurements to intermediate redshifts.
Figure 3 shows the resulting measurements from Mandelbaum et al. (2011) for wg+ and w++ as a function of transverse separation for the WiggleZ dataset, split into two redshift bins. The correlation functions are consistent with zero within the statistical uncertainties, which are relatively large. By combining with the results for some lower-redshift blue galaxy samples from SDSS that were previously presented in Mandelbaum et al., (2006a), the null detection was used to place upper limits on how blue galaxy intrinsic alignments could contaminate weak lensing measurements from a CFHTLenS-like survey, with the result being a bias in the amplitude of the (linear) power spectrum on the scale of 8 Mpc/h, σ8, of −0.03+0.02 at the 95% confidence level. See sec:impact for more details on how intrinsic alignments impact estimates of cosmological parameters from cosmic shear.
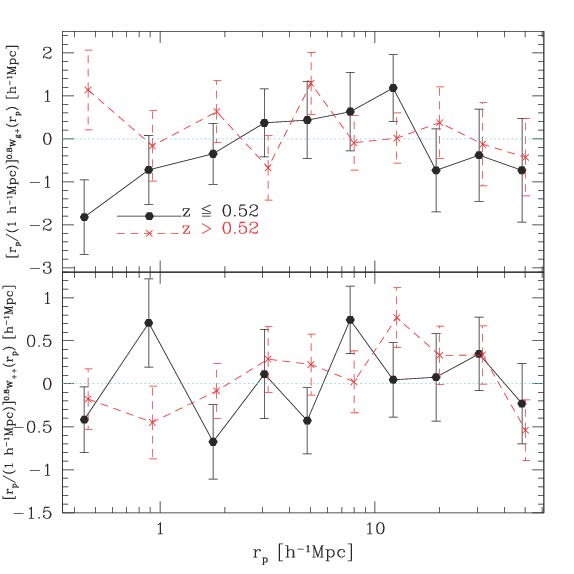 |
Figure 3. Top panel: Projected GI cross-correlation signal wg+(rp), multiplied by rp0.8, from the WiggleZ data of Mandelbaum et al. (2011). Results are shown averaged over all WiggleZ regions, for the two redshift subsamples. Points at a given value of rp are slightly horizontally offset for clarity. Bottom panel: Same as the top, but for the II cross-correlation signal w++(rp). Reproduced with permission from Mandelbaum et al. (2011). |
Mandelbaum et al. (2011) also placed constraints on the redshift evolution of blue galaxy intrinsic alignments, taking advantage of the broad redshift range of the WiggleZ sample. The full sample was split into two redshift slices containing galaxies below and above z = 0.52. Mandelbaum et al. (2011) fit two simple models to their intrinsic alignment measurements: a power-law in transverse separation and the non-linear alignment (non-linear alignment) model with an additional free power-law dependence on redshift (Bridle & King, 2007). The non-linear alignment model is simply the linear alignment model of Hirata & Seljak (2004) with the non-linear three-dimensional matter power spectrum substituted in place of the linear matter power spectrum. There is no theoretical justification for this model but, as we shall see, it fits the data better than the linear alignment model (see Section 3.3 of Kiessling et al. 2015 for more details on the non-linear alignment model). The power-law in redshift takes the form given by Equation (28) with the free parameter ηother and a pivot redshift of zp = 0.3. Constraints on the amplitude of the power law are shown in Figure 4. They are consistent with zero for all samples from both wg+ and w++. This tells us that there is no evidence for evolution of the intrinsic alignment signal with redshift.
 |
Figure 4. Constraints on the power-law amplitude A as a function of redshift from the WiggleZ data of Mandelbaum et al. (2011). This analysis used line-of-sight range, Πmax = 60 Mpc / h, and fixed the power-law slope at α = 0.88. Upper panel: Constraints from wg+. Lower panel: Constraints from w++. From left to right, the points show constraints from SDSS Main Blue L4 (green cross); WiggleZ z < 0.52 (blue triangle); and WiggleZ z > 0.52 (red triangle). The horizontal lines indicate the redshift range of the observations. The shaded pink rectangle indicates the constraint from the full WiggleZ sample (both redshift ranges). Reproduced with permission from Mandelbaum et al. (2011). |
Note that the most likely sign of contributions of both PSF systematics and intrinsic alignments to w++ is positive, so the null detection itself indicates that there are no substantial observational systematics contaminating the measurement. The primary uncertainty in the application of these upper limits to future surveys is that the sample does not correspond to the entire blue cloud (Kauffmann et al., 2003, Wyder et al., 2007), but rather to a specific subset of it that appears to consist of morphologically disturbed starburst galaxies. The signal might therefore be compromised by recent mergers and other environmental effects that apply to the galaxies selected by WiggleZ, but which do not apply to the general population of late-type galaxies.
Much more observational progress is needed before models of intrinsic alignments for late-type galaxies can be confronted with precise observational constraints. Current constraints come from spectroscopic studies, which mostly target the bright early-type galaxies we will discuss next. Unfortunately photometric redshifts are typically the least reliable for late-type galaxies as well, as their 4000 ∘ / A break is less pronounced. However, the situation may improve thanks to new surveys that aim to cover a significant wavelength range with a large number of narrow-band filters (Martí et al., 2014).
Compared to the null-detections for late-type galaxies, the situation is markedly different for early-type galaxies. Luminous Red Galaxies (LRGs) make easier targets for BAO surveys. Thanks to their red colours, indicative of old stellar populations, they are readily identified out to high redshifts. Secondly, they are pressure-supported systems (rather than rotationally-supported), and this lack of angular momentum has led to the view that their alignments are described by the linear alignment model (see Section 3 of Kiessling et al. 2015). Therefore the signal is expected to be larger than that of disc galaxies, which is indeed the case, as shown already by Hirata et al. (2007).
 |
Figure 5. Posterior probabilities from the joint fit to the MegaZ-LRG and SDSS spectroscopic samples from Joachimi et al. (2011). Fits are shown for the amplitude A of the intrinsic alignment model (which is the same as the Ai we use throughout this paper), the extra redshift dependence with power-law index ηother and the index β of the luminosity dependence, as in Equation (28). Lower left triangle of panels: The two-dimensional 1σ and 2σ confidence contours, marginalised in each case over the parameter not shown with flat priors in the range A ∈ [0; 20], ηother ∈ [−10 : 10], and β ∈ [−5; 5]. Upper right diagonal panels: Posterior probabilities for A, ηother, and β, each marginalised over the two remaining parameters. The different coloured lines result from using different samples in the fitting process (see legend for details). Reproduced with permission from Joachimi et al. (2011) © ESO. |
Joachimi et al. (2011) studied intrinsic alignments in LRGs from the SDSS MegaZ-LRG dataset. Compared to the other studies discussed in this section, Joachimi et al. (2011) studied galaxies at higher redshifts (closer to the typical redshifts of cosmic shear surveys) and were the first to measure large-scale intrinsic alignments in a dataset with photometric redshifts (see Csabai et al. 2003 for a seminal example of the use of photometry for redshifts). The MegaZ-LRG sample used in Joachimi et al. (2011) contained more than 800,000 LRGs up to z ∼ 0.7. Compared to spectroscopic redshifts, the advantage of photometric redshifts is that these are cheaper to obtain for large samples, albeit at the expense of redshift precision. Consequently, it is necessary to explicitly model out the gravitational lensing “contamination” due to the intrinsic alignment signal. For more discussion of the use of photometric redshifts, see Section 3.3.
Joachimi et al. (2011) measured wg+ and used the results for rp > 6 Mpc/h to place constraints on non-linear alignment model parameters (see Figure 5) by combining this sample with those used by Hirata et al. (2007). Power-laws with an extra free parameter each were introduced to allow for redshift and luminosity dependence, just as in Equation (28). The normalisation of the intrinsic alignment model was found to be Ai = (0.077 ± 0.008)ρcrit−1 (where ρcrit is the critical density) for galaxies at z = 0.3 and evolution-corrected r-band absolute magnitude of -22. This result is consistent with the value of Ai = (0.066± 0.008)ρcrit−1 found by the more recent study by Singh et al. (2014), which we discuss below.
To study deviations from the redshift dependence of the signal predicted by the non-linear alignment model, Joachimi et al., (2011) used several samples at a range of redshifts from z ∼ 0.1 to z ∼ 0.55 and found ηother = −0.3 ± 0.8. Luminosity-dependence was analysed through fits to different luminosity subsamples. The L3 and L4 SDSS samples are defined with absolute magnitude cuts of −20 ≤ Mr + 5 log10h < −19 and −21 ≤ Mr + 5 log10 h < −20 respectively and colour cuts detailed in Joachimi et al., (2011). L3 contains 66,312 galaxies, with a mean redshift of ⟨ z ⟩ = 0.07, L4 contains 118,618 galaxies, with a mean redshift of ⟨ z ⟩ = 0.11. The power-law slope of the dependence of the alignment signal with galaxy luminosity was constrained to be β = 1.1−0.2+0.3, also in agreement with the value of 1.3± 0.27 obtained by Singh et al. (2014).
Singh et al. (2014) have presented the most comprehensive study of large-scale intrinsic alignments in early-type galaxies to date. They studied the intrinsic alignments of the low-redshift LRG sample in the Baryon Oscillation Spectroscopic Survey (BOSS) survey, called LOWZ, using data from DR11 (Dawson et al., 2013, Alam et al., 2015). Unlike the original SDSS-I/II LRG sample studied in early works by Hirata et al., (2007) and Joachimi et al., (2011), this sample goes to lower luminosity, with a comoving number density that is three times as high as the earlier sample within the same redshift range (0.16 < z < 0.36). The sample used by Singh et al. (2014) to trace the density field contains 173,855 galaxies, of which 159,621 have good shape measurements, and are further divided into subsamples based on colour, luminosity, and environment.
Singh et al. (2014) measured the wg+ signal from the cross-correlation of the shape and density samples and modelled the signal using the non-linear alignment model for rp > 6 Mpc / h and with a fitting formula for the halo model from Schneider & Bridle, (2010) on small scales (rp < 1.5 Mpc / h). This provided a set of large-scale and small-scale intrinsic alignment amplitudes that were studied as a function of sample properties.
The measurements of wg+ for the full sample agree well with the linear alignment model at scales larger than ∼ 10 Mpc / h, as shown in Figure 6. Below this scale, the non-linear alignment model provides a good fit to the data above 1 Mpc / h (though there is a notable dip in the measured signal at ∼ 2 Mpc / h). Note that the non-linear alignment model includes an optional smoothing scale, and the selection of this scale can, in principle, affect the match at small scales. Below ∼ 1 Mpc / h they apply two versions of the intrinsic alignment halo model. An implementation of the fitting formula and parameter values from Schneider & Bridle (2010) (dotted blue line) does not fit the data well. However, when some of the fitting function parameters are modified to better suit the SDSS LOWZ sample used in this work (dotted purple line), the halo model is shown to fit the data well on the smallest scales, from 0.3 −1 Mpc / h. The vertical black line at 0.3 Mpc / h shows the SDSS fibre collision scale, below which the difficulty of placing optical fibres in close proximity makes measuring clustering statistics difficult. Fitting the non-linear alignment model to scales larger than 6 Mpc / h yields an intrinsic alignment amplitude Ai = 4.6 ± 0.5 (with the galaxy clustering suggesting an average linear galaxy bias of bg = 1.77 ± 0.04). It is interesting to note that the best fit to the data appears to be the non-linear alignment model at large and intermediate scales combined with the halo model at small scales. There is no physical motivation for this combination (compared to the linear alignment+halo model) but it suggests that more modelling and simulations work needs to be done to understand behaviour at intermediate scales, 2 < rp < 10 Mpc / h. Recent work in this direction has been done by Blazek et al. (2015) which presents all relevant non-linear corrections at one-loop order, under the tidal alignment paradigm.
 |
Figure 6. The density-shape correlation function, wg+ for the SDSS-III BOSS LOWZ sample used in Singh et al. (2014). The data used covers the redshift range 0.16 < z < 0.36. The red points are the measurements from the data, the dashed green lines are the non-linear alignment model, and the dashed blue lines are the linear alignment model. The non-linear alignment model is fitted only in the range 6 Mpc / h < rp < 65 Mpc/h (shown by dashed vertical lines), while the linear alignment model is shown with the same parameters as the non-linear alignment model. The dotted purple and blue lines show halo model fits to wg+ at small scales, see text for more details. The black solid line shows the SDSS fibre collision scale at z = 0.36. Reproduced with permission from Singh et al. (2014). |
Singh et al. (2014) also presented results which explore intrinsic alignments as a function of galaxy properties and galaxy environment. As mentioned earlier, the luminosity-dependence of large-scale intrinsic alignments for this sample is consistent with the results from previous work (Joachimi et al., 2011), but with smaller statistical uncertainties. No variation of the intrinsic alignment amplitudes with redshift was found, though given the narrow range of redshift for this sample, the ability to study redshift evolution is quite limited. Importantly, the amplitude of the signal did not depend on the colour of the red-sequence galaxies, which supports the tendency in the literature to predict intrinsic alignments for future surveys using a single estimate for intrinsic alignments for all red-sequence galaxies regardless of their exact colour.
In terms of environmental dependence, using dark matter haloes identified with multiple LRGs and dividing the galaxies into centrals (i.e. Brightest Group Galaxies; BGGs), satellites, and field galaxies, Singh et al. (2014) found that satellite galaxies exhibit no detectable large-scale intrinsic alignments, but the radial alignments of the satellite galaxy semi-major axes towards the centres of their host haloes are detected at high significance. Central galaxies show both small- and large-scale intrinsic alignments, with a higher strength than for field galaxies, consistent with their host halo masses and luminosities being larger. See Kiessling et al. 2015 for more discussion on the use of dark matter haloes to model intrinsic alignments and theur identification in simulations.
Singh et al. (2014) detail a number of scaling relations for intrinsic alignments with respect to luminosity, dark matter halo mass and galaxy bias, shown in Figure 7. A key finding of Singh et al. (2014) is that dark matter halo mass and galaxy luminosity seem to be equally good (low scatter) predictors of the large-scale intrinsic alignment amplitude (Ai, the non-linear alignment model amplitude) for a given shape sample, whereas the linear bias does not do as well, having a large scatter with respect to intrinsic alignment amplitude. In contrast, the lowest scatter predictor of the small-scale intrinsic alignment amplitude (a h, the halo model amplitude) for a given shape sample, is the linear bias. However, the small-scale amplitude has a non-trivial dependence on the choice of density tracer sample. See Figure 7 for a summary of the results of Singh et al. (2014) in terms of intrinsic alignment amplitudes and galaxy bias as a function of different galaxy properties (of the shape samples). The intrinsic alignment amplitude, Ai, shows a clear dependence on luminosity, galaxy mass and bias but little change with redshift. Small-scale wg+ is fit with a halo model prescription characterised by an amplitude ah and the bias of the galaxy sample bs.
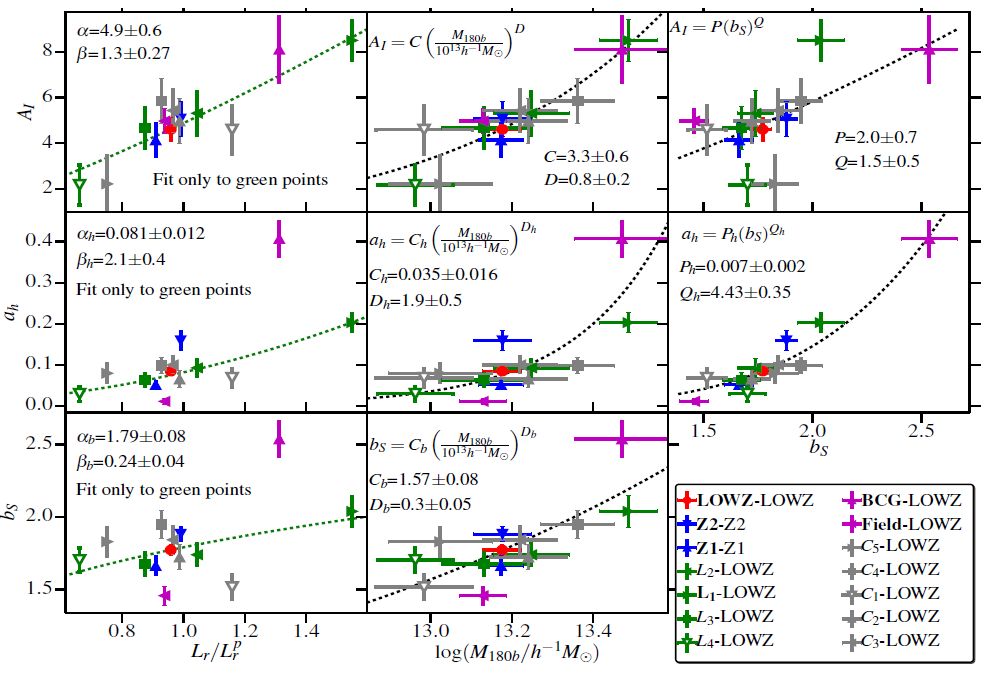 |
Figure 7. Intrinsic alignment amplitudes and bias from the SDSS-III BOSS LOWZ data of Singh et al. (2014). Results are shown for various shape samples, as a function of different galaxy properties of the shape sample. Z1 refers to 0.16 < z < 0.26 and Z2 to 0.26 < z < 0.36. Note that the full LOWZ sample was used as the density sample, except in the cases of Z1 and Z2 where these redshift subsets are used instead. L1 contains the brightest 20% of galaxies, L2 the next brightest 20%, L3 the next brightest 20% and L4 the faintest 40%. The bins C1-C5 split the sample by colour. Each C-bin contains 20% of the total sample from bluest (C1) to reddest (C5). The top row shows Ai as a function of different properties of shape sample. Ai shows clear evolution with luminosity (Lr) as well as mass, where M180b is the halo mass from weak lensing, and bias, bS, with negligible evolution in redshift. The green dotted line in Ai vs. Lr shows a power-law fit to the luminosity samples (green points). Similarly in Ai vs log(M180b / h−1 M⊙), the black dotted line is the power-law fit, using all the points. The middle row shows the halo model amplitude, ah as a function of different galaxy properties. For cases where the density sample is fixed to LOWZ, the effects of the non-linear bias of the density sample is the same. The black dotted line in ah vs Mr is the power-law fit to the luminosity samples (green points), and the dotted line in ah vs bS is the power-law fit using all the points. Remember that the galaxy properties shown on the x-axis are correlated, for example, more luminous galaxies also have higher bias and live in more massive haloes. Reproduced with permission from Singh et al. (2014). |
Comparison with other papers on intrinsic alignments in SDSS reveals a possible dependence of the measured intrinsic alignment signal on the way that the galaxy shape is estimated. Okumura et al. (2009) measured large-scale intrinsic alignments of 83,773 LRGs from the SDSS DR6. Interpretation of this data by Blazek et al., (2011) in terms of the non-linear alignment model reveal a systematically higher amplitude compared to measurements for comparable samples in Hirata et al., (2007) and Joachimi et al., (2011). One key difference is that the measurements of Okumura et al. (2009) use an estimate of the shape based on a low surface brightness isophote, instead of using centrally-weighted PSF-corrected shapes used in Hirata et al., (2007) and Joachimi et al., (2011). Hao et al., (2011) found signatures of systematics in the alignments of galaxies when measured using isophotal shapes which could be the cause of the extra signal for galaxies in clusters. However, it is not implausible that the outer isophotes of galaxies truly are more strongly aligned with large-scale structure, which could mean that the higher alignment amplitude results from a real physical effect. A direct comparison of measurements using the exact same methodology and intrinsic alignment estimator, but different ellipticity estimates, would be necessary to fully understand this discrepancy.
One interesting aspect of the interpretation of the results in Okumura et al. (2009) is that instead of directly comparing the data to an analytic model such as the linear alignment model, they compared with predictions for dark matter halo alignments from N-body simulations, and used the lower signal in the data to infer a typical stochastic misalignment between halo and galaxy position angles of σθ = 35.4 −3.3+4.0 degrees. The authors thus concluded that central LRGs are preferentially but not perfectly aligned with their parent haloes, since perfect alignment would produce an intrinsic correlation signal four times higher than what is measured.
Blazek et al. (2011) used the measurements of Okumura et al. (2009) to calculate the wg+ statistic and the intrinsic alignment auto-correlation functions, w++, using LRGs from SDSS DR6 and the New York University value added catalogue (Blanton et al., 2005). The paper is worth noting here because the authors also went beyond the wg+,w++ approach by making calculating the correlation functions of curl-free E-modes and divergence-free B-modes for intrinsic alignments (see Section 3.1 for a description of these observables). In addition they presented a different statistic, first introduced by Faltenbacher et al. (2009), called the alignment correlation function, wgg(rp, θp), which describes the dependence of clustering on both projected separation, rp, and the galaxy orientation angle, θp, that is the angle between the major axis of a galaxy and the axis of separation. When comparing their measured statistics wg+ and w++ with the linear alignment model, they found both fit well at large transverse scales (above 10 Mpc/h). From their fit to wg+ they found a best-fit amplitude of C1ρcrit ≈ 0.13 ± 0.02, consistent with the result of Joachimi et al. (2011). They found E-modes largely in agreement with theory and B-modes consistent with zero above 10 Mpc/h. Below this scale other alignment processes are expected to generate B-modes.
At linear order the tidal alignment model predicts that the angular dependence of wgg(rp, θp) is wgg(rp)cos(2θp). Blazek et al. (2011) demonstrated that the alignment correlation function, wgg(rp, θp), was thus completely described by wgg(rp) and wg+(rp). Nevertheless it is useful to measure wgg(rp, θp) and compare to predictions of the linear alignment model as a check on observations of wg+(rp). Blazek et al. (2011) found that wgg(rp, θp) increases with luminosity, in agreement with Joachimi et al. (2011) and Singh et al. (2014). The authors hazarded an explanation for the trend of increased alignment with luminosity, namely that “more luminous objects have formed more recently and have had less time to misalign from the tidal axis along which they formed.” More detailed interpretation of these trends can be found in Kiessling et al. (2015).
4.3. Other Large-Scale Measurements
We have so far considered direct measurements of the ellipticity correlation of both late- and early-type galaxies at large scales, as well as observations of the correlation of disc galaxy spin vectors and the correlation of major axis with separation vector. Other papers have studied large-scale shape correlations using more indirect methods.
Instead of using a dataset to directly measure the alignment of shapes with the galaxy distribution, or with each other, it is possible to learn about intrinsic alignments through the simultaneous modelling of lensing and intrinsic alignments. In these cases the intrinsic alignment signal is sometimes seen as a “contaminant” of the cosmic shear signal. This contamination must be characterised to avoid bias, which can provide information about the intrinsic alignments themselves.
This was done by Blazek et al., (2012) when they presented a formalism for simultaneous modelling of cosmic shear and intrinsic alignments in the context of galaxy-galaxy lensing, where background sources are lensed by specific massive foreground structures associated with galaxies. When using photometric redshifts, as they did in this paper, it is not possible to perfectly separate the foreground and background populations, hence there will be some intrinsic alignment signal sourced by physically close galaxies. The authors exploited this property to measure intrinsic alignments by removing the galaxy-galaxy lensing contaminant. While this issue was addressed to some extent by Joachimi et al., (2011), who used data with high quality photometric redshifts for which the lensing contamination was present at the ∼ 10% level, in Blazek et al. (2012) the formalism was designed to accommodate the case where the photometric redshifts are of more typical quality and therefore the weak lensing contamination is the dominant component of the radial alignment signal, even for sets of galaxies chosen so that they are supposed to be near the lenses in redshift space. Blazek et al., (2012) produced a null detection, interpreted as meaning that the intrinsic alignment contamination of the galaxy-galaxy lensing signal is limited to be <10% for 0.1 ≤ rp ≤ 10 Mpc / h. Under the assumption that the non-linear alignment model is valid at describing the radial dependence of density-shape alignments of these source galaxies, the constraints become considerably tighter, with the contamination expected to be < 1 – 2% on those scales.
Chisari et al., (2014) also used this new formalism, extended to allow for full photometric redshift probability distributions, p(z), to place constraints on intrinsic alignments of a deeper sample of source galaxies in the SDSS stripe 82 region (using coadds from Huff et al., 2011 and coadd photometry from Annis et al., 2014). They used galaxy clusters as density tracers and measured the tangential shears of sources around and behind those clusters to compute the lensing contamination to the intrinsic alignments signal. Using the non-linear alignment model to define the scaling of intrinsic alignments with transverse separation, Chisari et al., (2014) constrained the contamination fraction for a galaxy-galaxy lensing measurement to lie between −18% and +23% (95% confidence level), using this cluster sample and source sample below 1 Mpc/h, more discussion of this paper is given when environment-dependent observations are covered in Section 5.
A more truly “indirect” measurement was made by Heymans et al. (2013). Here the goal was to measure the weak gravitational lensing cosmic shear signal. To this end the expected intrinsic alignment contribution was modelled out before any cosmological inferences were made. In this approach the amplitude of the alignment signal was a free parameter, included as part of the model that was compared to the data. The authors thus marginalised over intrinsic alignment contamination as part of a tomographic cosmic shear analysis using six redshift bins.
Heymans et al. (2013) used the non-linear alignment model with a single free parameter, Ai, parameterising both the II and GI amplitudes, citing the null result of Mandelbaum et al. (2011) for late-type galaxies as justification for using this relatively inflexible (one free parameter) parameterisation. Note that the same intrinsic alignment model is applied to both early- and late-type galaxies in this analysis. The observable under consideration is the real-space ellipticity two-point correlation function, i.e. the sum of the cosmic shear signal due to weak gravitational lensing and both the II and GI signals.
Heymans et al. (2013) split galaxies by the best-fit spectral energy distribution type, as determined by the photometric redshift algorithm into late-type spiral galaxies, which constitute ∼80%, and early-type galaxies, which make up the remaining ∼20%. Various combinations were considered: full sample, early-type, late-type and optimised early-type. Optimised early-type uses the same sample as the early-type analysis but includes the full sample (early- and late-type) in the background redshift bins used for tomographic cross-correlations. This optimisation is designed to overcome the noise due to the small sample size of early-type galaxies without changing the intrinsic alignment contribution, which is sourced by the foreground bin population. The intrinsic alignment amplitude, Ai, is constrained simultaneously with cosmological parameters. Figure 8 shows constraints on Ai and Ωm marginalised over the standard cosmological parameters. Note that these results also include auxiliary cosmological information from outside the CFHTLenS survey.
 |
Figure 8. Joint parameter constraints on the amplitude of the intrinsic alignment model (A, which is the same as our Ai) and the matter density parameter, Ωm, from CFHTLenS combined with WMAP7, BOSS and the Riess et al. (2011) supernova sample as presented in Heymans et al. (2013). Left panel: Constraints for two galaxy samples split by spectral energy distribution type (early-type in red and late-type in blue). Right panel: Constraints from an optimised analysis to enhance the measurement of the intrinsic alignment amplitude of early-type galaxies (pink). The full sample, combining early and late-type galaxies, produces an intrinsic alignment signal that is consistent with zero (shown purple). A flat ΛCDM cosmology is assumed. Reproduced with permission from Heymans et al. (2013). |
The results showed a strong dependence on galaxy type. The late-type sample has an alignment signal consistent with zero, as does the full sample, with amplitudes of AI,late = 0.18−0.82+0.83 and AI,all = −0.48−0.87+0.75, respectively. A tentative signal is detected for the early-type sample, with AI,early = 5.15−2.32+1.74, but the null result is inside the 2σ confidence region. The optimised early-type sample is less ambiguous, with a best-fit amplitude of Ai = 4.26−1.39+1.23. For tomographic surveys like CFHTLenS the linear alignment model has the (negative) GI contribution dominating over the (positive) II signal. A negative value of Ai, as marginally preferred by the full sample, would suggest that the data prefer a more positive intrinsic alignment contribution. It should be noted however that Heymans et al. (2013) applied the linear alignment model to all their galaxy samples, even though intrinsic alignment of late-type galaxies is not expected to be sourced by the same mechanism (see the introduction to thsi section and Kiessling et al. (2015) for more detail). Fitting this simple model to a joint population of late- and early-types, as they do in the full sample analysis, may not always be appropriate, nor will ignoring luminosity evolution in analyses with larger samples.
Dossett et al. (2015) re-analysed the CFHTLenS data in the context of joint constraints on intrinsic alignments and deviations from general relativity. When they assumed general relativity, their results agreed with those of Heymans et al. (2013). Scale independent modifications to general relativity have no major effect on the intrinsic alignment constraints. However, when the authors allow scale dependent modifications to general relativity, the constraints on Ai weaken and the 95% confidence contours of the Ai constraint from the optimised early-type sample are consistent with the null result. Effectively the data are not sufficient to simultaneously constrain intrinsic alignments and deviations from general relativity.
1 http://www.galaxyzoo.org/ Back.