


As mentioned in Sect. 1, a flaring Hi disk was found in the Milky Way (Gum et al. 1960). An early study of the flaring Hi disk in the edge-on galaxy NGC 891 was made by van der Kruit (1981), who found that the Hi thickness as function of radius observed by Sancisi and Allen (1979) could best be modelled by assuming that the disk potential was furnished mainly by the old stellar disk. For the face-on galaxies NGC 3938, NGC 628 and NGC 1058 a constant gas velocity dispersion as function of radius was found, of order 10 km/s (van der Kruit and Shostak 1982; Shostak and van der Kruit 1984; van der Kruit and Shostak 1984). It was thus thought that flaring Hi disks could be used to probe the shape of the dark halo.
6.1. Early Work on Case Studies
With the advent of the high-sensitivity, high-resolution capabilities of the Very Large Array (VLA), NGC 4565 and NGC 891 were re-observed by Rupen (1991). These observations indicated clearly the warps in these systems, as well as asymmetries in the Hi distribution. A further effort was made by Olling (1996a, b) for the small galaxy NGC 4244, who found that the best fit was a very flattened halo, with an axial ratio c / a of ∼ 0.2. Becquaert and Combes (1997) found a similar result for NGC 891, but if the vertical velocity dispersion was smaller than the radial one, a value of ∼ 0.4-0.5 could be found. Applying the same technique to observations of our Galaxy, Olling and Merrifield (2000) found a relatively round halo (c / a ∼ 0.8), but needed to adopt rather low values for some Galactic constants. Using a completely different method (lensing and optical spectroscopy) for the massive galaxy SDSS J2141-0001, Barnabè et al. (2012) recently found an oblate dark halo, with c / a = 0.75 ± 0.160.27.
Also in the 1980s-90s, efforts were made to use another probe of the shape of the dark matter halo, i.e., polar ring galaxies. Here, there was a remarkable shift of the “most likely” halo shape: the early studies of the polar ring galaxy A0136-0801 by Schweizer et al. (1983), and a few others (Whitmore et al. 1987) indicated a nearly round halo, while a later study of Sackett et al. (1994b) showed the halo around NGC 4650A as flat as E6. However, Arnaboldi et al. (1997) showed that the polar ring in that galaxy is very massive, and has spiral structure. Khoperskov et al. (2014) worked on a larger sample, and showed that a variety of halo shapes describe the data. polar ring galaxies
The expected Hi disk flaring was calculated for NGC 3198 and DDO 154 by Bosma (1994), and the result for NGC 3198, based on the maximum disk model in Fig. 6 (top right panel), is shown in Fig. 7. This calculation assumes equilibrium, and shows that the flaring depends on the velocity dispersion of the Hi disk, as well as the axial ratio of the dark halo. For a dwarf galaxy, assumed also to be flat, the flaring starts well inside the optical radius, since the dark matter dominates also in the inner parts of the disk. Thus the study of small, thin edge-on galaxies seems ideal for this problem.
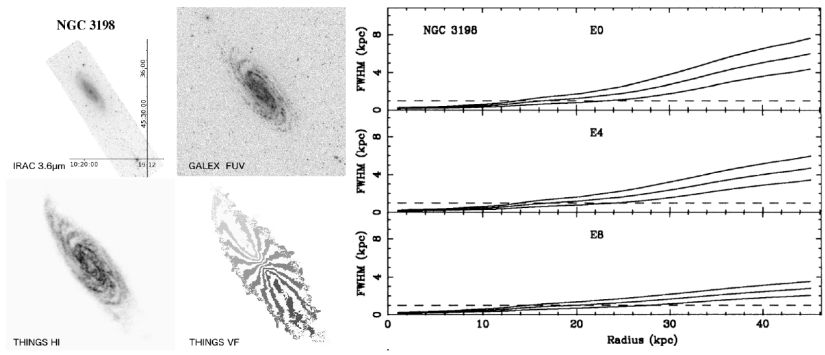 |
Figure 7. Spitzer 3.6 µm, GALEX far-UV, and Hi data from the THINGS survey for NGC 3198 (data taken from NED). At right is the flaring calculation from Bosma 1994, using the mass model in the top right panel of Fig. 6. The three curves are for constant velocity dispersions of 6, 8 and 10 km/s, and the halo flattening is expressed as for elliptical galaxies. |
6.2. Recent Results for Small, Flat Galaxies
“Super thin” galaxies were studied initially by Goad and Roberts (1981), and later investigated by, e.g., Uson and Matthews (2003), Matthews and Wood (2003), Matthews and Uson (2008) and in thesis work by O'Brien et al. (2010a, b, c, d) and Peters et al. (2013, 2016a, b, c, d). A lot of work hides behind these results, since Hi disks are frequently warped, and candidate galaxies have to be observed first before judging whether they are suitable for further study for the flaring problem. Even if the obviously warped galaxies are excluded from further study in this respect, subtle variations can influence the result. Matthews and Wood (2003) thus considered for their best case, UGC 7321, several models: a smooth distribution, a warped one, a flaring one, and a model with an Hi halo, which either corotates or lags, and combinations of these. None of them give a very satisfactory fit if attention is paid to detail. 0dO'Brien et al. (2010d) found c / a = 1.0 ± 0.1 for their best case, again UGC 7321. Peters et al. (2013) extended the database of O'Brien et al, but Peters et al. (2016d) found in the end only good flaring models for two galaxies, ESO 274-G001 and UGC 7321. For ESO 274-G001, they found an oblate halo with shape c / a = 0.7 ± 0.1, while for UGC 7321 they found a prolate halo, with c / a = 1.9 ± 0.30.1 in case the Hi is treated as optically thin, and 2.0 ± 0.1 in case the optical thickness of the Hi is taken into account. They point out that O'Brien et al. (2010d) did not consider prolate halo shapes, hence the difference.
Most of these late-type Sd galaxies have small maximum rotation velocities, and low star formation activity. Systematic studies by Karachentsev et al. (1999) have resulted in an extensive catalogue of these flat galaxies. Such data can be explored further in the era of large galaxy surveys.
Peters et al. (2016a) emphasize that it cannot be assumed that the Hi in galaxies is optically thin, and constructed a modelling procedure. Braun (1997) already emphasized this point twenty years ago in a study of seven nearby spiral galaxies at high spatial and spectral resolution with the VLA, and argued that there is significant opacity in the high surface brightness Hi gas. Braun et al. (2009) show this in their M31 data with specific examples, and estimate that the total Hi gas mass in that galaxy is about 30% higher than the value inferred using the assumption of optically thin gas.
6.3. Large Galaxies with a High Star Formation Rate: Accretion
Deep imaging (for that time) of M101 (van der Hulst and Sancisi 1988) showed that there are numerous holes in the Hi distribution in the main disk. In addition, Hi gas was detected at velocities not corresponding to the disk rotation, indicating the possible presence of the equivalence with the Galactic high velocity clouds (HVCs), either due to accretion of fresh gas, or a collision with remnant gas clouds related to a tidal interaction event between this galaxy and a smaller neighbour. Deeper Hi images of edge-on galaxies also became available, in particular for the galaxy NGC 891 (cf. Fig. 8). The observations of this very actively star forming galaxy show a thick Hi disk (Swaters et al. 1997), and yet more sensitive data show a more extensive thick Hi disk and a streamer (Oosterloo et al. 2007).
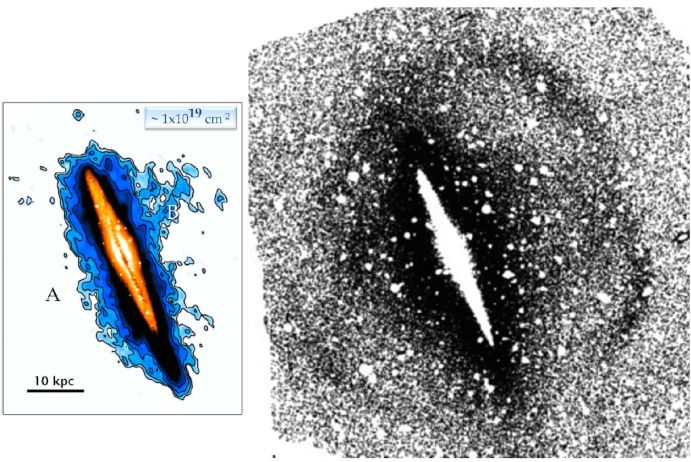 |
Figure 8. At left the Hi image of NGC 891 (reproduced with permission from Oosterloo et al. 2007), with an outer contour column density of 1.0 × 1019 cm−2, and at right, on the same scale, the image of the RGB stars (reproduced with permission from Mouhcine et al. 2010). |
The main result for the thick Hi disk in NGC 891 is that its rotation rate is lagging with respect to the thin disk, as already shown by Swaters et al. (1997), and more extensively in Fraternali et al. (2005). In Oosterloo et al. (2007) more modelling of NGC 891 was done, with a catalogue of possibilities: a thin disk, a strong warp along the line of sight, a flaring disk, a disk and corotating halo, a lagging halo with constant gradient, a lagging halo with high velocity dispersion, a lagging halo with a radial inflow motion, and a lagging halo with velocity gradient increasing in the inner parts.
It was realized that there could also be an effect of lagging Hi halo gas seen in the observations of more face-on galaxies. Indeed, a position-velocity diagram for the galaxy NGC 2403 (Fraternali et al. 2001; 2002; Fig. 9) shows that there is an anomalous component with ∼ 10% of the total Hi mass. The rotation velocity of the anomalous gas is 25−50 km/s lower than that of the disk. Its velocity field has non-orthogonal major and minor axes implying an overall inflow motion of 10−20 km/s toward the centre of the galaxy. A similar phenomenon is also seen in the THINGS observations of the galaxy NGC 3198 shown in Fig. 11 (upper panel), and is better brought out by the deeper imaging of this galaxy by Gentile et al. (2013), who find that ∼ 15% of the total Hi gas mass is in a thick disk with a scale height of about 3 ± 1 kpc.
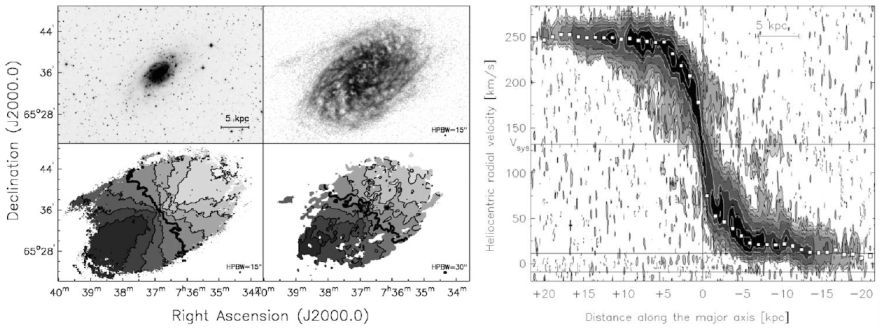 |
Figure 9. VLA observations of the galaxy NGC 2403 (reproduced with permission from Fraternali et al. 2001). Left panel of four: top: Optical image from the Digital Sky Survey (left) and Hi distribution (right) of the main disk component; bottom: velocity field of the main disk component (left) and of the anomalous gas component (right). Right panel: position-velocity diagram along the major axis, clearly showing the anomalous velocities (the “beard”). The derived rotation curve of the main disk component is superimposed, and the lines at the bottom of the plot show the range of velocities where contamination by galactic emission was filtered out. |
Fraternali and Binney (2006) explored an initial model, where galactic fountain activity leads to clouds being sent up in the halo, and then falling back to the disk again, but this did not explain the lagging of the rotation of the extraplanar gas, nor the inflow towards the disk. Sancisi et al. (2008), in a review, discuss the signatures of Hi gas accretion around nearby galaxies, and found an average visible Hi accretion rate of ∼0.2 M⊙ year−1. This is an order of magnitude too low to sustain the current star formation rates in some of the galaxies studied. Fraternali and Binney (2008) improved their galactic fountain model by considering the interaction of the fountain clouds with the hot coronal gas in the halo, the presence of which is expected theoretically, and ought to be observable in X-ray observations (see Hodges-Kluck and Bregman 2013 for a detection of that gas in NGC 891). A higher accretion rate can then be obtained, which is more of order of the star formation rate, so that the latter could be sustained from infalling gas over a longer timescale (e.g., Fraternali 2014, and references therein). For a recent in-depth review of this accretion model, see Fraternali (2016).
To follow up on this, the HALOGAS project was undertaken with the WSRT, but, while first results have been published, a conclusive paper has still to be completed. From presentations at conferences, it appears that NGC 891 is a relatively rare case, given its active star formation and extensive extraplanar gas distribution, which has been detected at other wavelengths as well (e.g., radio continuum: Allen et al. 1978, Hα: Rand et al. 1990, X-ray: Hodges-Kluck and Bregman 2013). Dahlem et al. (2006) argue on the basis of several examples that the presence of radio continuum thick disks is correlated with active star formation.
Several HALOGAS case studies have been published. New data on NGC 4414 (de Blok et al. 2014a) show that the outer warped Hi layer is dynamically somewhat offset from the central parts, while on a deep optical image a shell structure is seen in the western part. Both the warp and the thickening of the main galaxy (the inclination is higher in the central parts of the galaxy than the outline of the main galaxy body seen in Fig. 10) could be due to an interaction which caused also the shell structure itself.
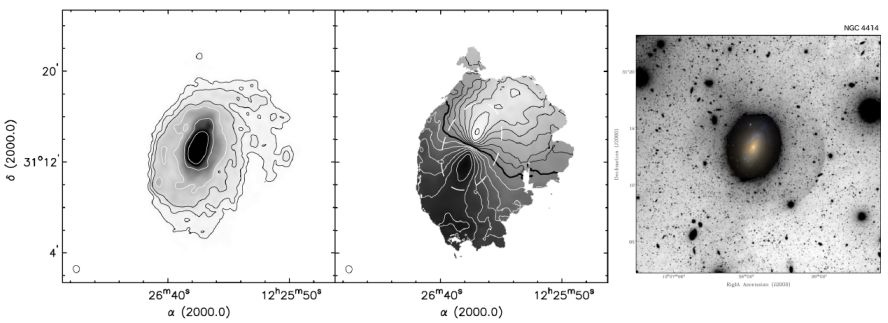 |
Figure 10. Deep Hi imaging of the galaxy NGC 4414 (reproduced with permission from de Blok et al. 2014a). From left to right, the Hi image, with the outer column density contour being 2 × 1019 cm−2, the velocity field indicating a strong warp in the northwestern part of the galaxy, and a deep optical image showing an outer shell feature, with a colour SDSS image overlaid in the inner parts. The outer isophotes of the SDSS image have a lower axial ratio than those of the outer isophotes of the main galaxy body in the deeper image. |
Concurrently, the HALOGAS galaxies were observed with the Green Bank Telescope (GBT), to look for further Hi gas at lower column densities. de Blok et al. (2014b) found a cloud near NGC 2403 in the GBT data, which has an Hi mass of 4 × 10⁶ M⊙ which is 0.15% of the total Hi mass of the galaxy. It seems to link up with a ∼107 M⊙ filament in the anomalous Hi gas described in Fraternali et al. (2002). Likewise, Heald (2015) report about a few HVC like clouds with a total Hi mass of 4 × 10⁶ M⊙ around NGC 1003. The very low column density Hi filament between M31 and M33 discovered by Braun and Thilker (2004) was reobserved by Wolfe et al. (2013), and shown to be composed for ∼50% of discrete clouds, embedded in more diffuse gas. To conclude, it can be said that there is Hi around disk galaxies which could be accreted, but the amount of mass is not enough to sustain the star formation rate in the main disk (cf. Heald 2015).
This gas accretion problem has almost completely superseded the attention given to the flaring of the Hi gas layer. Allaert et al. (2015) have taken the latter problem up again, and find that the Hi disk in NGC 5907 is flaring, while they do not exclude a moderate flaring for other edge-on galaxies. Kalberla and Dedes (2008) show a significant flaring for the gas disk of the Milky Way, in agreement with earlier studies. Note that although a lot of modelling of the stellar disk of edge-on galaxies has been done assuming no flaring, the work by Saha et al. (2009) and Streich et al. (2016) shows evidence for a mild flaring of the older stellar disk in a number of edge-on galaxies.
6.4. Velocity Dispersions in the Outer HI Layers of Spiral Galaxies
As discussed at the start of this Section, the flaring problem depends in part on the determination of the vertical velocity dispersion of the Hi gas, and early work with the WSRT indicated a value around 10 km/s, with a slight enhancement in star forming regions as found for NGC 628 by Shostak and van der Kruit (1984). Dickey et al. (1990) determined that for NGC 1058 the velocity dispersion in the gas outside the optical image is remarkably constant at 6 km/s. Further work on this was done by Kamphuis (1993) and Kamphuis and Sancisi (1993), in particular for the relatively face-on galaxy NGC 6946, where the velocity dispersion was determined after derotating the data cube by resetting the intensity-weighted mean velocities of the individual profiles to the same central velocity before adding them, as suggested already by Boulanger and Viallefond (1992). It was shown more clearly that the higher velocity dispersions are related to star formation activity.
In the framework of the THINGS project, Tamburro et al. (2009) determine Hi gas velocity dispersions for 11 galaxies, and found again evidence for lower velocity dispersions in the extended Hi envelopes beyond the optical image and high velocity dispersions in the inner parts of actively star forming galaxies. If correct, the model calculation in Fig. 7 (right panels) suggests that a gradient in the velocity dispersion from, e.g., 10 to 6 km/s, as seen in several cases, can lead to the absence of significant flaring.
There are various ways to go about the determination of the Hi gas velocity dispersion, and Tamburro et al. (2009) took the simplest way, i.e., considering the second moment map derived from the profiles in the data cube. However, various geometric effects need to be taken into account. One is that the Hi might not be a single layer, but in a combination of a low velocity dispersion thin disk and a higher velocity dispersion thick disk. This has been taken up recently for a number of galaxies in the THINGS sample (Ianjamasimanana et al. 2012, 2015; Mogotsi et al. 2016). The results for NGC 3198 are shown in Fig. 11, side by side with the position-velocity diagram along the major axis. This galaxy does not have the most favourable orientation for this work (perhaps too edge-on), but the results are illustrative of the difficulties involved. Ianjamasimanana et al. (2015) use “super-profiles”, i.e., profiles corrected for the effect of rotation, and stacked in annuli 0.2 R25 wide. They fit both a double Gaussian to low- and high-velocity components, as well as a single Gauss fit which allows comparison with older data in the literature. The low-velocity component is thought to represent the cold neutral medium in the thin Hi disk, and the higher-velocity component the warm neutral medium in a thicker disk. Mogotsi et al. (2016) present in an Appendix the results from fitting a single Gaussian to the profiles as well as taking the second moment. The comparison in Fig. 11 shows that the results differ widely. In the very central parts, the data are influenced by the broadening of the profiles inside a spatial resolution element (i.e., beam smearing). Outside, there is a large difference between the second moment and a Gaussian fit, on account of the skewness of the profiles. As discussed already in Sect. 6.3, for NGC 3198, this skewness is due to the presence of a thick disk with lagging rotation (Gentile et al. 2013).
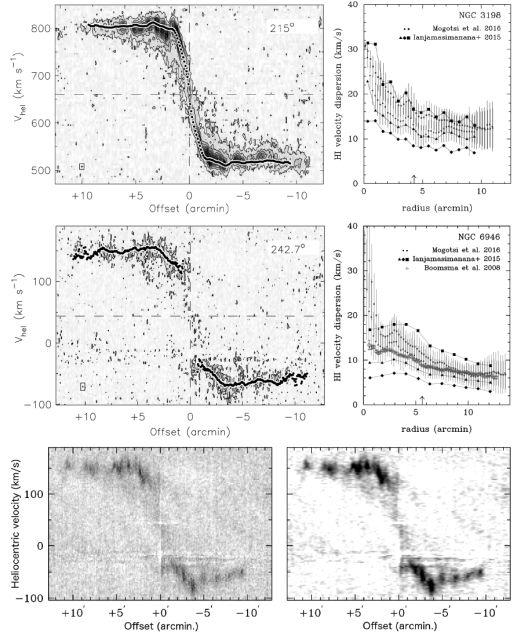 |
Figure 11. Top: Position-velocity diagram along the major axis of NGC 3198 (reproduced with permission from de Blok et al. 2008, left), and various radial profiles of the Hi gas velocity dispersion (right). Middle: idem for NGC 6946. Bottom: Position-velocity diagrams along the major axis of NGC 6946, using the available data cube from NED: at left the data with beam size of 6.0" × 5.6", and at right the 18.0" × 18.0" data. The “beard” shows up rather well in the smoothed data. The horizontal stripes are due to incomplete subtraction of galactic foreground emission. |
For the more face-on galaxy NGC 6946, the results from both studies also show again the presence of a low- and high-velocity dispersion component. Older WSRT data by Boomsma et al. (2008) show an Hi velocity dispersion profile similar to the one found in Kamphuis (1993), and the profile determined by Gaussian fitting of Mogotsi et al. (2016) agrees reasonably well with this. However, the single Gauss fit by Ianjamasimanana et al. (2015) is definitely lower, presumably due to the selection of only profiles with signal-to-noise ratio of three or more to be included into the stacked profiles. What is most striking, however, is that the velocity dispersions in NGC 6946 are lower than those in NGC 3198, despite the fact that NGC 6946 is forming stars more actively. The difference is perhaps due to the presence of more extraplanar gas in NGC 3198. Moreover, NGC 3198 is seen relatively edge-on, so there are line of sight integration effects. However, analysis of the publicly available data cube of NGC 6946 suggests another cause: if I smooth the cube from 6.0" × 5.6" to 18.0" × 18.0", the “beard” shows up in the smoothed version of the position velocity diagram (cf. Fig. 11, lower panels). Thus considerations of spatial resolution and sensitivity, as well as the spatial orientation of the galaxy with respect to the line of sight all play a role in the outcome of the studies of this problem. And, of course, if the question is asked: “what about the magnetic field?”, it is strong in NGC 6946, and much weaker in NGC 3198. Beck (2007) shows that in the outer parts of NGC 6946 the magnetic field energy density is higher than the energy in turbulent motions, so this cannot be neglected in the calculations of the thickness of the gas layer, at least for that galaxy.
6.5. Star Formation in Warped HI Layers
Occasionally, star formation is seen in the warped Hi layers, as in, e.g., NGC 3642 (Verdes-Montenegro et al. 2002), where the outer disk of low surface brightness has a different spatial orientation than the inner parts. This galaxy was later taken as a prototype of a Type III radial surface brightness profile in Laine et al. (2014), i.e., having an exponential disk with in the outer parts an upbending profile. This situation is noted also for Malin 1 (see also Sect. 3). van der Kruit (2007) notes that for the survey of warps in edge-on galaxies by García-Ruiz et al. (2002), the onset of the warp is rather abrupt, and occurs, for most of the galaxies considered, just outside the truncation radius if there is one. However, faint star forming regions can be found in a number of XUV disks, as shown in Fig. 5 (lower left) for NGC 5055 and Fig. 7 (top, second panel from left) for NGC 3198. Koribalski and López-Sánchez (2009) present Hi observations of the NGC 1510 / 1512 system, and state that the faint disk of NGC 1512, which contains strong spiral features, is warped with respect to the inner disk. Radburn-Smith et al. (2014) find that in the warped Hi disk of NGC 4565, the young stellar populations participate in the warp, but not the older ones. Detection of molecular gas in some of these galaxies is discussed in Koda and Watson (this volume).