


Ultimately, empirical studies characterizing the cool gas flows around galaxies must constrain, e.g., the incidence of accretion in a given galaxy population as a function of the mass inflow rate and age of the universe. Such detailed assessments are required for an incisive test of galaxy formation models (Davé et al. 2012, Nelson et al. 2015). We now consider a few factors which complicate the use of current datasets in developing such constraints. In the following section we discuss future directions which may ameliorate these issues.
The faintness of the galaxies studied in Rubin et al. (2012) and Martin et al. (2012) forced the selection of a low resolution spectroscopic setup for these surveys (FWHM ∼ 250−400 km s−1). Thus, the velocity profiles arising from distinct inflowing and outflowing gas structures along the same line of sight are blended in these spectra. Indeed, in none of the Mg II or Fe II line profiles discussed in Rubin et al. (2014) is more than one velocity component resolved. If there is, e.g., a component of gas being accreted at v ∼ +100 km s−1, and another wind component foreground to the same galaxy beam moving at v ∼ −200 km s−1, a centroid of the resulting line profile (observed at low resolution) will suggest the presence of an outflow with a velocity v ∼ −100 km s−1 (while the inflowing component is completely obscured). Or, in the case of two components each at v ∼ +100 km s−1 and −100 km s−1, a centroid of the observed line profile will reveal neither outflow nor inflow. Thus, there is a limited set of circumstances in which the centroid of such blended profiles will be significantly redshifted, revealing an inflow.
Indeed, as noted in Rubin et al. (2012), the six objects toward which inflows were detected are unique not for the material moving at positive velocities along the line of sight, but for the absence of winds. This is demonstrated in Fig. 5, which compares the equivalent widths measured redward and blueward of systemic velocity in the Fe II λ2600 (left) and Mg II λ2803 (right) transitions in the spectral sample of Rubin et al. (2014). Objects with detected winds are marked with blue crosses and cyan triangles; objects with detected inflows are marked with red crosses; and objects with neither winds nor inflow are marked with black filled circles. A 1:1 relation is indicated with the dashed lines. Inflows were detected in galaxies with larger red EWs than blue EWs; however, there are many other systems which have red EWs larger than the smallest values measured for the inflow sample (i.e., red EW2600 > 0.6 Å and red EW2803 > 0.8 Å; see Fig. 5). Based on an accounting of the number of galaxies with red EWs at least as large as those in which inflow was detected, Rubin et al. (2012) estimated that inflow must be occurring in at least 20-40% of the full galaxy sample.
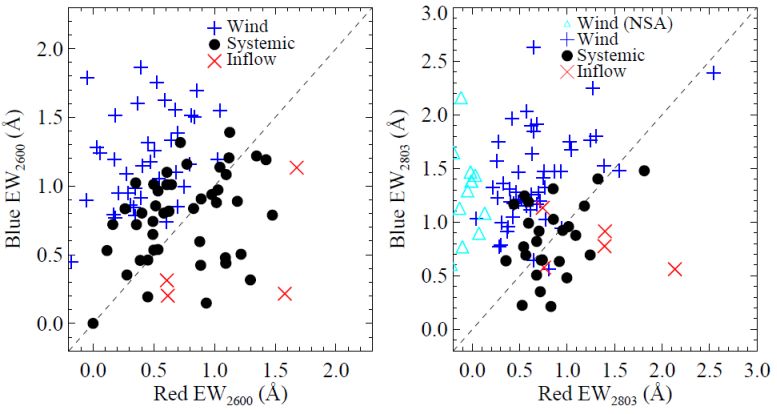 |
Figure 5. Assessment of the symmetry of Fe II and Mg II absorption line profiles in low-resolution galaxy spectroscopy. All measurements shown are from analysis of the UV spectroscopy of ∼ 100 star-forming galaxies discussed in Rubin et al. (2012, 2014). Left: The equivalent width (EW) of the Fe II λ 2600 transition, measured at v < 0 km s−1 (“blue”), vs. the EW of the same transition at v > 0 km s−1 (“red”) for galaxies with blueshifted Fe II (blue crosses), without winds or inflows (black filled circles), and with inflows detected in Fe II (red crosses). Several galaxies without detected inflows have red EW2600 values > 0.6 Å, comparable to or larger than the red EW2600 for two of the inflow galaxies. Right: same as left-hand panel, for the Mg II λ 2803 transition. Spectra which have no detectable absorption at v > 0 km s−1 are marked with cyan triangles. As is the case for Fe II λ 2600, numerous galaxies without detected inflows have red EW2803 > 0.8 Å, the smallest value measured for the inflow sample. This survey is therefore likely failing to flag ongoing inflow in a significant fraction of those galaxies in the “wind” and “systemic” subsamples. This Figure is a reproduction of Figure 7 from the article “Evidence for Ubiquitous Collimated Galactic-Scale Outflows Along the Star-Forming Sequence at z ∼ 0.5”, by K. H. R. Rubin et al. (2014, ApJ, 794, 156). ©AAS. Reproduced with permission. |
Sensitivity to inflow in the presence of absorption due to winds or interstellar material is certainly improved at higher spectral resolution. The Na I spectroscopy of nearby Seyfert galaxies discussed in Krug et al. (2010) (see Section 2.2) has a FWHM velocity resolution of ∼ 85 km s−1, and is thus significantly more sensitive to detailed line profile shapes than that of Rubin et al. (2012) or Martin et al. (2012). Such high spectral resolution can be achieved with current technology for distant galaxies which are also strongly gravitationally lensed (Pettini et al. 2002, Quider et al. 2009, Quider et al. 2010, Dessauges-Zavadsky et al. 2010). If at z > 2, high-resolution optical spectroscopy of these targets offers the added advantage of coverage of a rich suite of rest-frame UV transitions, including Lyα, O I λ 1302, several Si II transitions, Si IV λ λ 1393, 1402, and C IV λ λ 1548, 1550.
Keck/ESI coverage of many of these transitions in a spectrum of the “Cosmic Eye” is shown in Fig. 6, adapted from Quider et al. (2010). The Cosmic Eye is a Lyman break galaxy (LBG) at z = 3.073 which is heavily magnified by foreground massive structures, producing two overlapping arcs on the sky. The Keck/ESI spectroscopy obtained by Quider et al. (2010) has a FWHM velocity resolution ∼ 75 km s−1, and successfully resolves at least two distinct absorption components in several transitions. In fact, the authors note that this spectrum exhibits a strong, redshifted absorption component with v ∼ 350 km s−1 in addition to a blueshifted component presumably arising from winds. This may be interpreted as yet another detection of gas accretion, the first at z ∼ 3. Indeed, the red absorption component in this line profile was unique among the lensed LBGs that had been studied to date, each of which exhibited strongly (and exclusively) blueshifted absorption.
 |
Figure 6. High resolution Keck/ESI spectrum showing rest-frame UV absorption lines in a lensed Lyman break galaxy at zsys = 3.073 published in Quider et al. (2010). Arrows mark absorbers unrelated to this system. The values on the x-axis indicate velocity relative to zsys. The absorption transitions shown trace either cool, photoionized material (e.g., C II, Al II, Si II) or neutral gas (O I) along the sightline. The spectrum resolves two absorbing “components”, one at v ∼ −70 km s−1 and one at v ∼ +350 km s−1, suggesting both ongoing outflow and accretion. Spectroscopy of similar quality and fidelity of a significantly larger galaxy sample will reveal the frequency with which these phenomena occur along the same line of sight. This Figure reproduces a portion of Figure 4 from the article “A study of interstellar gas and stars in the gravitationally lensed galaxy ‘the Cosmic Eye' from rest-frame ultraviolet spectroscopy” by A. M. Quider et al. (2010, MNRAS, 402, 1467). Reproduced with the permission of Oxford University Press. |
Moreover, these data may in principle be used to constrain the column density, metallicity, and mass of the absorbing gas to a substantially higher level of precision than is possible with spectroscopy covering only the Na I or Mg II and Fe II lines. The absorption in the latter two transitions is nearly always saturated, limiting the line-of-sight column density to be larger than a modest value (Rubin et al. 2012, Martin et al. 2012). Furthermore, rest-frame optical and near-UV spectroscopy cannot be used to measure the column density of hydrogen toward the galaxy, nor does it cover transitions of a given element in multiple levels of ionization for constraints on the ionization state of the material. While the S/N of the spectrum of the Cosmic Eye discussed above is insufficient for such analysis, spectroscopy of other lensed LBGs, e.g. the “Cosmic Horseshoe” (Quider et al. 2009), MS1512-cB58 (Pettini et al. 2002), and the “8 o'clock arc” (Dessauges-Zavadsky et al. 2010) has yielded ionic column density measurements for ISM and outflow absorbing components to a precision of ±0.1 dex via analysis of weak (and unsaturated) Si II and Fe II transitions. Combined with analysis of the Lyα line profiles in the same spectra, this work has offered some of the only constraints on the metallicity of gas known to be outflowing from distant galaxies. Deeper observations of the Cosmic Eye and expanded samples of high dispersion, rest-frame far-UV spectroscopy of lensed LBGs have the potential to yield important constraints on the mass and metallicity of both outflows and cool galactic gas accretion.
In addition to increasing spectral resolution to gain sensitivity to gas accretion, spatially resolving the background stellar beams will further improve our constraints on the morphology of inflow. Westmoquette et al. (2013) offered one of the earliest demonstrations of the potential of this technique, targeting the central regions of the M82 starburst with four pointings of the DensePak IFU on the WIYN telescope (Fig. 7). These observations achieved 3-arcsec spatial resolution at a spectral resolution of ∼ 45 km s−1. Combined with CO emission observations from Walter et al. (2002), they facilitated a detailed comparison between the kinematics of Hα emission, CO emission, and Na I absorption.
 |
Figure 7. Spatially resolved spectroscopy of the starburst galaxy M82. Left: HST/ACS image of M82 with four IFU pointings overlaid (rectangles). The white contours show the total CO flux from Walter et al. (2002). Right: Radial velocity of Na I, Hα, and CO measured in a 7 arcsec-wide pseudo-slit extracted from the IFU data along the major axis. The CO and Hα velocities are similar across the galaxy; however, there is an absorbing component of Na I (green) which is offset in velocity by many tens of km s−1. Westmoquette et al. (2013) suggest that this component may be due to accreting tidal debris. Panels are reproductions of Figures 1 (left) and 7 (right) from the article “Spatially resolved kinematics of the multi-phase interstellar medium in the inner disc of M82” by M. S. Westmoquette et al. (2013, MNRAS, 428, 1743). Reproduced with the permission of Oxford University Press. |
The authors extracted spectra from a pseudo-slit 7 arcseconds in width placed along the major axis of the system, co-adding the data in several spatial bins along the slit. Measurements of the Hα, Na I, and CO velocities in these bins are shown in the right-hand panel of Fig. 7. In general, these velocities are similar at all slit locations; however, there is one component of Na I absorption (green) which has a large velocity offset, appearing to counter-rotate. The authors suggest that this component could be due to infalling tidal debris, which may even have originated in the HI gas filaments populating the circumgalactic medium around this system.
While this interpretation is somewhat speculative, this spatially resolved spectroscopy has nevertheless resolved a heretofore unknown velocity component of cold gas in a system in which gas flows have been studied in great detail for over a decade (Shopbell & Bland-Hawthorn 1998). Moreover, these data provide evidence in support of a picture in which inflows persist even in strongly starbursting systems with powerful ongoing outflows. Upcoming massive IFU surveys such as SDSS-IV/MaNGA (Bundy et al. 2015) will provide qualitatively similar observations for ∼ 10,000 nearby galaxies, resolving Na I kinematics on ∼ 1−2 kpc spatial scales across the face of each object. These data will be extremely sensitive to the morphology and cross section of inflowing streams as they approach the ISM of galaxies.