


As a prelude to the next section on the physical nature of obscuration in AGN we provide a brief overview of the observed demographics of obscured AGN activity. In this section we discuss three key aspects: (1) the distribution of AGN absorbing column densities, including the fraction of AGN that are Compton thick, (2) the luminosity dependence of obscuration, and (3) the redshift dependence of obscuration. We will mostly focus our discussion on results from X-ray observations since they provide an efficient AGN selection and yield one of the most reliable absorption measurements; however, we will note similarities and discrepancies with results obtained at other wavelengths.
The majority of the AGN population are obscured: they dominate both the number density and luminosity density of accretion onto SMBHs (e.g., Ueda et al., 2014, Aird et al., 2015b, Buchner et al., 2015). A common way to characterise the amount of obscuration is to construct the distribution of absorbing column densities (often called the NH distribution). In Figure 9 we show an example NH distribution for AGN in the local Universe detected at 14–195 keV from the Swift-BAT all-sky survey (Ricci et al., 2017b). The absorbing column densities have been measured using the Swift-BAT data in combination with X-ray data in the soft band and both the observed and intrinsic (i.e., the inferred NH distribution after correcting for the selection function; see Section 2.5) distributions are plotted. The intrinsic fraction of obscured AGN (NH > 1022 cm−2) from this study is 70 ± 5% and the intrinsic fraction of Compton-thick AGN (NH = 1024 – 1025 cm−2) is 27 ± 4% (e.g., also see Akylas et al., 2016, Koss et al., 2016). Note that the absence of heavily Compton-thick AGN with NH > 1025 cm−2 is not intrinsic but is due to the low sensitivity of X-ray observations to such large amounts of obscuration and therefore the Compton-thick fraction is actually a lower limit. An effective technique that can be adopted to identify heavily Compton-thick AGN is to combine mid-IR and X-ray observations to select AGN that are bright in the mid-IR waveband but weak or undetected at X-ray energies; see Section 2.5 and Figure 8.
The fraction of AGN that are obscured appears to be a function of both AGN luminosity and redshift. The first tentative evidence of this result was found over 25 years ago (Lawrence, 1991) and has since been confirmed by many studies in the X-ray, optical, infrared, and radio wavebands (e.g., Simpson, 2005, Maiolino et al., 2007, Treister, Krolik & Dullemond, 2008, Lusso et al., 2013, Mateos et al., 2017). An example of the obscuration dependence with AGN luminosity is shown in Figure 7 for X-ray detected AGN over the broad redshift range of z = 0.3–3.5 (Merloni et al., 2014). An interesting attribute of this chosen example is that the distinction between obscured and unobscured AGN is made using both X-ray data and optical spectroscopy. However, regardless of whether the AGN are classified as obscured in the X-ray or optical waveband, there is a clear decrease in the obscured AGN fraction towards higher luminosities. The decrease implies an increase in the opening angle of the torus with luminosity and therefore a decrease in the dust covering fraction, a result that is often interpreted as due to a “receding torus” (see Section 4.1). We note that there is considerable variation between studies in the strength of the decrease in the obscured AGN fraction with luminosity (e.g., see Figure 28 of Toba et al. 2014 for a compilation of multi-wavelength results). Several factors are likely to contribute to the variation in results, including (1) the method adopted to distinguish between obscured and unobscured AGN, (2) the waveband used to select the AGN (i.e., the optical depth and sensitivity towards obscuration), and (3) the range of parameter space used to select the AGN (e.g., across the redshift–luminosity–mass plane). Furthermore, as we discuss in Section 4.1, the primary driver of the obscured AGN fraction may be Eddington ratio rather than luminosity.
In general the evidence for evolution in the obscured AGN fraction with redshift is less secure than with luminosity. An example study is shown in Figure 10, which presents the evolution in the X-ray absorbed fraction of Compton-thin and Compton-thick AGN with redshift (Aird et al., 2015b). These constraints were derived from fitting a model to the measurements of the evolving X-ray luminosity functions of X-ray absorbed, X-ray unabsorbed, and Compton-thick AGN using data from deep X-ray surveys; the X-ray luminosity function is the measurement of the space density of AGN as a function of X-ray luminosity, taking into account the X-ray selection function. There is considerable uncertainty in the measured redshift evolution in the obscured AGN fraction. However, overall, the studies broadly agree that the obscured fraction of distant AGN is at least comparable with that found locally and may increase with redshift (e.g., Ueda et al., 2014, Buchner et al., 2015), which could be driven by the increase in the star-formation rate and cold-gas fraction of galaxies with redshift (see Madau & Dickinson 2014 for a recent review).
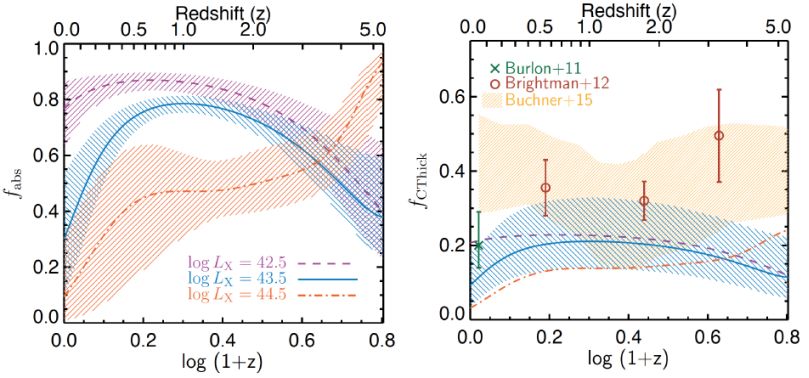 |
Figure 10. (Left) Fraction of AGN that are X-ray absorbed but Compton thin vs redshift for three different rest-frame 2–10 keV luminosities (colored coded, as indicated) for the best-fitting model presented in Aird et al. (2015b). (Right) Fraction of AGN that are Compton-thick vs redshift at a rest-frame 2–10 keV luminosity of 1043.5 erg s−1 (blue curve and shaded region), compared to other studies (as indicated) for the best-fitting model presented in Aird et al. (2015b). The magenta and orange curves show the Compton-thick AGN fraction vs redshift at a rest-frame 2–10 keV luminosity of 1042.5 erg s−1 and 1044.5 erg s−1, respectively. Figures from Aird et al. (2015b), courtesy of J. Aird. |