


In this section we give an overview of the variety of methods commonly used to identify and characterize obscured AGN. We have divided this section into separate sub sections to correspond to the various wavebands used to identify obscured AGN: UV–near-IR (0.1–3 µm), X-ray, mid-IR (3–30 µm), and the far-IR–radio (> 30 µm); we do not consider the selection of obscured AGN at gamma-ray wavelengths since with current technology the majority of the gamma-ray detected AGN are highly beamed unobscured AGN (see Section 6 of Padovani et al. (2017) for a recent review). The selection of these wavebands correspond to those typically adopted in the literature and are mostly defined by the different technology required to observe in each waveband; however, we note that each waveband also broadly corresponds to a specific physical component within the overall AGN SED (see Figure 1).
In each sub section we briefly describe the origin of the AGN emission in that waveband and discuss the impact that obscuration and host-galaxy dilution has on the identification of AGN activity. We then describe some of the common techniques adopted to identify AGN and qualitatively assess two key factors: the “reliability” and “completeness” of the technique. The “reliability” refers to how reliable a given technique selects an obscured AGN from other astrophysical source populations (i.e., how much the contamination from other source populations effect the selection of obscured AGN). The “completeness” refers to how complete the technique is in selecting obscured AGN (i.e., high completeness means that the technique is able to select nearly all obscured AGN). These two quantities are not necessarily correlated. A given technique may be able to select all obscured AGN but also be unreliable. An extreme example of this would be to select all galaxies in the Universe: this approach will select all obscured AGN, and so will have a high completeness; however, the majority of the selected sources will not host an obscured AGN and so the technique will have a low reliability. For the wavebands where both spectroscopy and broad-band photometry are adopted to select obscured AGN, we will discuss each separately. To provide some guidance in advance of our discussion, in Figure 4 we illustrate the effects of obscuration on the broad-band AGN SED, and in Figure 5 we schematically illustrate the impact that obscuration and host-galaxy dilution can have on the identification of AGN for a range of different techniques.
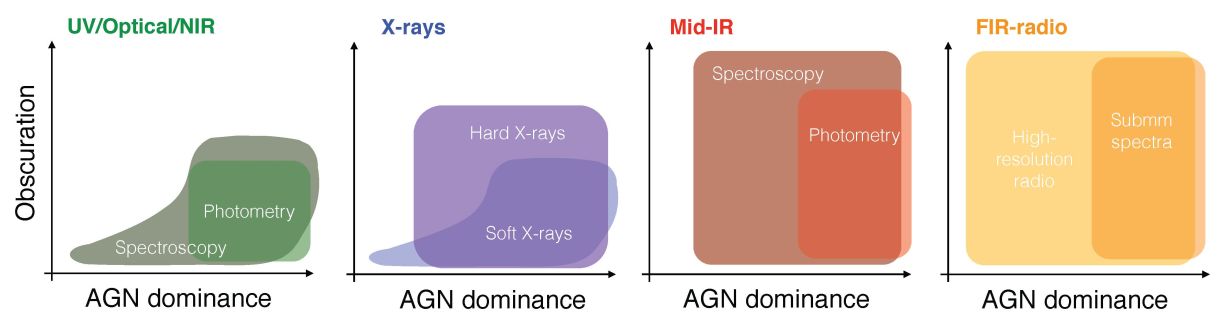 |
Figure 5. Schematic diagram to broadly illustrate the effectiveness of different techniques in the identification of AGN for a range in nuclear obscuration and the relative luminosity of the AGN to the host galaxy, as defined in Figure 4. The shaded regions indicate where the given technique is expected to be effective in identifying AGN activity within the obscuration–AGN dominance parameter space; despite the hard edges, these shaded regions should only be considered as broadly indicative. |
In our discussion we also indicate how accurately the amount of obscuration can be measured from a given technique. The best methods for identifying obscured AGN will typically not provide the most accurate measurements on the amount of obscuration because, by definition, they are relatively insensitive to the presence of obscuration (i.e., the optical depth is low and therefore the signatures of obscuration will not be strong).
We begin our discussion with UV–near-IR selection techniques, which were the first to identify obscured AGN, followed by a discussion of identification techniques at X-ray, mid-IR, and the far-IR–radio wavebands, highlighting the reliability and completeness of the various techniques for the selection of obscured AGN. This discussion builds on the recent review by Padovani et al. (2017), with a focus on obscured AGN. At the end of this section we discuss how a combination of techniques can be utilized to identify a more complete census of obscured AGN.
|
COMMON UV/OPTICAL/NEAR-IR SELECTION CRITERIA FOR OBSCURED
AGN
Commonly used criteria for identifying AGN in this waveband include:
Once AGN have been identified, common criteria for classifying the sources as obscured include:
|
2.1 Selection of obscured AGN in the ultra-violet to near-infrared waveband
Some of the most well-developed selection techniques for obscured AGN are in the UV, optical, and near-IR wavebands. A summary of methods for identifying obscured AGN in these bands is given in the sidebar on “Common UV/optical/near-IR selection criteria for obscured AGN”, and these are discussed in detail below.
2.1.1. Broad-band continuum techniques. Unobscured AGN are efficiently selected using UV–optical photometry since the emission from the accretion disk is bright in this waveband (e.g., Richards et al., 2001, Padovani et al., 2017); see Figure 1. However, UV–optical photometry is ineffective at identifying obscured AGN because (1) the optical depth due to dust is high at UV–optical wavelengths and hence the emission from the accretion disk is easily obscured (the optical depth increases towards shorter wavelengths; e.g., Calzetti, Kinney & Storchi-Bergmann 1994, Draine 2003) and (2) the host galaxy is bright at UV–optical wavelengths due to the emission from stars, which dilutes the weak emission from the obscured AGN. As a consequence both the reliability and completeness of obscured AGN selection using UV–optical photometry is low.
Improvements in the selection of obscured AGN can be made by extending out to near-IR wavelengths as the optical depth is substantially lower than at UV–optical wavelengths. However, the stellar emission from galaxies typically peaks at near-IR wavelengths, offsetting part of the optical depth benefit. Consequently, the near-IR photometric selection of AGN is most effective for luminous AGN with modest amounts of obscuration, such as dust-reddened quasars where some of the accretion disk and broad-line emission is visible (e.g., Webster et al., 1995, Glikman et al., 2007); see Section 5.1 for further discussion.
The weakness of the AGN continuum of obscured AGN with respect to the host galaxy at UV–near-IR wavelengths does, however, make this waveband ideal for studying the host galaxies of obscured AGN (e.g., Kauffmann et al., 2003, Hickox et al., 2009, Schawinski et al., 2010, Heckman & Best, 2014). Correspondingly, UV–optical emission that is faint and/or dominated by the host galaxy can be essential for classifying AGN as obscured when they are identified in other wavebands, as well as measuring the level of obscuration through fitting of the multiwavelength SED using empirical and/or theoretical models with varying levels of obscuration on the AGN component (e.g., Hickox et al. (2007), Merloni et al. (2014); see Figure 3).
2.1.2. Spectroscopic techniques. While UV–near-IR photometry is inefficient at identifying obscured AGN, UV–near-IR spectroscopy and spectropolarimetry have been essential tools in the identification and characterisation of obscured AGN. Optical spectroscopy led to the discovery of Seyfert galaxies (Seyfert, 1943) and the identification of the two main spectral classes of AGN (e.g., Khachikian & Weedman, 1974, Weedman, 1977): Type 1 systems, where the bright optical continuum and both broad and narrow emission lines are observed (i.e., unobscured AGN), and Type 2 systems, where the optical continuum is weak and only narrow emission lines are observed (i.e., obscured AGN), as illustrated by the composite spectra shown in Figure 3. Optical spectropolarimety of Seyfert 2 galaxies has furthermore shown that many have the features expected for a Seyfert 1 galaxy (broad emission lines and a strong UV–optical continuum) when observed in polarized light (e.g., Antonucci & Miller, 1985, Tran, 2003, Moran et al., 2007, Ramos Almeida et al., 2016); this is commonly referred to as a “hidden Seyfert 1”, a “hidden Type 1 AGN”, or a “hidden BLR”. The Seyfert 1 features are undetected in optical spectroscopy due to the obscuring torus but are seen in spectropolarimetry due to the emission being scattered (and hence polarized), by electrons/dust grains within the NLR, into the line of sight of the observer. Spectropolarimetry was central to the development of the unified AGN model and our current picture of the AGN physical structure.
A key reason why UV–near-IR spectroscopy has been so instrumental in the identification and characterization of obscured AGN is because the UV–near-IR waveband is rich in emission lines; some of the prominent optical lines are shown in Figure 3. From a combination of emission-line strengths it is possible to make sensitive measurements of the conditions of the different gas phases (e.g., from the excitation and ionization energies and critical densities), allowing for the construction of powerful emission-line diagnostic diagrams to distinguish obscured AGN from other astrophysical sources (e.g., Baldwin, Phillips & Terlevich, 1981, Veilleux & Osterbrock, 1987, Ho, Filippenko & Sargent, 1997, Kewley et al., 2006). An example suite of emission-line diagnostic diagrams is shown in Figure 6. An AGN is distinguished from that of a star-forming region (i.e, HII region) and a LINER (low-ionization nuclear emission region sources, some of which host low-luminosity AGN; e.g., Heckman 1980, Heckman & Best 2014) on the basis of the ratio of the ionized forbidden line flux to the neutral permitted line flux: large ratios imply a “hotter” (i.e., shorter wavelength and higher energy) radiation field and betray the presence of the AGN. The emission-line ratios will be reduced if the AGN resides in a strong star-forming galaxy until, in extreme cases, the AGN signature is no longer distinguishable from that of star-forming galaxy. The emission lines are chosen to have similar wavelengths to reduce the effect of dust reddening on the emission-line ratio; however, the presence of obscuration will reduce the strength of the individual emission lines and could completely extinguish the emission-line signatures. For applications in which the available emission lines are limited due to the wavelength range of the spectra or the redshift of the source, complementary selection criteria have been developed that use a combination of line ratios and host galaxy properties such as color and mass (e.g., Trouille, Barger & Tremonti, 2011, Yan et al., 2011, Juneau et al., 2011). Other studies have identified AGN by the presence of a single very high excitation optical line (commonly [NeV] λ3426) that is not easily excited by stellar processes (e.g., Gilli et al., 2010, Mignoli et al., 2013, Vergani et al., 2018).
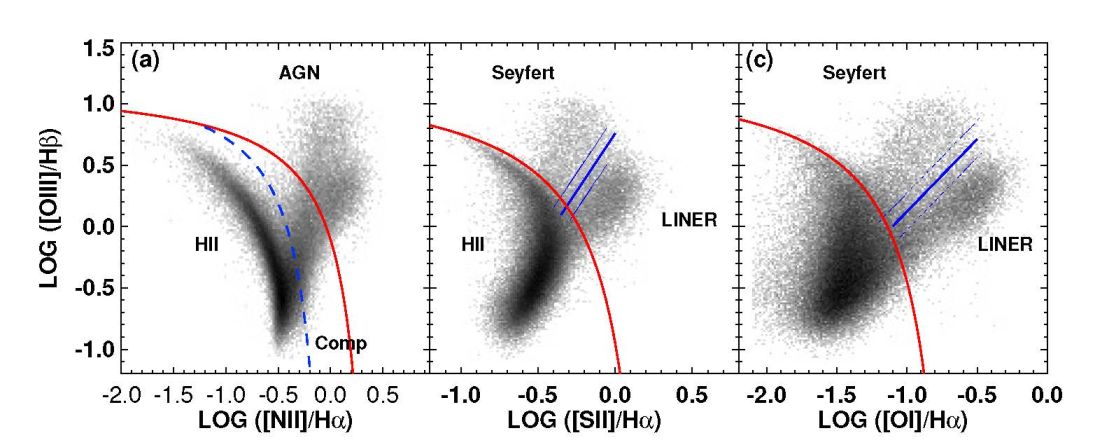 |
Figure 6. Optical emission-line diagnostic diagram to distinguish between AGN, star-forming galaxies (H II), composite AGN–star forming systems, and low ionisation nuclear emission region sources (LINERs). Figure from Kewley et al. (2006), courtesy of L. J. Kewley. |
Emission-line diagnostics provide a reliable method to identify AGN, although the demarcation curves between AGN and other source types depend on the metallicity of the systems and are expected to change with redshift (e.g., Kewley et al., 2013, Juneau et al., 2014). They also provide a relatively complete selection of AGN and are able to identify systems with extreme nuclear obscuration since the NLR emission will not be heavily extinguished by obscuration of the nucleus on small scales (e.g., Zakamska et al., 2003, Lansbury et al., 2015, Hviding et al., 2018). However, the optical AGN signatures can be extinguished by dust in the host galaxy or rendered unidentifiable in systems where the host galaxy emission lines are significantly brighter than those of the AGN; the former limitation can be mitigated using spectroscopy at longer wavelengths (e.g., at mid-IR wavelengths), where the optical depth is lower; see Section 2.3.
The identification of a Type 2 AGN does not always indicate the presence of obscuration. At least a fraction of the Type 2 AGN population appear to be unobscured and intrinsically lack a BLR (e.g., Panessa & Bassani, 2002, Bianchi et al., 2012). These systems often appear to be low-luminosity AGN and it is possible that the accretion rate is insufficient to allow for the formation of the optically thick accretion disk (e.g., Elitzur & Ho, 2009, Trump et al., 2011); however, some high accretion rate systems also appear to intrinsically lack a BLR (e.g., Ho, Kim & Terashima, 2012, Miniutti et al., 2013, Elitzur & Netzer, 2016), challenging the simplest versions of the unified AGN model. The optical spectral properties of some AGN are also found to change from a Type 1 AGN to a Type 1.8–1.9 AGN (i.e., a system with with most of the features of a Type 2 AGN but with a weak broad-line component; Osterbrock 1981); these systems are often called “changing-look” AGN. For a fraction of these sources the changing optical spectral type may be related to changes in the obscuration properties (see Section 2.2 for X-ray evidence of time-variable absorption in AGN). However, in the majority of cases, it appears to be related to a decrease in the luminosity of the accretion disk (e.g., Denney et al., 2014, LaMassa et al., 2015, MacLeod et al., 2016).
UV–near-IR spectroscopy can provide reliable measurements of the amount of obscuration towards either the BLR or the NLR through the relative strength of related emission lines. The common adopted technique is called the “Balmer decrement” and is based on measuring the strength of the Hydrogen emission corresponding to different excitation states. For example, the Hα / Hβ flux ratio, which corresponds to the n = 2 (i.e., the Balmer series) electron transitions, will have a fixed ratio for any given conditions of the gas (e.g., the density, metallicity, temperature; Baker & Menzel (1938), Brocklehurst 1971). Therefore, since optical depth is wavelength dependent, the presence of obscuring material will preferentially affect the Hβ emission (at 486 nm) more strongly than the Hα emission (at 656 nm), and therefore the deviation of the Hα / Hβ flux ratio from the expected flux ratio will indicate the amount of obscuration towards the line emitting regions (e.g., Ward et al., 1987, Gaskell, 2017). The Balmer decrement is based on extinction measurements made from optical emission lines and is sensitive to modest amounts of obscuration; however, larger amounts of obscuration can be measured using longer-wavelength emission lines (e.g., the n = 3 Paschen series, which are produced in the near-IR waveband).
2.2. Selection of obscured AGN in the X-ray waveband
X-ray observations provide one of the most reliable and complete methods for selecting obscured AGN. A summary of X-ray methods for identifying obscured AGN is given in the sidebar on “Common X-ray selection criteria for obscured AGN”, and we discuss them in detail below. The X-ray band is defined here as the energy range of 0.2–200 keV; energies below this range correspond to UV wavelengths and energies above this range correspond to gamma rays. The Earth’s atmosphere is opaque at X-ray energies and therefore all sensitive X-ray observations of the cosmos have been obtained from space (see Giacconi (2009) for a review of the history of X-ray astronomy). It is common practice to divide the X-ray energy band into the “soft band” and “hard band”, which corresponds broadly to the sensitivity of the X-ray observatory to the absorbing column density of gas. Although the definition of these bands can vary from study to study, in this review we will define the soft band as < 10 keV and the hard band as > 10 keV; on the basis of this definition, some of the current soft-band observatories are Chandra and XMM-Newton while some of the current hard-band observatories are Integral, NuSTAR, and Swift-BAT. The majority of X-ray observatories have good energy resolution and low background, allowing for simultaneous photometric and spectroscopic measurements from individual observations. Hence in this sub section we do not make a strong distinction between the photometric and spectroscopic identification of AGN.
| COMMON X-RAY SELECTION CRITERIA FOR OBSCURED
AGN
Commonly used criteria for identifying AGN in this waveband include:
Once AGN have been identified, common criteria for classifying the sources as obscured include:
|
The X-ray emission from AGN appears to be (near) ubiqitious and is directly associated with the accretion disk. In unobscured AGN there is a remarkably tight relationship between the X-ray emission and the UV–optical emission (e.g., Steffen et al., 2006, Lusso & Risaliti, 2016). The X-ray emission is thought to arise in a “corona” above the accretion disk and is predominantly produced by the inverse Compton scattering of photons from the accretion disk; however, the lowest energy X-ray photons can be produced in the inner, and therefore hottest, regions of the accretion disk. The X-ray emission is then modified from interactions with material in the accretion disk (and potentially the host galaxy), such as photoelectric absorption, reflection, and scattering (see Figure 1).
The impact of obscuration in the X-ray band is a function of rest-frame energy, with lower-energy X-ray photons more easily absorbed than higher-energy X-ray photons (i.e., the optical depth increases with decreasing energy; Wilms, Allen & McCray 2000). As a consequence, observatories with sensitivity in the hard band are able to detect more heavily obscured AGN than observatories with sensitivity in the soft band; however, we note that it depends on the redshift of the source since the probed rest-frame energy increases with redshift in a given energy band. The low optical depth at X-ray energies, particularly in the hard band, means that the completeness of obscured AGN selection is high in the X-ray waveband. For example, at X-ray energies of > 10 keV significant suppression of the X-ray emission only occurs at Compton-thick column densities (NH > 1.5 × 1024 cm−2) due to Compton recoil and subsequent absorption of the X-ray photons (see Comastri (2004) for a review).
X-ray observations also provide one of the most reliable methods to identify AGN because the X-ray emission from other astrophysical processes is typically weak by comparison. The dominant physical processes for the production of X-ray emission in the host galaxy are accreting neutron stars and stellar-mass black holes (commonly referred to as X-ray binaries; see Fabbiano (2006) for a review) and hot gas (T > 106 K). The populations of X-ray binaries are classified into low-mass X-ray binaries and high-mass X-ray binaries, depending on the mass of the stellar companion in the binary system, and their integrated X-ray luminosities are closely related to the mass and star-formation rate of the galaxy, respectively (e.g., Lehmer et al., 2016). Only the most massive and strongly star-forming galaxies will produce X-ray emission of LX > 1042 erg s−1 at 2–10 keV (e.g., Alexander et al., 2005, Wang et al., 2013) and the majority of galaxies will be more than an order of magnitude less luminous in the X-ray band (e.g., Lehmer et al., 2010, Mineo, Gilfanov & Sunyaev, 2012). Therefore, contamination from host-galaxy processes is only likely to be an issue for low luminosity or heavily obscured AGN, where the X-ray emission is suppressed due to the presence of absorption. For nearby systems, such weak or obscured AGN may be identified using high-resolution X-ray observations if an X-ray point source can reliably associated with the galactic nucleus (e.g., Gallo et al., 2010, She, Ho & Feng, 2017). However, we caution that there can still be a non-negligible chance that a nuclear X-ray source is an X-ray binary rather than an AGN, highlighting the importance of additional discriminating criteria such as those described in this review.
Since the integrated emission from X-ray binaries is predominantly observed at < 10 keV, low luminosity or heavily obscured AGN can be more reliably identified at > 10 keV. The emission from hot gas, either from the host galaxy or from a galaxy cluster, can be substantial in some sources (up-to ≈ 1041 – 1042 erg s−1 for AGN in luminous host galaxies and up-to ≈ 1044 – 1045 erg s−1 for AGN that reside at the core of a massive galaxy cluster); however, as for the X-ray binaries, the X-ray emission from the hot gas is predominantly at low energies (< 2–5 keV). Overall, the combination of the low optical depth and the low contrast between AGN and other astrophysical source populations at X-ray energies, particularly in the hard band, make X-ray observations one of the most reliable and complete methods to select obscured AGN (Brandt & Alexander, 2015).
The distinctive signatures of absorption in the X-ray spectra of AGN (illustrated in Figure 4) mean that X-ray spectroscopy provides one of the most accurate methods of identifying obscuration in AGN and measuring the amount of absorption, at least up to Compton-thin absorbing column densities (e.g., Done, 2010). For sources with relatively few detected X-ray counts, the level of absorption can be approximated using the hardness ratio (the ratio of source counts in different X-ray bands; Park et al. 2006) and source redshift (e.g., Merloni et al., 2014).
The signatures of Compton-thick absorption are more challenging to detect, but can be identified in high signal-to-noise ratio X-ray spectra. The identification of a strong reflection component at E > 10 keV and a prominent Fe Kα emission line at 6.4 keV (with equivalent width typically > 1 keV) are clear signatures of Compton-thick absorption (e.g., Mushotzky, Done & Pounds, 1993, Levenson et al., 2006, Done, 2010). The presence of Compton-thick material can also be inferred through the comparison of the observed X-ray luminosity to a proxy (such as mid-IR or optical narrow-line emission) for the intrinsic X-ray luminosity, although this is a less reliable approach; see Section 2.5. On the basis of current constraints, the fraction of the AGN population that is Compton thick is high (≈ 30–50%; e.g., Burlon et al. 2011, Ricci et al. 2015); see Section 3.
The source of the obscuration at X-ray energies (gas) is different to the source of the obscuration at longer wavelengths (dust) and may occur on different physical size scales. Despite this, good agreement is found between the X-ray signatures of absorption and the optical spectral types of AGN if NH = 1022 cm−2 is taken as the threshold between X-ray absorbed and X-ray unabsorbed AGN (≈ 80–90% agreement in the X-ray and optical obscuration signatures; e.g., Malizia et al. 2012, Merloni et al. 2014, Burtscher et al. 2016, Koss et al. 2017); see Figure 7.
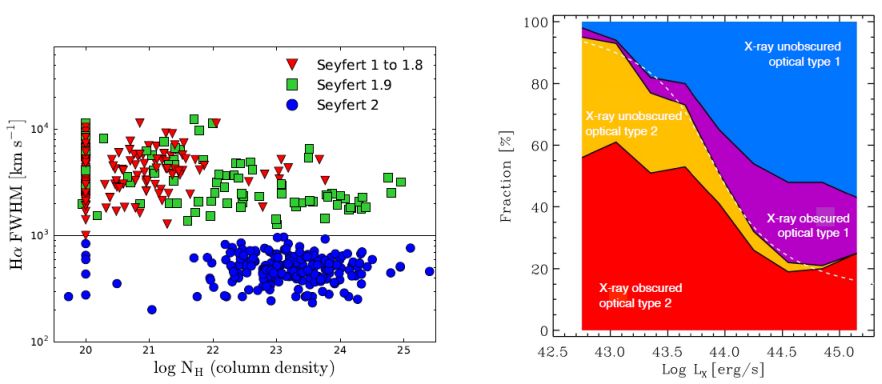 |
Figure 7. (Left) Hα emission-line width (parameterised as the full width half maximum) vs absorbing column densities for local X-ray AGN detected by Swift-BAT. The symbols indicate the different optical spectral types of the X-ray AGN and the solid horizontal line indicates the broad separation between Type 1 and Type 2 AGN in this study. Figure from Koss et al. (2017), courtesy of M. Koss. (Right) Relative fractions of AGN vs X-ray luminosity for the broad redshift range of z = 0.3–3.5. The relative fractions are distinguished according to their X-ray and optical classifications. Figure modified from Merloni et al. (2014), courtesy of A. Merloni. |
The X-ray absorption in the majority of AGN is not constant but is seen to vary on time scales of days to years (e.g., Risaliti, Elvis & Nicastro, 2002, Bianchi et al., 2009), indicating that the absorbing gas is distributed in compact clouds; individual AGN have even been seen to change from Compton thin to Compton thick levels of absorption and vice versa (e.g., Matt, Guainazzi & Maiolino 2003, Risaliti et al. 2005). Current constraints suggest that much of the variable absorption of the X-ray emission occurs in the BLR rather than in the dusty torus.
| COMMON MID-IR SELECTION CRITERIA FOR OBSCURED
AGN
Commonly used criteria for identifying AGN in this waveband include:
Once AGN have been identified, common criteria for classifying the sources as obscured include:
|
2.3. Selection of obscured AGN in the mid-infrared waveband
The mid-IR waveband provides an efficient and effective selection of obscured AGN. A summary of mid-IR methods for identifying obscured AGN is given in the sidebar on “Common mid-IR selection criteria for obscured AGN”, and we discuss them in detail below. The mid-IR waveband is defined here as 3–30 µm, which broadly corresponds to the infrared wavelengths where the emission from the AGN is most distinct from that of the host galaxy; see Figure 1. Due to strong absorption in the terrestrial atmosphere, the majority of the mid-IR waveband can only be efficiently observed from high in the atmosphere and, ideally, from space; some of the observatories with sensitivity at mid-IR wavelengths, from the past and present, are Akari, IRAS, ISO, SOFIA, Spitzer, and WISE (see Lutz, 2014, for a review). There are several narrow wavebands where the mid-IR emission can penetrate through the atmosphere and be detected using ground-based telescopes. However, the sensitivity of ground-based telescopes to the detection of mid-IR emission is low when compared to those from space since the mid-IR waveband corresponds to thermal emission at ≈ 100–1000 K and therefore any “hot” objects (including astronomers!) are a significant source of background noise; by comparison, space-based observatories can be efficiently cooled, reducing the thermal background noise. However, ground-based telescopes often have significantly larger mirrors than the space-based telescopes, allowing for higher-resolution imaging.
2.3.1. Broad-band continuum techniques. AGN are bright in the mid-IR waveband due to the thermal emission from warm–hot dust in the torus, which is heated by the absorption of shorter-wavelength photons from the accretion disk. The strength of the mid-IR emission from the AGN depends on the covering factor of the dust around the accretion disk (i.e., the fraction of the photons from the accretion disk that are absorbed by the dust); see Section 4.1. The optical depth is low at mid-IR wavelengths and therefore, unlike the UV–near-IR waveband, the emission is not strongly suppressed by the obscuring dust. Consequently, the completeness of the selection of obscured AGN at mid-IR wavelengths can be high, although see some of the caveats noted below. However, other astrophysical sources also produce strong infrared emission, most notably dust-obscured star formation from the host galaxy, which effects the overall reliability of AGN selection in the mid-IR waveband, particularly for lower-luminosity systems where the emission from the AGN can be weak compared to that of the host galaxy. Fortunately, the SEDs of AGN and star-forming galaxies significantly differ (e.g., star-forming galaxies have “cooler” SEDs; see Figure 1), at least for the majority of objects, and hence a variety of techniques can be employed to identify AGN from star-forming galaxies.
A common approach adopted to identify AGN at mid-IR wavelengths is to use color-color diagnostics; see Table 2 of Padovani et al. (2017) for a comprehensive list of different infrared color-color diagnostics. The basic principle behind this approach is the same as that adopted for unobscured AGN searches using UV–optical color-color diagnostics; i.e., exploiting differences between the SEDs of AGN from other astrophysical source populations. However, the key advantage that the mid-IR waveband provides over the UV–optical waveband is that both obscured and unobscured AGN are selected. The first color-color diagnostics in the infrared waveband were developed over 30 years ago using broad-band data over 12–100 µm from the IRAS observatory (e.g., de Grijp et al., 1985, Low et al., 1988). More recently, mid-IR color-color diagnostic diagrams have been developed based around the sensitive Spitzer and WISE observatories at 3–24 µm (e.g., Stern et al., 2005, Alonso-Herrero et al., 2006, Mateos et al., 2012, Assef et al., 2013). Although powerful, these color-color diagnostics do have some limitations: (1) the source needs to have a strong AGN component to be selected and hence systems with weak AGN components (e.g., intrinsically weak AGN or AGN hosted in strongly star-forming galaxies) are not easily identified and (2) the mid-IR colors of high-redshift (z > 2–3) star-forming galaxies can be similar to those of AGN and hence “contaminate” the AGN selection parameter space in the color-color diagrams. These limitations can be mitigated to a large extent by further requiring a minimum flux threshold (which removes the high-redshift star-forming galaxies, which are faint at mid-IR wavelengths) or by combining mid-IR data with far-IR data to construct broad-band infrared SEDs to search for weaker AGN components in the mid-IR waveband (see Section 2.4). In nearby systems, high spatial resolution mid-IR observations can distinguish a compact nucleus from more extended star formation and so potentially identify weaker AGN (e.g., Siebenmorgen et al., 2008). Overall, the completeness of the AGN selection in the mid-IR waveband can be high, but the reliability of the AGN selection is modest and depends on how the aforementioned caveats are handled.
A surprising result from the analysis of the mid-IR continuum of AGN is that obscured AGN have broadly similar mid-IR SEDs to unobscured AGN, both when using measurements on the scale of the whole galaxy (e.g., Buchanan et al. (2006), Mateos et al. (2012), Hickox et al. (2017); see Figure 3) and for spatially-resolved measurements on ∼ pc scales (e.g. Ramos Almeida et al., 2011, Asmus et al., 2014). This is in disagreement with that expected from the basic unified AGN model, since the presence of obscuration should suppress the mid-IR emission from an obscured AGN (with greater suppression of the shorter-wavelength emission). Indeed, it is often not possible to reliably distinguish between an obscured and unobscured AGN on the basis of just the mid-IR colors, and optical or X-ray data are required to determine whether the AGN is obscured or unobscured (e.g., Barmby et al., 2006, Hickox et al., 2007). These findings are a key driver behind the idea that the obscuring dust in AGN is not distributed in a smooth torus but is clumpy and allows for the mid-IR emission to escape from the torus without being obscured (e.g., Netzer, 2015, Ramos Almeida & Ricci, 2017); see Section 4.1. Furthermore, high spatial resolution mid-IR imaging has also revealed that a large fraction of the mid-IR emission from some obscured AGN is produced from dust in the polar regions rather than the torus (e.g., Raban et al. (2009), Asmus, Hönig & Gandhi (2016); see Figure 2 and Section 4.1.5).
2.3.2. Spectroscopic techniques. Strong discrimination between AGN and star-forming galaxies can be achieved using mid-IR spectroscopy. The “hotter” radiation field from the accretion disk, when compared to that from star-forming regions, means that the detection of high excitation emission lines (e.g., [Ne VI] 7.6 µm; [Ne V] 14.3 µm; see Spinoglio & Malkan 1992) provides an almost unambiguous identification of AGN activity. However, the equivalent width of these high-excitation emission lines is often low when compared to emission lines at UV–optical wavelengths, making them sometimes challenging to detect. Despite this, the low optical depth at mid-IR wavelengths (e.g., Draine, 2003) facilitates the detection of emission lines in heavily dust-obscured regions where the UV–optical signatures of AGN activity are extinguished (e.g., Satyapal et al., 2008, Goulding & Alexander, 2009, Pereira-Santaella et al., 2010). Overall, this technique provides an obscured AGN identification approach with high completeness and reliability; however, the lack of large-scale mid-IR spectroscopic facilities mean that the sample sizes are currently small when compared to those available from UV–optical spectroscopy.
The mid-IR spectra of AGN and star-forming galaxies also differ in the strength of the broad-band spectral features due to polycyclic aromatic hydrocarbon (PAH) molecules (e.g., Tielens, 2008). PAHs appear to be ubiquitous in the interstellar medium of galaxies (e.g., Peeters, Spoon & Tielens, 2004, Smith et al., 2007) and are broadly correlated with the star-formation component of galaxies. As a consequence, the equivalent width of the PAH features can be used to assess the relative strength or weakness of emission from the AGN in the mid-IR waveband. An advantage of this approach is that lower resolution mid-IR spectroscopy can be employed than that required for the detection of emission lines since the PAH features have large equivalent widths (e.g., Genzel et al., 1998, Pope et al., 2008). Weak AGN components can be identified with this approach and it is particularly effective when combined with mid-IR–far-IR photometry to provide a broader wavelength baseline to constrain the strength of both the AGN and star-formation components; see Section 2.4.
Mid-IR spectroscopy can provide a reliable route to measure the amount of obscuration towards the AGN. The primary spectroscopic diagnostic is a strong absorption feature due to Si-based dust grains at 9.7 and 18 µm (e.g., Draine & Lee, 1984). The depth of the Si absorption feature provides an estimate on the amount of obscuration towards the mid-IR emitting region of the AGN. Obscured AGN are often found to have Si absorption features while unobscured AGN typically have Si emission features (e.g., Hao et al., 2007, Hatziminaoglou et al., 2015, Alonso-Herrero et al., 2016). Overall a broad correlation is found between the strength of the Si absorption and the absorbing column density measured using X-ray data (e.g., Shi et al., 2006, Hönig et al., 2010). The presence of strong Si absorption is therefore sometimes taken as an indicator for a obscured AGN, revealing potentially extremely obscured AGN that lack AGN signatures at other wavelengths (e.g., Imanishi et al., 2007, Georgantopoulos et al., 2011). However, not all obscured AGN have strong Si absorption, including perhaps half of the Compton-thick AGN population, and the origin of the Si absorption feature often appears to be due to dust in the host galaxy rather than the torus (e.g., Goulding et al., 2012).
| COMMON FAR-IR–RADIO SELECTION CRITERIA
FOR OBSCURED AGN
Commonly used criteria for identifying AGN in this waveband include:
Due to low optical depth in the radio, most criteria to classify AGN as obscured rely on other wavebands after identification in the radio, but one technique is the detection of absorption from neutral hydrogen determined through the 21-cm line. |
2.4. Selection of obscured AGN at far-infrared–radio wavelengths
AGN produce emission across a broad range of wavelengths and therefore obscured AGN can be selected at wavebands not explored so far in this review; see Figure 1. The far-IR–radio waveband, in particular, provides the potential for many significant advances over the selection of obscured AGN at other wavelengths, principally because the optical depth is very low at these wavelengths (Hildebrand, 1983), allowing for even the most heavily obscured AGN missed in the X-ray and mid-IR wavebands to be selected. However, the full potential of these wavebands for the selection of obscured AGN is yet to be realised due to the relatively modest sensitivities of current facilities. A summary of far-IR–radio methods for identifying obscured AGN is given in the sidebar on “Common far-IR–radio selection criteria for obscured AGN”, and we discuss them in detail below.
2.4.1. Far-infrared–millimeter wavelengths. The continuum emission at far-IR–millimeter wavelengths (30 µm–10 mm) from the majority of AGN is dominated by dust heated from star formation in the host galaxy. This limits the effectiveness of AGN identification on the basis of far-IR–millimeter photometry alone. However, when the mid-IR photometry is combined with the far-IR–millimeter photometry to construct the broad-band IR–millimeter SED, the signature of an AGN component can be identified through fitting the SED with AGN and star-forming galaxy templates or models. This approach can potentially identify weaker AGN components than that achieved through mid-IR photometry alone (e.g., Pope et al., 2008, Sajina et al., 2012, Del Moro et al., 2016) and is particularly effective when combined with mid-IR spectroscopy (see Section 2.3.2).
Obscured AGN can also be identified using dense molecular gas tracers with (sub)-millimeter spectroscopy (e.g., HCN and HCO+; Gao & Solomon (2004), Aalto et al. (2015), Imanishi, Nakanishi & Izumi (2016)). These emission lines from dense molecular gas are radiatively excited by mid-IR photons and can therefore reveal the presence of an obscured AGN. A similar technique uses observations of CO lines, for which the relative strengths of the rotational transitions depend on the excitation mechanism, and a high ratio of high-excitation to low-excitation CO lines can indicate heating from an AGN (e.g., Rosenberg et al., 2015, Mingozzi et al., 2018). Since the optical depth is very low even for Compton-thick levels of absorption at (sub)-millimeter wavelengths (Hildebrand, 1983), heavily obscured AGN missed at other wavelengths can be identified using (sub)-millimeter spectroscopy (e.g., Aalto et al., 2015, Imanishi, Nakanishi & Izumi, 2016); however, dilution from star formation within the host galaxy will weaken the AGN signature. This approach offers great potential to extend our census of obscured AGN, although given the sensitivity of current facilities, the majority of obscured AGN searches with this technique are limited to comparatively nearby systems.
2.4.2. Radio wavelengths. The identification of AGN in the radio waveband (≈ 0.01–30 m) has a long history going back to the first detected quasars (e.g., Baade & Minkowski, 1954, Schmidt, 1963). The dominant physical process for AGN in the radio waveband is synchrotron emission, which can be due to processes related to the accretion disk and/or large-scale radio jets (see Padovani (2016), Tadhunter (2016) for a recent review). The optical depth for radio emission is very low and so radio selection can identify very heavily obscured sources (e.g., Wilkes et al., 2013), although synchrotron self absorption can occur in compact radio-emitting sources and H I absorption is seen at 21 cm (the spin-flip transition). However, AGN are not the only extragalactic source population that can produce significant radio emission: star-forming galaxies can also be bright in the radio band (e.g., Condon, 1992).
At the highest radio luminosities (e.g., > 1025 W Hz−1 at 1.4 GHz) AGN are uniquely distinguished from star-forming galaxies: these sources are often referred to as “radio-loud” AGN and comprise a minority of the overall AGN population, which is predominantly radio quiet (e.g., Padovani, 2016, Tadhunter, 2016). At lower radio luminosities AGN cannot be reliably distinguished from star-forming galaxies on the basis of luminosity alone. However, since the radio luminosity from star formation is tightly correlated with the far-IR luminosity (e.g., Helou, Soifer & Rowan-Robinson, 1985, Condon, 1992), AGN can be identified by selecting sources that produce excess radio emission over that expected from star formation (e.g., Donley et al., 2005, Del Moro et al., 2013). When multi-frequency radio data are available, the radio spectral slope can also be used to identify AGN activity: a flat radio spectral slope (α < 0.5; e.g., Padovani 2016) indicates a compact source (synchrotron self absorbed) and therefore an AGN with a steep radio spectral slope can be due to either AGN activity or star formation. Higher spatial resolution data (e.g., very long baseline interferometry data) can also be used to identify the presence of AGN activity over star formation: an unresolved radio core, radio jets, and radio lobes indicate the presence of an AGN (e.g., Padovani, 2016, Tadhunter, 2016). Radio wavelengths can therefore provide reliable obscured AGN selection with high completeness, particularly at high radio luminosities. However, the reliability of the obscured AGN selection in the radio band decreases towards lower luminosities and depends on the luminosity of the radio core and the multi-wavelength data available.
The radio waveband can also provide reliable absorption measurements. The identification of the neutral H I absorption feature at 21 cm provides a measurement of the H I column density towards the radio-emitting source. Current studies suggest a connection between the neutral H I absorbing column at 21 cm with the absorbing columns measured in the X-ray band (e.g., Ostorero et al., 2016, Moss et al., 2017); however, the current sample sizes are small and greater progress will be made with future radio facilities such as the Square Kilometer Array (SKA); see Section 6.1.5.
2.5. Multi-wavelength identification and a comparison of selection methods
No single waveband provides a complete and reliable selection of AGN with current facilities. The low optical depth at mid-IR–radio wavelengths ensures weak obscuration effects and hence high obscured-AGN completeness, although contamination of the AGN emission from the host galaxy reduces the reliability of the AGN selection when the host galaxy is bright with respect to the AGN. The reliability of the AGN selection at mid-IR–radio wavelengths can be significantly improved with high spatial resolution observations, where the relative contrast between the AGN and the galaxy will be higher, and from spectroscopic observations, where the identification of emission lines and solid-state features provide constraints on the relative strength of the AGN and host-galaxy emission processes. However, the availability of high spatial resolution and spectroscopic observations at mid-IR–radio wavelengths is limited when compared to broad-band photometric data. By comparison, UV–optical spectroscopy is often more readily available (thanks to ground-based multi-object spectrographic instruments) and can select AGN with good reliability and completeness but is biased against identifying AGN that reside in galaxies that are either strongly dust obscured or bright when compared to the AGN. The X-ray waveband has low optical depth, particularly in the hard band, and the host-galaxy contamination is low, allowing for the reliable selection of obscured AGN except for low-luminosity systems; however, Compton-thick AGN are weak and can be challenging to identify at X-ray energies.
Due to the limitations in the identification of obscured AGN in any given waveband, a more complete selection will be achieved from a combination of multi-wavelength identification approaches. For example, an AGN selection approach that combines X-ray, infrared, and radio data (e.g., such as that available for many of the blank-field extragalactic survey areas) will reduce the identification biases of any individual waveband. Such an approach would allow for the identification of X-ray detected Compton-thin AGN even in strongly star forming galaxies, the identification of potential infrared-bright Compton-thick AGN from the weak or non detection of X-ray emission, and the identification of radio-bright AGN that are heavily obscured in both the X-ray and infrared wavebands (e.g., Hickox et al., 2009, Del Moro et al., 2013, Del Moro et al., 2016). In Figure 8 we demonstrate the complementarity of infrared and X-ray data in identifying potential Compton-thick AGN from the detection of bright mid-IR emission from the AGN with weak or undetected X-ray emission (e.g., Alexander et al., 2008, Vignali et al., 2010, Lansbury et al., 2015, Lansbury et al., 2017). Combining these multi-wavelength data with spectroscopic observations would provide an even more complete selection of obscured AGN.
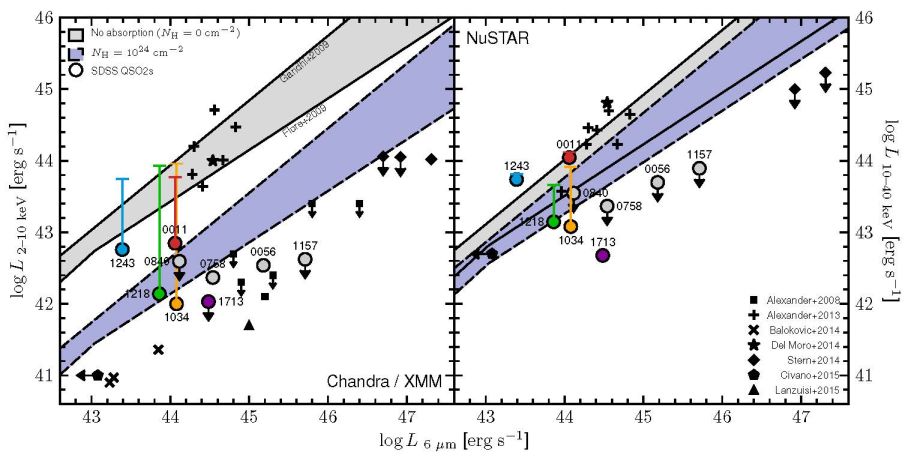 |
Figure 8. X-ray luminosity versus 6 µm AGN luminosity for AGN explored in a variety of studies using (left) Chandra or XMM-Newton soft-band (2–10 keV) constraints and (right) NuSTAR hard-band (10–40 keV) constraints. The symbols indicate the observed X-ray luminosities and the solid vertical lines indicate the intrinsic (i.e., corrected for absorption) X-ray luminosities for the sources with absorbing-column measurements. The grey shaded region indicates the range in intrinsic X-ray–6 µm AGN luminosity relationships between Fiore et al. (2009) and Gandhi et al. (2009) and the blue shaded region indicates the same relationships but where the X-ray luminosity is absorbed by a column density of NH = 1024 cm−2. Taken from Lansbury et al. (2015), courtesy of G. Lansbury. |
However, despite the obvious advantage of a multi-wavelength approach in terms of providing a more complete selection of AGN, the relative simplicity of the single waveband approach does have a key attribute: a simple selection function. The selection function is the quantification of the sensitivity and identification biases and will be much simpler for a single waveband approach than for a multi-wavelength approach. Therefore, if the effect of obscuration and host-galaxy dilution is well understood in the selected waveband then it can be used to model the data and infer the properties of the overall AGN population (i.e., taking into account the AGN not selected due to sensitivity and identification biases). We have emphasized model and infer here since this approach is model based (e.g., it makes assumptions about the AGN and host galaxy properties, an example being the distribution of AGN absorbing column densities) and the complete AGN population is inferred rather than directly identified. For complex selection functions that depend on several variables, an effective technique is to simulate the overall AGN population and then apply the same identification procedure to the simulated data; this technique is commonly referred to as “forward modeling”; see Section 6.2. The selection function is then the difference between the input and the output (i.e., the overall AGN population and the subset of the AGN population that are identified).
Multi-wavelength and single-waveband identification approaches are therefore complementary. The multi-wavelength approach can construct a (near) complete census of AGN in, for example, a given volume down to a given luminosity. It requires more extensive data than the single-waveband approach and will likely be limited in the volume–luminosity parameter space that it can cover. However, the knowledge of the AGN properties gained from this approach can then guide the modeling required to infer the overall AGN population from a single waveband approach, which requires less extensive multi-wavelength data and can extend over larger regions of parameter space. One application of this approach is constraining the properties of the Compton-thick AGN population. X-ray data are essential in identifying Compton-thick AGN as it is required to constrain the absorbing column density. However, a flux-limited X-ray survey is biased against detecting Compton-thick AGN due to the suppression of the X-ray emission and, therefore, significant corrections are required to infer the overall Compton-thick AGN population (e.g., an observed fraction of ≈ 8−2+1 % vs an intrinsic fraction of ≈ 27 ± 4% from the hard-band selected Swift-BAT survey; Ricci et al. 2015; see Figure 9). The multi-wavelength identification and characterisation of all AGN, including measuring (or inferring) the absorbing column densities, within a given volume (e.g., Goulding & Alexander, 2009, Annuar et al., 2015, Annuar et al., 2017) is therefore essential to validate the modeling assumptions adopted in the single waveband approach. Furthermore, since all of the AGN are identified and characterised in the volume-limited study, it will include systems that have abnormal properties or are intrinsically weak in any given waveband, extending our understanding of the overall AGN population.
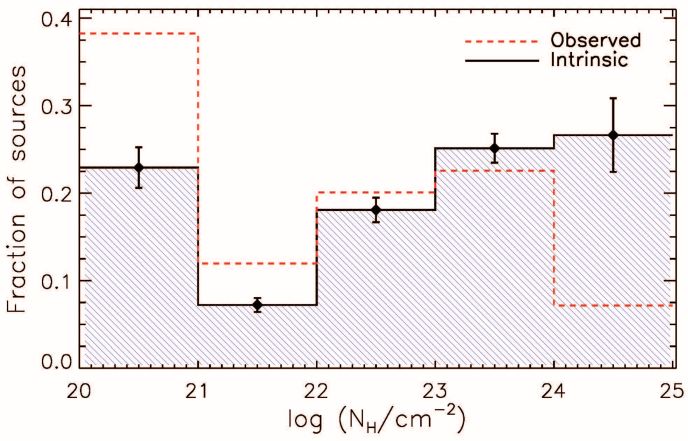 |
Figure 9. Distribution of absorbing column densities (NH) for local AGN from the Swift-BAT survey. Both the observed distribution (red dashed line) and the intrinsic distribution after correction for selection effects (black solid line) are shown. A comparison between the two distributions demonstrate the large corrections required to determine the intrinsic fraction of Compton-thick AGN with NH = 1024 – 1025 cm−2. Figure from Ricci et al. (2017b), courtesy of C. Ricci. |