


Cosmological information comes from many sources. However, at the present time, the CMB dominates the constraints on the SMC. This “era of precision cosmology” can be seen through plots of the current status of the power spectra coming from the CMB. Figure 1 shows the TT (which dominates the information) and TE (which is catching up) spectra, while Fig. 2 shows the EE (now also impressive) and BB (still in its infancy) spectra. The grey line is the 6-parameter ΛCDM model fit to the Planck TT data, and one can see how well it matches the other power spectra.
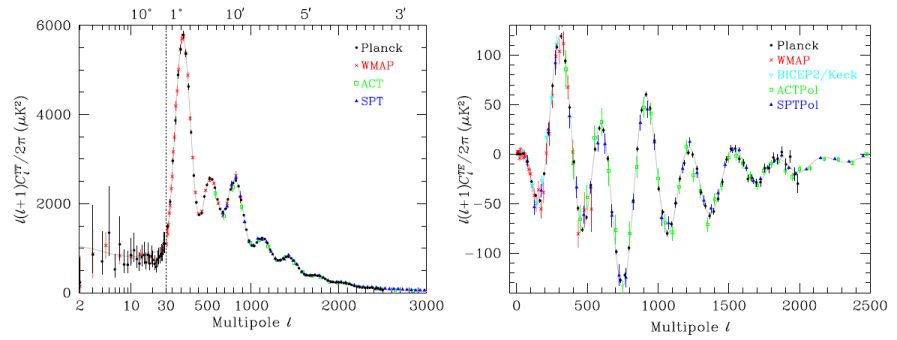 |
Figure 1. CMB temperature anisotropy power spectrum (left) and temperature-polarisation cross-power spectrum (right), from Planck, WMAP, BICEP/Keck, ACT and SPT (see Ref. [9] for full references). This demonstrates the current precision with which these power spectra have been measured. |
When we add up the total (S / N)2 from the Planck CMB power spectra, over the part of the sky conservatively believed to be free of foreground emission, we find that the Planck TT, TE and EE measurements together correspond to about 900 σ. Adding the higher multipole measurements from ACTPol and SPTPol means that today's CMB power spectrum determinations together represent more than 1000 σ of detection. If we were skeptical about the success of the SMC, then we should take note that it requires just a few simplifying assumptions and seven free parameters to fit this huge amount of information – quite a remarkable achievement.
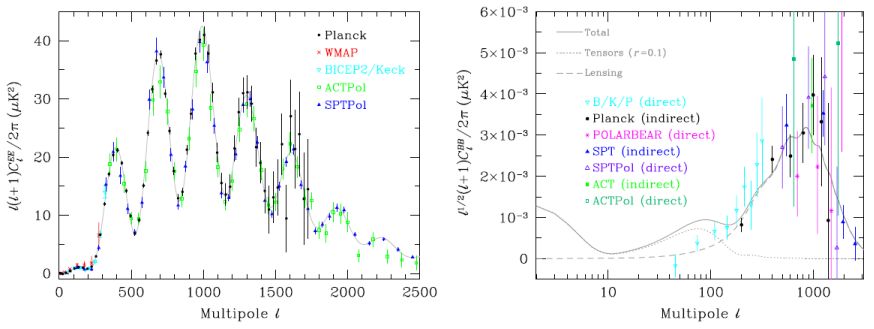 |
Figure 2. Polarisation EE (left) and BB (right) power spectra from several experiments (see Ref. [9] for references). The BB spectrum here is scaled by a power of ℓ that makes it possible to see all three of the expected peaks (from reionisation, recombination and lensing). |
How does the constraining power of the CMB work? The simple answer is that it just depends on the number of modes that are measured, where the mode amplitudes aℓ m come from expanding the sky as T(θ,φ) = ∑ℓ m aℓ m Yℓ m. Since the anisotropies are Gaussian, then each aℓ m gives just a little bit of information about the expectation value of the power in the aℓ ms, Cℓ (or equivalently, the variance), and the total constraining power is just about counting the number of modes. In more detail, if we have a cosmic-variance-limited experiment, with Δ Cℓ = √2 / (2ℓ + 1) Cℓ, then the total signal-to-noise ratio in the power spectrum is
 |
(1) |
But since the number of modes is just ∑ℓ = 2 ℓmax ∑m = −ℓ + ℓ, then this means that the total (S / N)2 is just half the number of modes.
To the extent that through Planck, we've measured all the modes out to ℓ ≃ 1500 (over a large fraction of the sky), and the damping plus foregrounds means that we can't go far beyond ℓ ≃ 3000 (say) for primary CMB anisotropy measurements, then we're a good way through gathering all the information we can get from CℓTT. But what about polarisation? Assuming for the moment that CℓBB is negligible, then the existence of both CℓTE and CℓEE would seem to confuse matters. But really the situation is simply that we can measure the scalar field E, in addition to T, for each pixel. And hence, provided that we measure both CℓTE and CℓEE out to some ℓmax, then we have exactly twice as much information as we would obtain from CℓTT alone. This means that the total “information content” can be defined to be just a count of the number of modes probed, in any of the CMB fields.
Of course not all information is equal. For example, any large-angle BB measurement would provide us with an entirely new kind of information, enabling us to determine an additional parameter (r, the tensor-to-scalar ratio) that is otherwise hard to constrain. Moreover, it is well known that adding polarisation data helps to break some parameter degeneracies. So we'd like to know how the parameter constraints map onto the power spectrum modes. The proper way to discuss this is through the Fisher matrix, which includes derivatives of the power spectra with respect to the cosmological parameters; this is demonstrated in Fig. 3 and discussed fully in Ref. [10]. One can see that some multipole ranges are particularly important for some parameters, and as we go up in ℓ, so that new peaks or troughs are included, the constraining power can change dramatically.
 |
Figure 3. Square of signal-to-noise ratio for each multipole, for a cosmic-variance-limited experiment covering half the sky. The results for the TT, TE and EE power spectra are shown on panels for each of the six parameters of the SMC, with a logarithmic horizontal axis for the first 30 multipoles. Vertical lines mark peaks and troughs in the TT power spectrum. These panels show the complex mapping of power spectrum constraints onto parameters over different multipole ranges. |
To focus on one example, the behaviour of the As panel is simple – if there was only an overall normalisation to measure, then the constraints would just come from the S/N (and mode counting) expression given in Eq. (1), with polarisation giving equal constraining power to temperature. In that sense, As is a “linear” parameter, since there is a simple relationship between its total S / N and the parameter constraint. However, if the dependence is less trivial, then the relationship is “non-linear”, and hence the way that the total (S / N)2 is shared out among the parameters is more complicated. A good example is θ∗, which determines the amount by which the power spectra can be slid left and right in multipole – this can be determined to great precision (because of the relative sharpness of the acoustic peak structure), which is why this is the best determined parameter of the SMC today. In fact the total S / N in θ∗ from Planck is around 2500, which is considerably more than the total S / N in the power spectra!
CMB polarisation has yet to become particularly constraining for the parameters of the SMC. But that situation will change as new experiments add modes, doubling at least (or more, since high-ℓ E-mode measurements are not as limited by foregrounds) the information achievable from temperature alone, and providing specifically useful degeneracy-breaking capability. The discussion above can be extended to the BB spectrum, as well as the lensing spectrum Cℓφφ (which comes from the temperature trispectrum, and gives an additional field, φ). This approach is useful for discussing future experimental constraints, and how they map onto parameters. But one thing it tells us is that eventually we'll run out of CMB information. This is essentially because the CMB information is almost entirely restricted to two dimensions. The same thinking can also inform discussions of more ambitious attempts to extract the much larger amount of information contained in 3d surveys – around (c kmax / H0)3, if we can get all the k modes down to scales kmax [11]. This means that in principle we could one day measure enough modes to give ≫106 σ of power detection.