


Models of the galaxy–halo connection that parameterize this relationship using Mh only have been highly successful in modeling observational data. However, the question remains of just how far the mass-only approach can go to represent the observed galaxy distribution when incorporating galaxy properties other than M∗ and luminosity. The main emphasis of this section is on models of galaxy bimodality: dividing the observed population into blue, star-forming objects and red-and-dead passively evolving galaxies. Section 6.1 reviews current constraints on the SHMR divided along these two lines, while Section 6.2 reviews the pursuit of observational signatures of galaxy assembly bias in galaxy bimodality and galaxy properties other than mass. Section 6.3 discusses how the galaxy–halo connection can explain the observed correlation between bimodality and large-scale environment. Finally, Section 6.4 discusses the correlation between galaxy size and halo mass.
6.1. Stellar-to-Halo Mass Relations for star-forming and passive central galaxies
At present, there is no consensus on the difference in SHMRs between star-forming (blue) and passive (red) central galaxies at z = 0. Several examples of estimates of this ratio as a function of halo mass are shown in Figure 10. All of these data are based on the SDSS galaxy sample, but they represent a myriad of analysis techniques, including satellite kinematics (More et al., 2011), empirical abundance modeling (Moster, Naab & White, 2018), two-point clustering and abundances (Rodríguez-Puebla et al., 2015), a combination of weak lensing with clustering (Zu & Mandelbaum, 2016), and the forward-modeling Universe Machine of Behroozi et al. (2018). All of these analyses constrain the SHMRs for both subsamples, but for brevity we plot their ratio. These studies find a range of results, including that the quantity M∗red / M∗blue can be both above or below unity, with one study finding no difference in the SHMR for the two sub-populations. Conditional abundance matching models of color make different predictions depending on the exact procedure and which halo properties are chosen to match to. Different models can predict, at fixed Mh, that passive galaxies can be either more massive, less massive, or the same as star-forming galaxies.
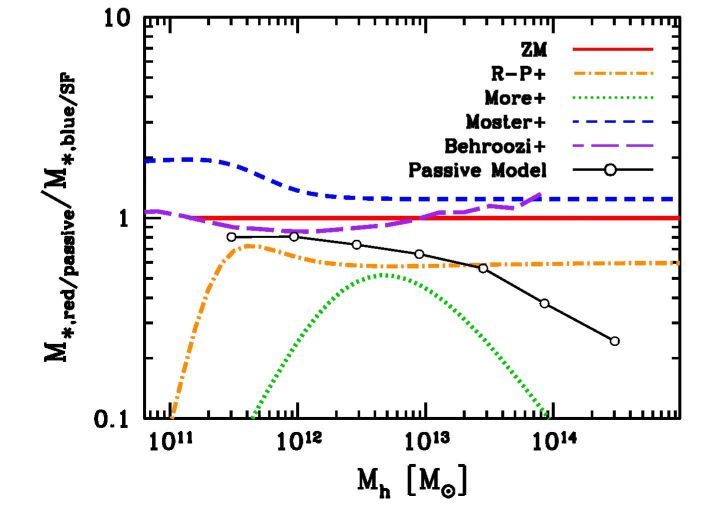 |
Figure 10. The ratio of the SHMR for quenched (red) and star-forming (blue) galaxies at z = 0 from various analyses in the literature. All results are for central galaxies only. As the figure demonstrates, there is not yet consensus between approaches. Results here come from Zu & Mandelbaum (2016), Rodríguez-Puebla et al. (2015), More et al. (2011), Moster, Naab & White (2018), and Behroozi et al. (2018). See the text for discussion of the various methods involved. The solid black line with open circles is the prediction of the passive quenching model. Each of these studies separately constrain the SHMRs for star-forming and passive galaxies, but here we plot the ratio for brevity. |
As a simple benchmark for interpretation and comparison to observations, the connected open circles represent a passive quenching model. In this model, galaxies come off the star-forming sequence randomly and evolve passively, independently of their halo's growth — i.e., the galaxy within a fast-growing 1012 M⊙ halo is just as likely to quench as a slow-growing halo of the same mass. Between z = 1 and z = 0, the halos grow independently of the state of their central galaxies: the red-sequence galaxies have minimal stellar mass growth, whereas the star-forming galaxies continue to add to their stellar mass. Thus, even if SHMRred / SHMRblue=1 at z = 1, by z = 0 they will be different. The red galaxies will be less massive than the blue galaxies at fixed Mh. The predictions of this model are also shown in Figure 10. The indicated trend with mass is expected from the buildup of the red sequence; passive central galaxies at low M∗ have only recently arrived on the red sequence, but massive galaxies quench at very early times, thus there is a large fraction of the age of the universe over which blue galaxies can build up substantially more mass than the quenched galaxies in the same halos.
To yield a M∗red / M∗blue ratio different than the passive model, the assumption that galaxy quenching is uncorrelated with halo formation history must break down. Whether or not this breakdown yields galaxy assembly bias in galaxy bimodality — which we have defined as a spatial correlation of galaxy properties (other than mass) at fixed Mh — is an open question we examine further in this section. Current constraints clearly deviate from the predictions of the passive model. However, given the lack of agreement between z = 0 studies, we conclude that the M∗red / M∗blue ratio and its dependence on halo mass remains an open question.
The differences in these results may come from a myriad of sources. In each approach there are different modeling assumptions, and each uses different statistical quantities to constrain the SHMRs. Each uses different estimates of galaxy stellar mass. Moster, Naab & White (2018) and Behroozi et al. (2018) use star-formation rate to classify galaxies, whereas the other studies use broadband colors, which can lead to heterogeneous samples. To create progress, each of these assumptions will have to be tested to understand the impact on the SHMR constraints.
One question there is near-consensus on is: Does the SHMR for star-forming galaxies have a pivot point? This question is important because it has consequences for galaxy feedback and the source of the pivot point in the overall SHMR — is the overall pivot point due to more massive galaxies being quenched, or do star-forming galaxies also undergo a transition at 1012 M⊙, above which star formation is less efficient even though they are actively star-forming? With the exception of the results from satellite kinematics, which have large error bars at high Mh, all of the analyses in Figure 10 find that star-forming galaxies do indeed have a pivot point.
The preceding discussion has focused on central galaxies, but satellite galaxies are a major component of the quenched population. Analyses from groups and clusters find that, at all M∗, satellites have a higher quenched fraction than centrals, and that at fixed M∗, the quenched fraction of satellites monotonically increases with Mh (see, e.g., Yang, Mo & van den Bosch 2008, Peng et al. 2010, Wetzel, Tinker & Conroy 2012, Wetzel et al. 2013, Wang et al. 2018). The interpretation of this is that the quenching efficiency of satellites is higher than that of central galaxies. Indeed, while there are quenched satellite galaxies at any value of M∗, Geha et al. (2012) found that below the limit of M∗ ≈ 109 M⊙, no isolated central galaxies are quenched.
6.2. How does assembly bias manifest observationally for secondary properties?
If secondary galaxy properties correlate with secondary halo properties that exhibit assembly bias, then this could be detectable in the spatial distribution of galaxies. In this subsection we review results of observational signatures of galaxy assembly bias, focusing on galaxy quenching and galactic conformity. We further compare recent results to predictions from galaxy formation models.
6.2.1. Galaxy assembly bias and galaxy quenching Most emphasis to date regarding observational signatures of galaxy assembly has focused on the galaxy bimodality and whether a galaxy is star-forming or quenched. We demonstrated in the preceding section that studies of the SHMRs for star-forming and passive galaxies are inconclusive. Here we review searches for galaxy assembly bias by directly probing the spatial distribution of galaxies.
There have been a number of investigations looking for assembly bias in the clustering of red and blue galaxies using group catalogs to estimate halo mass, including Yang, Mo & van den Bosch (2006), Wang et al. (2008), Lacerna, Padilla & Stasyszyn (2014). We regard these results as too susceptible to biases from the group catalog to be reliable. Campbell et al. (2015) looked in detail at the results of state-of-the-art group finders and how they assign halo masses to galaxies separated by color. They found that halo masses can be highly biased, possibly explaining differing results in the previous studies. Additionally, Lin et al. (2016) used weak lensing to determine unbiased halo mass estimates of galaxy groups — using the Yang, Mo & van den Bosch (2009) group catalog — split into red and blue central galaxies. Lin et al. (2016), focusing on groups at Mh∼ 1012 M⊙, found that groups labeled with the same halo mass from the group finder yield different lensing signals, indicating larger halo masses in the groups with red central galaxies. Thus, using the halo masses assigned by the group finder could lead to a spurious detection of assembly bias by yielding a higher clustering amplitude for the groups with red centrals. In contrast, when using lensing measurements to create samples with the same Mh, the clustering of groups with red central galaxies was the same as the clustering of groups with blue central galaxies.
6.2.2. Galactic Conformity Galactic conformity is the phenomenon that the properties of neighboring galaxies are correlated with — i.e., they ‘conform to’ — the properties of nearby central galaxies. Conformity studies are usually focused on the color or star formation rates of galaxies. They are divided into two distinct, but possibly correlated, spatial regimes: When the neighboring galaxies of a given central are within the same dark matter halo, this is called one-halo conformity. When the neighboring galaxies are outside the halo virial radius of the central galaxy, this is called two-halo conformity. Conformity can be quantified in a number of ways, but a straightforward test is to look at central galaxies of a given M∗, divided into star-forming and passive samples. The quenched fractions, fq, of neighbors is measured around each of the central subsamples. If fq for the neighbors around passive centrals is higher than fq for the neighbors around star-forming centrals, this is a detection of conformity.
The attention on galactic conformity is driven in part by the possible connection to halo and galaxy assembly bias. For the one-halo term, it is possible to posit quenching mechanisms for central galaxies that also impact the quenching efficiency of satellites. In such a model, the conformity need not be related to assembly bias. But if quenching of central galaxies is related to halo formation history, then it will also be related to the accretion history of satellites — i.e., old parent halos will have old central galaxies as well as old subhalos. Additionally, Hearin, Watson & van den Bosch (2015) proposed two-halo galactic conformity as a sensitive test of galaxy assembly bias. The formation histories of neighboring halos are correlated. Thus, if these formation histories are correlated with quenching mechanisms, two-halo conformity will be present. It is possible to have one-halo conformity without the presence of two-halo conformity, but two-halo conformity by itself necessarily produces a one-halo effect: the satellites in the z = 0 universe were themselves once neighbors in the field before being accreted.
The first detection of conformity was presented by Weinmann et al. (2006), looking at satellites (the neighbors) around central galaxies in the 1-halo regime using a galaxy group catalog from z = 0 SDSS data. They found that, at fixed halo mass, the fq of satellite galaxies was higher when the central was quenched itself, with Δ fq ∼ 0.1–0.2 between passive and star-forming central galaxies. Other analyses have found similar results (e.g., Knobel et al. 2015, Kawinwanichakij et al. 2016, Berti et al. 2017). However, subsequent studies have examined possible systematic biases in the use of the group catalogs to identify halos. Campbell et al. (2015) demonstrated that errors in the estimated halo masses can create a false 1-halo conformity signal. Calderon, Berlind & Sinha (2017) showed that the 1-halo Δ fq found in SDSS data was consistent with this false signal, which is shown in left panel of Figure 11. These tests assessing the impact of observational biases do not take into account the possibility that quenched central galaxies live in more massive halos at fixed M∗, which would also induce a 1-halo conformity signal with no galaxy assembly bias, as found in the semi-analytic galaxy model of Wang & White (2012).
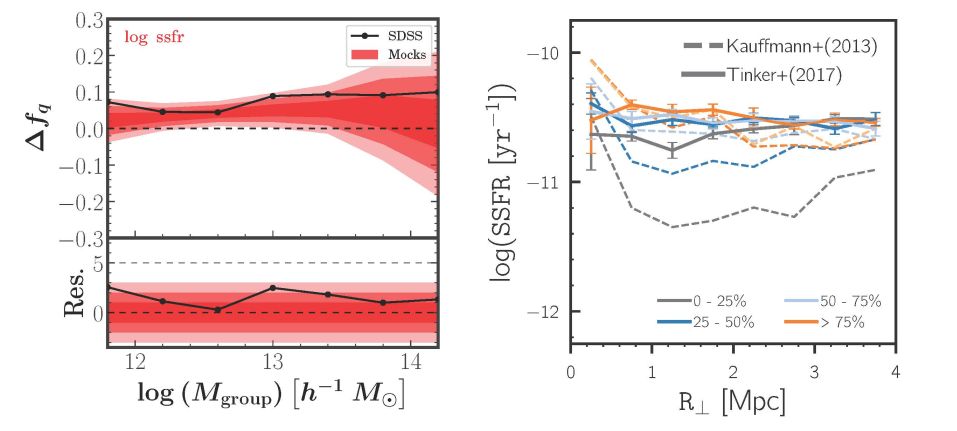 |
Figure 11. Left Panel: One-halo conformity. The connected black points are measurements of Δ fq from SDSS groups, defined as the difference in the quenched fraction of satellite galaxies when the central galaxy is passive and when it is star-forming (see text for further details). Δ fq > 0 nominally indicates conformity. The shaded regions indicate 1-3σ contours from repeating the analysis on mock catalogs with no intrinsic conformity in them. The positive value of Δ fq is consistent with that found in mocks, indicating that the conformity seen in the data is from biases in the group catalog. Figure taken from Calderon, Berlind & Sinha (2017). Right Panel: Two halo conformity signal in SDSS galaxies as a function of scale. The curves show the median specific star formation rates (SSFR) for neighbors around central galaxies that are binned by their own SSFR. The bins are defined by their rank order in SSFR as indicated in the panel. The SSFR of the neighbors is measured as a function of projected separation from the central galaxy. The dashed curves show the result of Kauffmann et al. (2013), which was reproduced in Tinker et al. (2018). The solid curves show the result after removing a small number of satellite galaxies that the Kauffmann isolation criteria did not reject. Figure taken from Tinker et al. (2018). |
The first detection of two-halo conformity was presented by Kauffmann et al. (2013). Their approach to conformity was to identify central galaxies through an isolation criterion, then rank order the central galaxies by their specific star formation rates (sSFRs) and calculated the median sSFR of neighbor galaxies for each quartile in the central sSFR. The measurements showed a substantial decrease in the sSFR of neighbor galaxies around the lowest star-forming central galaxies out to 4 Mpc. However, further studies by Tinker et al. (2018) and Sin, Lilly & Henriques (2017) have shown this effect to be primarily a selection bias in the isolation criterion. The right-hand panel in Figure 11 compares the original Kauffmann et al. (2013) result to a new analysis when the small fraction of satellite galaxies are removed from the original sample of ‘isolated’ galaxies.
Other studies using quenched fractions (Berti et al., 2017) and marked correlation functions (Calderon, Berlind & Sinha, 2017) have found statistically significant two-halo signals, but are small in their actual amplitude, implying Δ fq ∼ 1%. At this level, it is not clear if the conformity signals found indicates galaxy assembly bias or if they can be explained by various systematic issues (Tinker et al. (2018)). Using the conditional abundance matching framework of Hearin & Watson (2013), Tinker et al. (2018) compared various implementations of the age-matching model to measurements of two-halo conformity in SDSS galaxies. The low level of two-halo conformity measured in SDSS is inconsistent with a model in which galaxy quenching correlates strongly with halo formation time or similar secondary halo properties. Current data cannot rule out any correlation between these two quantities a z = 0, but the correlation can only be weak at best. Similar conclusions were reached by Zu & Mandelbaum (2016), Zu & Mandelbaum (2018), and Tinker et al. (2017c).
6.2.3. Comparison with physical models Results from the EAGLE hydrodynamic simulation (Matthee et al. (2017)) and semi-analytic models (Croton, Gao & White (2007), Tojeiro et al. (2017)) both show a clear correlation of halo age with total stellar mass of the central galaxy. At fixed Mh, early-forming halos form more massive galaxies, whereas later-forming halos form less massive ones. This theoretical prediction is in agreement with Zentner et al. (2016) and Lehmann et al. (2017), both of which claimed to detect galaxy assembly bias in the total stellar mass of galaxies (under the assumption that more massive galaxies are brighter, which is true for star-forming galaxies but less clear for a mixture of active and passively evolving galaxies).
Analyzing star-forming central galaxies (i.e., removing all passive galaxies from the sample) from an SDSS group catalog, Tinker et al. (2017b) found a correlation between SSFR and large-scale density at fixed M∗. These observations were consistent with a conditional abundance matching model in which sSFR was matched to halo growth rate: faster growing halos corresponded to higher-than-average star formers. This agrees with the basic ansatz of empirical models based on using the time-dependent SHMR to infer galaxy sSFR. Note that these results would not imply large-scale conformity in the quenched fraction of galaxies, since this is only found within the star-forming sub-population. Behroozi, Wechsler & Conroy (2013a) and Moster, Naab & White (2013) predict that the efficiency of converting accreted baryons into stars for halos with Mh < 1012 M⊙ peaks at late times. For halos with the same z = 0 value of Mh, late-forming halos accrete a higher fraction of their baryons at late times, when this baryon conversion efficiency is maximal. Thus, late-forming halos should have higher stellar masses than early-forming halos, an opposite effect from that seen in the theoretical models. To resolve this situation, further analysis is needed on both the theoretical and observational sides; analyses of clustering using stellar-mass limited samples, marginalizing over cosmological parameters, are required. Predictions of observables from the theoretical models need to be quantified. Observational methods of determining individual halo masses of low-mass field galaxies would be a particularly useful tool.
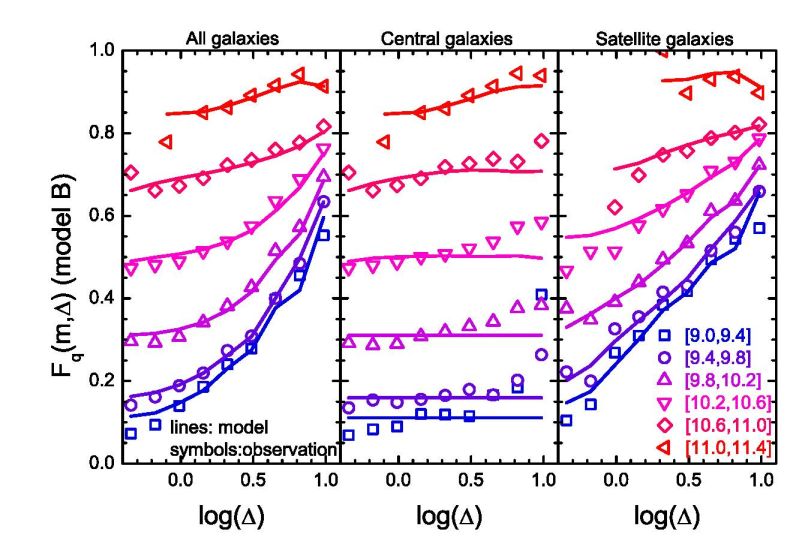 |
Figure 12. The dependence of the galaxy quenched fraction, here expressed as Fq, on large-scale density, Δ, measured on ∼ 6 Mpc scales. The three panels show the relation for all galaxies, central galaxies, and satellite galaxies. Open symbols are measurements from SDSS using the Yang, Mo & van den Bosch (2009) group catalog, whereas solid curves are predictions from a model in which galaxy quenching is only driven by Mh, and not by Δ or halo formation history. Adapted from Wang et al. (2018). |
6.3. Why do galaxy properties depend on environment?
The correlation between galaxy properties and galaxy environment is well established (Balogh et al. (2004), Kauffmann et al. (2004), Blanton et al. (2005), Blanton & Berlind (2007)). Properties such as color, star-formation rate, Sersic index, and morphology are each correlated with local galaxy density on all measurable scales. The conclusion of these studies has been that environment mattered most on small scales, and once that environment was fixed, correlations on larger scales were eliminated. However, no ‘ideal’ scale for environment to characterized the full dependence could be identified from the data (Blanton & Berlind (2007), Blanton et al. (2006)).
A more comprehensive and physically motivated explanation of the observed correlations of environment can be obtained through the galaxy–halo connection. Figure 12, taken from Wang et al. (2018), shows results from the SDSS for the dependence of the quenched fraction of galaxies on galaxy density, Δ, smoothed over a 5.7 Mpc Gaussian kernel. A galaxy group catalog is used to decompose this relation into central and satellite galaxies. The curves show predictions of a model in which M∗ is assigned to Mh in a manner similar to abundance matching, but galaxy quenching depends solely on the mass of the host halo. This model is an good match to the observations for all galaxies (left-hand panel), even though Δ is never explicitly used to determine quenching (see also, Peng et al. 2010, Tinker, Wetzel & Conroy 2011). For low-mass central galaxies, the predictions of the model are by construction nearly horizontal lines, with predictions for higher M∗ bins curved slightly by the trend of Mh with Δ within the M∗ bin, which is stronger at high M∗. This is an example of spatial correlations in halo mass alone and therefore does not signify assembly bias. The SDSS measurements for central and satellite galaxies use the group catalog of Yang et al. (2007). For low-mass centrals, the deviation of the data from a horizontal line at high Δ is due in part to misclassification in the group-finding process (Tinker, Wetzel & Conroy, 2011, Tinker et al., 2017c), which may account for the differences with the model predictions. The strongest correlation with Δ comes from the satellite galaxies. But this correlation, once again, is not due to Δ per se but to the change in the halo mass function with Δ; higher mass halos live in higher density regions, yielding the strong correlation of fq with Δ for satellite galaxies.
Intragroup environment — scales of ∼ 100 kpc or so — also correlates with fq (Blanton & Berlind (2007), Peng et al. (2010), Wetzel, Tinker & Conroy (2012)). This correlation can also be explained without invoking environment, through the delayed-then-rapid model of satellite quenching (Wetzel et al. (2013)). Older satellites are more likely to be quenched, and older satellites are more likely to be near the center of the group, where densities are higher. A model based entirely on time since accretion is consistent with the correlation between fq and location within the group, although we note that it is not a unique solution to the problem.
An important question is whether galaxy radial size at fixed halo mass is correlated with a second halo property, and if so what that property is. Classic models of galaxy formation (Fall & Efstathiou, 1980, Mo, Mao & White, 1998) have based the radial sizes of galaxies on the spin of their dark matter halos, and predict that they should be proportional to that spin and to the size of the halo. However, there have been somewhat confusing signals in the literature on whether the amount of scatter in sizes at fixed galaxy or halo properties are consistent with these models, as well as whether the multivariate correlations between galaxy mass and size at fixed halo mass and radius are what one would predict.
Kravtsov (2013) explored the question of how galaxy size is related to halo properties in a standard abundance matching model, matching stellar mass to halo mass. They showed that in this model one obtains an approximately linear relation between the galaxy half-mass radius and the halo radius, with tight scaling across six decades of mass: Rg ∼ 0.015 Rhalo, with scatter of 0.2 dex and with fairly similar scaling for elliptical and spiral galaxies. This agrees well with predictions of simple models where galaxy sizes are set by the angular momentum of their halos. Somerville et al. (2018) compared the conditional size function at a given stellar mass and concluded that the width of the distribution is roughly consistent with the ansatz in which galaxy size is proportional to the standard assumption of spin times the halo size. However, they found a significant trend in the ratio of galaxy size vs. halo size with both stellar mass and redshift, which is in tension with that ansatz, because the spin should not depend strongly on halo mass or redshift. Desmond & Wechsler (2017) also found that the resulting scatter in the Tully-Fisher relation was larger than one might expect from these simple models.
The theoretical results of Somerville et al. (2018) and Desmond et al. (2017), using different techniques, have found an anti-correlation between stellar mass and size at fixed halo mass, such that smaller galaxies live in more massive halos at fixed M∗. Hearin et al. (2017) recently proposed a conditional abundance matching model for galaxy sizes, which came to a similar conclusion based on the clustering properties of small and large galaxies. This is not by itself conclusive, as galaxy clustering strength is a function of both halo mass and other properties, including satellite fraction and halo assembly bias. This model is consistent with measuring a higher lensing signal for larger galaxies at fixed stellar mass as was found by Charlton et al. (2017), but we caution that this trend may depend on stellar mass as well as on whether the galaxy samples are color selected. We expect that upcoming clustering and lensing surveys should be able distinguish these multivariate relations and their evolution with significantly higher precision.