


In this section, we discuss constraints on different aspects of the galaxy–halo connection as expressed by the SHMR. The mean relation is discussed in Section 5.1, the scatter in this relation in Section 5.2, and the evolution of the mean relation in Section 5.3. Section 5.4 discusses observational tests of whether halo properties other than mass influence the stellar mass or luminosity of galaxies. This section closes with a brief overview of systematic uncertainties, both observational and theoretical, that need to be taken into account when interpreting current constraints. Section 6 considers second-parameter connections involving additional parameters beyond mass.
5.1. The mean stellar-to-halo mass relation for central galaxies
Figure 2 presented the constraints on the SHMR in the local universe, painting a consistent picture of the relationship between halos and total galaxy mass from a variety of methods and datasets. These approaches have now been described in the preceding sections. There is remarkable consistency on the general outlines of the SHMR from these methods, including constraints from non-parametric abundance matching (Behroozi, Conroy & Wechsler, 2010, Reddick et al., 2013, Behroozi, Wechsler & Conroy, 2013a), the parameterized SHMR inferred from abundance matching (Guo et al., 2010, Moster, Naab & White, 2013, Moster, Naab & White, 2018), the halo occupation distribution (Zheng, Coil & Zehavi, 2007), the conditional luminosity function (Yang et al., 2012), abundance matching from X-ray clusters (Kravtsov, Vikhlinin & Meshcheryakov, 2018), or models based on evolving galaxies within their dark matter halo histories constrained by galaxy clustering and galaxy-galaxy lensing (Behroozi et al., 2018).
These approaches use different observables and different modeling techniques. For example, the HOD and CLF leave satellite occupation as a free parameter to be constrained by the data, whereas abundance matching techniques are constrained to match satellites onto subhalos within simulations using a global galaxy–halo relation. Observables used to constrain these approaches include the stellar mass function at a given epoch, the stellar mass and star formation rates as a function of time, the group stellar mass function and conditional stellar mass function of galaxies in groups, galaxy clustering, galaxy–galaxy lensing, and satellite kinematics. The biggest discrepancy between these methods in terms of the mean relation is due to systematics in the measurement of the stellar mass itself at the highest mass end. At the lowest mass end, uncertainties are dominated by the fact that galaxy samples are still small and likely incomplete. We discuss these issues further in Section 5.5.1.
5.2. Scatter for central galaxies
One of the most important aspects of the galaxy–halo connection is the scatter in central galaxy stellar mass at fixed halo mass, σlog M∗. It is not possible to constrain σlog M∗ from the abundance of galaxies alone; here we present a number of possibilities that can constrain this parameter: galaxy clustering, galaxy groups and clusters, satellite kinematics, galaxy–galaxy lensing, and galaxy scaling relations.
Galaxy clustering: Halo bias is a strong function of mass for halos above MNL, so in this regime galaxy clustering can provide a strong constraint on scatter. The left panel of Figure 7 gives an example, based on galaxy clustering at z ∼ 0.5 from the BOSS survey (Tinker et al., 2017a). Different curves represent the predictions of SHMR models with different scatter values, but only σlog M∗ = 0.18 provides a good fit to the observed bias of BOSS galaxies. The constraining power of clustering is primarily at the massive end; this result is best characterized as a constraint in σlog M∗ in the halo mass range of log Mh = [12.7, 13.7]. Using a combination of galaxy clustering and galaxy lensing of z = 0 SDSS galaxies, an independent study by Zu & Mandelbaum (2015) obtained a constraint on the scatter at Mh = 1012 M⊙ (σlog M∗ = 0.22−0.01+0.02) and at Mh = 1014 M⊙ (σlog M∗ = 0.18 ± 0.01).
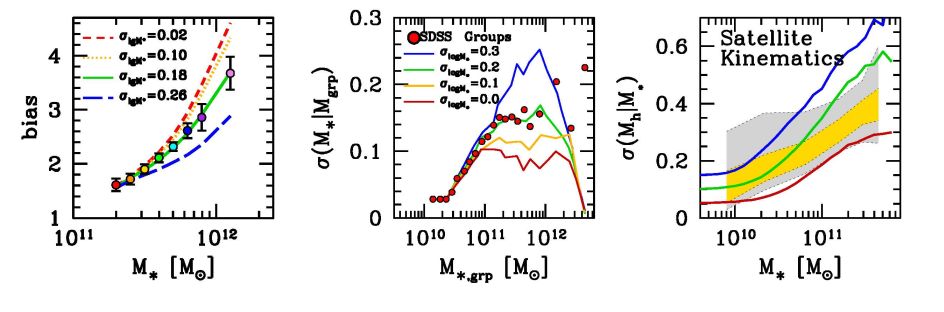 |
Figure 7. Left Panel: Points with errors show bias as a function of M∗ for z = 0.5 galaxies in the BOSS survey from Tinker et al. (2017a). Curves indicate SHMR fits to the BOSS stellar mass function with various values of σlog M∗. Middle Panel: Points show the scatter in M∗ at fixed group stellar mass for central galaxies in z ≈ 0 SDSS group catalogs. Curves show predictions from abundance matching models with different values of σlog M∗. All theoretical models have been run through the group finding algorithm to create an apples-to-apples comparison. All data and models taken from Reddick et al. (2013). The three data points at log M∗ grp > 12 are not significant owing to low numbers of groups above this mass scale. Right Panel: The scatter in Mh at fixed M∗, derived from analysis of satellite kinematics by More et al. (2011). Contours indicate 68% (yellow) and 95% (grey) confidence intervals. The solid curves show predictions for the quantity using the three abundance matching models in Figure 5, in which σlog M∗ = 0.1, 0.2, and 0.3. |
Galaxy groups and clusters: Galaxy groups and clusters can constrain the scatter by directly measuring the properties of central galaxies in groups of clusters of a given mass. Using a sample of galaxy clusters with well-measured X-ray halo mass estimates, Kravtsov, Vikhlinin & Meshcheryakov (2018) derived a value of σlog M∗ = 0.17 by directly measuring the scatter around the mean M∗ - Mh relation. This measurement probes the halo mass range of log Mh = [14.0, 15.0]. Similar measurements can be made by galaxy group catalogs; here a critical issue is how well the mass of the group can be measured. The middle panel of Figure 7 shows scatter in the mass of the central group galaxy at fixed group halo mass, σ(Mcen | Mgrp) from Reddick et al. (2013). To facilitate a proper comparison with theory, Reddick et al. (2013) created abundance matching mocks constrained to the SDSS stellar mass function, which were run through the group finder and processed in the same manner as the data. The figure shows the mock values of σ(Mcen | Mgrp) for four different values of σlog M∗. Data at low stellar masses have no constraining power because the masses of these groups are not reliable, but using data at M∗ ≃ 1011 M⊙, Reddick et al. (2013) determine a best-fit value of σlog M∗ = 0.20 ± 0.02 (note that this value refers to the scatter in central galaxy properties at fixed halo mass). This constraint likely has modest sensitivity to the abundance matching proxy used, because the measured scatter at fixed group mass depends on the correlation between central galaxy mass and total group mass. Future surveys, for example, the DESI Bright Galaxy Survey (DESI Collaboration et al., 2016), may be able push this scatter constraint down to lower masses because lower mass groups will contain significantly more galaxies.
Satellite kinematics: Satellite kinematics offer a complementary approach to constraining scatter by probing the dark matter gravitational potential around central galaxies. With a sufficiently deep spectroscopic sample, satellite kinematics can constrain σlog M∗ around low-mass galaxies and halos below the regime where clustering loses its sensitivity. The right-hand panel of Figure 7 shows constraints on scatter using kinematics of satellite galaxies from More et al. (2011). In this analysis, the scatter is presented as σ(Mh | M∗). Solid curves plotted over the contours show σ(Mh | M∗) for the three SHMR fits to the SDSS stellar mass function from Figure 5: σlog M∗ = 0.1, 0.2, and 0.3. We note that these comparisons between theory and data are not precise because they are based on different assumptions about the stellar mass measurements. However, these data are consistent with a model in which σlog M∗ = 0.2 or somewhat smaller, which is consistent with constraints from clustering, lensing, and group statistics.
Scaling relations: Before the advent of surveys that could measure clustering and lensing for large galaxy samples, the observation of tight dynamical scaling relations was the best clue that galaxy and halo properties were tightly connected. These have continued to provide interesting constraints on galaxy formation models (Governato et al., 2007, Somerville et al., 2008); for example simultaneously matching clustering, abundance, and the Tully-Fisher relation has been challenging. Recently, studies have begun to combine these constraints to test empirical models (Desmond & Wechsler, 2015, Desmond & Wechsler, 2017). Although with current samples these are not yet competitive with clustering to constrain scatter in the primary galaxy parameter (stellar mass or luminosity) at mass above ∼ 1012 M⊙, they can provide useful constraints at lower masses and also can constrain the covariate scatter between e.g. mass and size at fixed halo mass.
Measurement error: We note that most observational constraints on σlog M∗ represent the quadratic sum of intrinsic scatter and measurement scatter. The uncertainties in estimating stellar mass are much discussed (e.g., Conroy, Gunn & White 2009), and typical uncertainties in M∗ range from 0.2–0.3 dex (Mobasher et al. 2015). However, these uncertainties represent a combination of scatter and overall biases in stellar mass estimates. While the former contributes to σlog M∗, the latter does not. Tinker et al. (2017a) estimated a lower limit to the observational scatter to be 0.11 dex for their stellar masses, yielding an upper limit to the intrinsic scatter of 0.16 dex. Further understanding of measurement scatter will enhance our ability to constrain the intrinsic σlog M∗.
5.2.1. Comparison with galaxy formation models How do these constraints compare to the scatter we expect from physical models of galaxy formation? Figure 8 shows σlog M∗ as a function of Mh for a range of models, including cosmological hydrodynamic simulations of galaxy formation, semi-analytic galaxy formation models, and empirical models. As discussed in the previous section and as shown in Figure 7, several recent measurements indicate that the scatter in stellar mass at fixed halo mass is quite well constrained to be below 0.2 dex at the high mass end, likely below 0.16 dex when considering only the intrinsic scatter predicted by these models. This is in good agreement with current predictions from hydrodynamical simulations, as well as with some of the empirical models. We note however that all of the semi-analytic models shown here, as well as the Behroozi et al. (2018) model which traces galaxy star formation through dark matter merging histories, have somewhat larger scatter at the high mass end. This may be due to inadequate correlation between when galaxies are quenched and the properties of halos at that time; it will be important to understand what differences in the physical parameterizations lead to this difference.
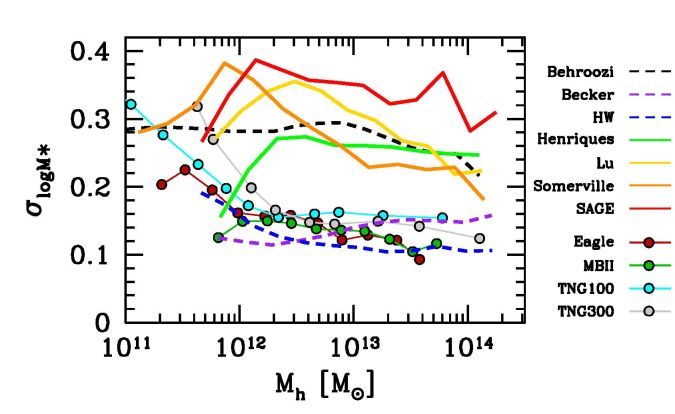 |
Figure 8. Scatter in the stellar mass of central galaxies at a given halo mass from various theoretical and empirical models. Models include four hydrodynamical simulations, Massive Black II (Khandai et al., 2015), Eagle (McAlpine et al., 2016) and two IllustrisTNG simulations (Pillepich et al., 2018) (colored circles connected by thin solid lines); four semi-analytic models, from Henriques et al. (2015), Lu et al. (2014), Somerville et al. (2012), and the SAGE model from https://tao.asvo.org.au/tao/ (thick solid lines); and three empirical models, from Behroozi et al. (2018), Becker (2015), and Hearin & Watson (2013) (dashed lines). |
Thus far we have discussed primarily the regime above the pivot point around M = 1012, where the scatter is well constrained by several observational measures. As seen in Figure 7, at present, clustering, group catalogs, and satellite kinematics only produce strong constraints above this regime, although the tightness of galaxy scaling relations provide some constraint at lower masses. At halo masses above ∼ 1012.5 M⊙ where the observational constraints are most robust, most models do predict roughly constant scatter. At lower masses, most models predict increasing scatter, though care must be taken with resolution effects (for example, if the merger histories are measured with low resolution, this may create artificial scatter) and also with definitions — which scatter is being considered? When considering scatter at the lowest masses, down to the dwarf scale, we have very little direct observational information about the scatter of central galaxies, and many studies (both observational and theoretical) have so far considered primarily the scatter of satellites within the Milky Way or similar simulated galaxies. Here then, it is important to distinguish scatter due to satellite stripping from scatter due to the formation processes for central galaxies. For example Munshi et al. (2017) claim to find high scatter in low mass galaxies, but in fact show rather small scatter, σ < 0.25 dex, for the pre-stripped quantities. Overall, the evidence suggests that there is slightly more scatter in the stellar masses of dwarf galaxies; understanding how large this scatter is a critical piece of tests of the CDM model in this regime and will be a major area of future work as samples of dwarf galaxies increase (Bullock & Boylan-Kolchin, 2017).
Above we have primarily focused on the galaxy–halo connection in the local universe, where it is accurately constrained by the abundance and detailed clustering properties of galaxies. How do we expect it to evolve? Stellar mass functions have been measured up to z ∼ 8, allowing abundance matching to be applied over the majority of the history of the universe. The first study to investigate the evolution of the SHMR over most of cosmic time was performed by Conroy & Wechsler (2009) who used abundance matching at individual epochs combined with information about halo accretion over time to infer the evolution of the SHMR and galaxy assembly histories. This has since been extended by other authors using halo merger trees directly, as well as extensive updated information on the populations of high redshift galaxies.
The primary conclusion from a range of studies is that the star formation efficiency, defined here as the ratio of the star formation rate divided by the mass accretion rate, is a strong function of mass, peaking at roughly 1012 M⊙, but a very weak function of redshift. This is shown in the left panel of Figure 9, based on the results of Behroozi, Wechsler & Conroy (2013b), which synthesized a range of measurements. This study found that two-thirds of all star formation occurs in a relatively narrow range of halo masses. We note that the halo mass accretion rate is declining with time, so the star formation rate itself is significantly higher for a galaxy at a given stellar mass at higher redshift. A typical galaxy that lives in a massive halo today started forming stars early, but then at relatively early times moved out of this efficient mass range. A typical galaxy in a smaller halo started forming stars later, but spends a longer region in this regime of efficient star formation. The resulting SHMR as inferred by the study of Behroozi et al. (2018) is shown in the right hand panel. Somewhat surprisingly, the SHMR evolves rather little with time; the peak of the relation is nearly constant to z ∼ 3. Because low mass galaxies are still building up, their stellar mass to halo mass ratio increases over this time. Above z ∼ 3, nearly all galaxies are still forming stars efficiently, and it is unclear whether the SHMR turns over and declines at the highest masses.
Galaxy clustering and galaxy lensing can be used to test these models out to higher redshift. This has been done using clustering alone in surveys like BOSS, DEEP, and PRIMUS out to z ∼ 1 both for typical ∼ L∗ galaxies (Zheng, Coil & Zehavi, 2007, Coil et al., 2008, Abbas et al., 2010, Tinker & Wetzel, 2010, Wake et al., 2011, Skibba et al., 2015) and for massive galaxies (Wake et al., 2008, Zheng et al., 2009, White et al., 2011, Guo et al., 2014, Zhai et al., 2017). Clustering and lensing were combined to constrain the SHMR in COSMOS out to z ∼ 1 (Leauthaud et al. (2012)). Lensing by itself can also provide constraints at higher redshift (Hudson et al. (2015)), although these constraints can be significantly tightened by bringing in measurements of clustering and/or the stellar mass function (van Uitert et al. (2016)). We expect that the current and next generation of large imaging and spectroscopic surveys will dramatically increase the statistical power of these constraints to higher redshift.
 |
Figure 9. Left: Star formation efficiency (defined here as the star formation rate divided by the halo mass accretion rate) as a function of halo mass and redshift. Two thirds of all star formation occurs in within a factor of three of the peak halo masses. From Behroozi, Wechsler & Conroy (2013b). Right: Evolution of the SHMR with redshift as inferred from the empirical model of Behroozi et al. (2018). |
5.4. How does assembly bias manifest observationally?
In models of galaxy assembly bias, star formation efficiency may depend on halo properties other than halo mass. The consequence of such a secondary correlation would be that the residuals of the SHMR would correlate with other halo properties. Observationally, this could impact the clustering of galaxies as a function of stellar mass. Such an effect has been searched for by a number of authors. Lehmann et al. (2017) and Zentner et al. (2016) have fit z = 0 clustering measurements using models that include secondary halo properties. Lehmann et al. (2017) used the composite abundance matching method, whereas Zentner et al. (2016) used the enhanced HOD method. Both models used halo concentration as their secondary halo property. Both found at least one luminosity threshold sample that preferred a model in which galaxy occupation depended on c in such a way to increase the chance of finding a central galaxy in higher concentration halos, thus boosting the clustering of the model galaxies. This is in agreement with some results from both semi-analytic models and cosmological hydrodynamic simulations, which we present in Section 6.
A significant caveat to both of these analyses is that they are performed at a fixed cosmology. The amplitude of galaxy clustering for a fixed HOD is sensitive to the amplitude of dark matter fluctuations, which can be influenced by σ8, Ωm, and to a lesser extent other cosmological parameters. Thus it is an open question whether galaxy assembly bias is required to match the observed level of galaxy clustering over the entire range of cosmological parameter space currently allowed by cosmic microwave background and other large-scale structure probes. Alternatively, if one's goal is to constrain cosmology from analysis of non-linear clustering, galaxy assembly bias can be degenerate with changes in cosmological parameters. Thus, robust analyses of small-scale galaxy clustering must take galaxy assembly bias into account in order to yield robust cosmological constraints.
As the statistical power of the data constraining the galaxy–halo connection increases, it is important to consider the impact of both observational and theoretical systematic errors on these constraints. Here we mention a few of the most important of each.
5.5.1. Observational systematics It is worth noting that definitions and measurement uncertainties can matter both qualitatively and quantitatively. A particularly important systematic error is the fact that in large imaging surveys, the surveys have surface brightness limits and imperfect pipelines that can lead to mis-estimates of the total mass of a galaxy. For some time, most of the low redshift estimates of the SHMR were based on stellar mass and clustering estimates of SDSS data. These studies may have underestimated the stellar mass/luminosity of brightest cluster galaxies by factors of several at the massive end (Kravtsov, Vikhlinin & Meshcheryakov, 2018, Bernardi et al., 2017, Huang et al., 2018). There are several related issues that can impact this estimation. Differences in the estimation of sky subtraction dominate, but modeling the outer profiles of galaxies, distinguishing between central galaxies and the intracluster light (Conroy, Wechsler & Kravtsov, 2007), and the estimation of stellar masses themselves can also contribute. The high mass end of the SHMR has important consequences for inferences about cooling rates and feedback in massive galaxies, and studies that were based on these earlier results should be re-evaluated in this light. In particular, based on more recent estimates that indicate increased mass estimates of massive galaxies, group and cluster mass halos should be expected to host larger central galaxies than earlier estimates would have indicated, for example scaling as M∗ ∼ Mh0.4; this can be seen in the estimate of the SHMR in Figure 2 from Kravtsov, Vikhlinin & Meshcheryakov (2018) and Behroozi et al. (2018) compared to previous estimates. An additional uncertainty is due to possible changes in the stellar initial mass function at high mass and as a function of radius within a galaxy (Bernardi et al., 2017, Kravtsov, Vikhlinin & Meshcheryakov, 2018). These systematics can impact the need for effective feedback at the massive end, so they are directly relevant to physical inference from the SMHR.
5.5.2. Theoretical systematics ' Although gravity is a well-understood process, the results of cosmological N-body simulations are still subject to systematic errors that can impact the predictions of models of the galaxy–halo connection. These errors fall into two main categories: resolution and substructure disruption, and robustness of halo finding and tracking.
Lack of spatial and temporal resolution can limit the ability of a simulation to resolve substructure within halos, even with proper mass resolution (see, e.g., Moore, Lake & Katz (1998), Klypin et al. (1999), Ghigna et al. (2000)). van den Bosch (2017) estimates that roughly 80 per cent of all subhalo disruption is numerical rather than physical, which may be due to inadequate force softening in simulations (van den Bosch & Ogiya, 2018, van den Bosch et al., 2018). Lack of subhalos equates to lack of satellite galaxies, which can cause models to compare poorly to clustering measurements, or alternatively can drive model selection to parameters that artificially increase the number of satellites. To account for this, some studies incorporate ‘orphan' subhalos which algorithmically follow the estimated path of disrupted substructure. In some semi-analytic models, the fraction of galaxies represented by orphans can be 10–30% (Pujol et al. (2017)). To control for this in abundance matching, studies like that by Reddick et al. (2013) and Lehmann et al. (2017) have compared results from simulations with various resolutions to limit data comparisons to regions in which numerical results are converged, although caution is still warranted given these findings on disruption.
Even if substructure is properly resolved in a simulation, identifying and tracking the substructure robustly can still be a challenge. Many theoretical models require knowledge of the full history of a given halo or subhalo to properly assign its galaxy. Commonly used algorithms such as Rockstar (Behroozi, Wechsler & Wu 2013) and Subfind (Springel et al. 2001) do not always yield the same results. Comparisons of different substructure-finding codes, such as Onions et al. (2012) and Muldrew, Pearce & Power (2011) find generally consistent results, with caveats for when the number of particles in a subhalo becomes small (e.g. less than 50 particles) and when a subhalo passes through the center of a parent halo. In addition to just finding the subhalos, there is also the need to trace their merger histories. Srisawat et al. (2013) compared different merger tree codes, finding distinct results from different codes run on the same simulation. That work proposes a list of necessary features that all codes should contain to produce robust results.