


The standard relativistic jet model used as the paradigm for interpreting
observations of compact jets was first presented by
Blandford & Rees (1978) and
expanded upon by
Blandford & Königl
(1979),
with certain aspects added later by
Reynolds (1982),
Marscher (1980), and
Königl (1981).
The visible portion of the jet,
schematically drawn in Figure 3, is assumed to
begin at some point R0, beyond which
it flows at a constant Lorentz factor
 j (speed
 jc),
confined to a truncated cone of
constant opening half-angle
jc),
confined to a truncated cone of
constant opening half-angle  . The
radial coordinate R is measured from the apex of
this cone. Although it is not necessary for the cone to have a constant
opening angle,
this simple geometry conforms quite well to the available VLBI
observations. If one
further assumes that the jet is free (confined solely by its own
inertia), it resembles
a conic section of a spherical wind. The density therefore falls off as
R-2, while the
component of the magnetic field parallel to the jet
B||
. The
radial coordinate R is measured from the apex of
this cone. Although it is not necessary for the cone to have a constant
opening angle,
this simple geometry conforms quite well to the available VLBI
observations. If one
further assumes that the jet is free (confined solely by its own
inertia), it resembles
a conic section of a spherical wind. The density therefore falls off as
R-2, while the
component of the magnetic field parallel to the jet
B||  R-2 and the component transverse to the jet
B
R-2 and the component transverse to the jet
B R-1. The
region near R = R0 contains the highest density
and magnetic field strength of the conic portion of the jet, and
therefore appears as
a stationary, bright feature even though plasma streams through it at a
relativistic
speed. In the model, this region is identified with the VLBI
core. Although it is not
clear whether the portion of the jet at radii R < R0
is directly observable at any
waveband, it is important to explore possible observational signatures
revealing the
geometry and physical characteristics of this region, since it connects
the jet with the
central engine. The origin and energization of the jet plasma and
collimation and
bulk acceleration of the jet flow also occur in this region. I return to
this point in Section 4 below.
R-1. The
region near R = R0 contains the highest density
and magnetic field strength of the conic portion of the jet, and
therefore appears as
a stationary, bright feature even though plasma streams through it at a
relativistic
speed. In the model, this region is identified with the VLBI
core. Although it is not
clear whether the portion of the jet at radii R < R0
is directly observable at any
waveband, it is important to explore possible observational signatures
revealing the
geometry and physical characteristics of this region, since it connects
the jet with the
central engine. The origin and energization of the jet plasma and
collimation and
bulk acceleration of the jet flow also occur in this region. I return to
this point in Section 4 below.

|
Figure 3. Basic geometry of the relativistic jet model as viewed from a direction transverse to the axis. The vertical scale is expanded by a factor of a few for visual clarity. |
The relativistic jet model relieves the major theoretical difficulties
associated with
blazars. Relativistic beaming of the emission toward the observer causes one to
miscalculate the luminosity and photon density of the source. In order
to derive
these quantities, one needs to multiply the observed integrated flux
F by 4 D2l to
obtain the luminosity at the source, where Dl is the
luminosity distance. However, if
relativistic beaming occurs, the radiation is not emitted isotropically,
and the timescales
are contracted in the observer's frame. Therefore, one must multiply
F by a factor
D2l to
obtain the luminosity at the source, where Dl is the
luminosity distance. However, if
relativistic beaming occurs, the radiation is not emitted isotropically,
and the timescales
are contracted in the observer's frame. Therefore, one must multiply
F by a factor  -4
for a variable emission region moving within the jet, where
-4
for a variable emission region moving within the jet, where
 [(1
-
cos
[(1
-
cos )]-1
and is the angle between the
jet axis and the line of sight. The
Doppler factor
ranges from (1 + )
for
= 0, to
for
=
sin-1(1 / ), to
-1 for
=
/2. Any
given flux-limited survey tends to be dominated by beamed sources, so
one has no
problem with statistics as long as there is a sufficient supply of
"parent" objects that
have low apparent luminosities because most of their radiation is beamed
away from us. Since the actual luminosities of sources with jets beamed
toward us are much
lower than previously inferred, the enormous energy requirements and
overprediction
of high-energy inverse Compton photons are greatly diminished.
)]-1
and is the angle between the
jet axis and the line of sight. The
Doppler factor
ranges from (1 + )
for
= 0, to
for
=
sin-1(1 / ), to
-1 for
=
/2. Any
given flux-limited survey tends to be dominated by beamed sources, so
one has no
problem with statistics as long as there is a sufficient supply of
"parent" objects that
have low apparent luminosities because most of their radiation is beamed
away from us. Since the actual luminosities of sources with jets beamed
toward us are much
lower than previously inferred, the enormous energy requirements and
overprediction
of high-energy inverse Compton photons are greatly diminished.
Since we have yet to understand how a relativistic jet is focused and
accelerated,
we cannot yet obtain a firm theoretical upper limit to the Lorentz
factor of the jet.
However, if the jet is accelerated near the putative massive black hole,
Compton drag
should limit the Lorentz factor to
j
 10, and there are other
arguments that lead to a similar constraint
(Phinney 1987).
One can use the measured angular size, turnover
frequency, and flux density to derive the magnetic field and energy
density in relativistic
electrons of a source. When this is done for a typical compact component
in a blazar
without correcting for relativistic beaming, one finds that the
energetics are dominated by the relativistic electrons (see
Burbidge, Jones, &
O'Dell 1974;
Marscher & Broderick
1985).
If one assumes that the component is moving relativistically with a Doppler
factor , this imbalance is
lessened and the total energy requirement is correspondingly
diminished. But once the Lorentz factor exceeds about 10, the magnetic
field begins to
dominate and the energy requirements become extremely high. The other
consequence
of very high Lorentz factors is that the more highly beamed blazars are,
the greater
is the required number of unfavorably beamed parent objects. This also
restricts the
typical value of to be
10, although a
few extraordinary objects could have higher
values. The "critical" value
~ 10 is a rough one, but the
arguments are general. It is
interesting that the observed superluminal speeds seem to obey this limit.
10, and there are other
arguments that lead to a similar constraint
(Phinney 1987).
One can use the measured angular size, turnover
frequency, and flux density to derive the magnetic field and energy
density in relativistic
electrons of a source. When this is done for a typical compact component
in a blazar
without correcting for relativistic beaming, one finds that the
energetics are dominated by the relativistic electrons (see
Burbidge, Jones, &
O'Dell 1974;
Marscher & Broderick
1985).
If one assumes that the component is moving relativistically with a Doppler
factor , this imbalance is
lessened and the total energy requirement is correspondingly
diminished. But once the Lorentz factor exceeds about 10, the magnetic
field begins to
dominate and the energy requirements become extremely high. The other
consequence
of very high Lorentz factors is that the more highly beamed blazars are,
the greater
is the required number of unfavorably beamed parent objects. This also
restricts the
typical value of to be
10, although a
few extraordinary objects could have higher
values. The "critical" value
~ 10 is a rough one, but the
arguments are general. It is
interesting that the observed superluminal speeds seem to obey this limit.
The true opening half-angle of the
jet is related to the observed angle
obs,
projected on the sky, by the relation
 obs tan
in the small-angle limit. Since
the angle of the jet axis relative to the line of sight
can be estimated from the
observed superluminal motion (by minimizing the bulk Lorentz factor
), it is possible
to derive the value of . For
NRAO 140,
Marscher (1988) obtains
1°.5, while for
3C 345
(Unwin and Wehrle 1992),
one can calculate
1°.6. The relativistic
jet model therefore requires that the jets be extremely well collimated.
obs tan
in the small-angle limit. Since
the angle of the jet axis relative to the line of sight
can be estimated from the
observed superluminal motion (by minimizing the bulk Lorentz factor
), it is possible
to derive the value of . For
NRAO 140,
Marscher (1988) obtains
1°.5, while for
3C 345
(Unwin and Wehrle 1992),
one can calculate
1°.6. The relativistic
jet model therefore requires that the jets be extremely well collimated.
Blandford & Königl (1979) proposed that disturbances in the jet flow cause shocks to form and propagate down the jet. They associated these shocks with the knots observed to move at apparent superluminal speeds in VLBI images of compact extragalactic jets. Jones (1982), Marscher & Gear (1985), and Hughes, Aller, & Aller (1985) subsequently showed that such shocks could reproduce quite well many of the detailed characteristics of the structural, spectral, and polarization variability of blazars.
Probably the greatest success of the detailed shock-in-jet models is their reproduction of complex observed multifrequency spectral and polarization variations while obeying the constraints of a specific physical scheme. This success led Marscher, Gear, & Travis (1992) to include the complicating effects of bending of the jet and turbulence in the jet plasma.
VLBI and VLA observations of jets show that they often bend considerably. For relativistic jets, the small angle of the jet axis to the line-of-sight amplifies the bending angle. Even so, bends of at least several degrees are required by the observations. Although it is not necessarily true that the jet axis itself bends, this is the most straightforward interpretation of the observations. Hardee (1990) has shown that macroscopic fluid instabilities can cause a jet to bend. Curvature in a relativistic jet causes variations in Doppler boosting and proper motion. These effects lead to systematic changes in the observed brightness and apparent superluminal motion of a compact source.
The observational consequences of variations in the inclination angle of
the jet are described by
Marscher (1990) and
Marscher, Gear, & Travis
(1992).
The Doppler
boosting of the flux density can change by a factor of 2 or so even if
the jet bends
by only a few degrees. This is accompanied by a noticeable change in the
apparent
superluminal speed if changes
from 15° /
to larger angles (or vice
versa), or by
only a modest change in vapp if
remains in the 30° /
to 110° /
range.
The evolution of the spectrum of a shock moving down a twisted jet has been considered by Marscher, Gear, & Travis (1992). The several possible patterns include a rise in flux density as the self-absorption turnover frequency remains essentially constant or decreases. This behavior has been observed in the centimeter-wave outbursts such as that in the source 1921-29 in 1979 (Dent and Balonek 1980) and that in 1156+295 in 1984-86 (McHardy et al. 1990). While this behavior can be reproduced at higher frequencies if inverse Compton losses are important (Marscher & Gear 1985), it is difficult to conceive of an alternative mechanism for doing so at centimeter wavelengths since changes in other physical parameters that cause the flux density to increase should cause the turnover frequency to increase as well.
Marscher et al. (1991) and Alberdi et al. (1993) have interpreted the peculiar superluminal quasar 4C 39.25 in terms of a bending jet. The model interprets the stationary features in the compact jet as points where the angle to the line of sight is minimized: at such points the Doppler beaming is enhanced but the apparent transverse motion is greatly diminished. The evolution of the multifrequency light curve follows that expected according to the model. In addition, the polarization observations indicate that the magnetic field is oriented transverse to the jet axis, as expected for a strong shock wave in a turbulent jet, and contrary to the trend for quasars determined by Roberts et al. (1990).
The Reynolds number in a relativistic jet is expected to be extremely high, so the plasma in the jet should be quite turbulent. The effect that this has on the time variability depends on the amplitude and power spectrum of the turbulence as well as on the thickness of the shocked emission region. Marscher & Travis (1991) and Marscher, Gear, & Travis (1992) present numerical simulations of a shock propagating down a jet whose plasma is hydromagnetically turbulent. As the disturbance propagates down the jet, it brightens at sites where it encounters density and/or magnetic field enhancements and fades where it encounters diminishments. It is mainly the magnetic field fluctuations that amplify or reduce the flux density at a given location in the shock. Especially effective are changes in the direction of the magnetic vector, since the observed synchrotron radiation depends strongly on the orientation of the magnetic field relative to the observer.
The shock should have a frequency-dependent dimension along the jet axis at
high frequencies, since the high-energy electrons radiating at these
frequencies suffer
significant synchrotron and (perhaps) inverse Compton losses. The
highest amplitude
variability is caused by the overall evolution of the shock wave and is
nearly simultaneous
over all optically thin portions of the spectrum, which for major flares
typically includes
optical, infrared, submillimeter, and perhaps millimeter wavelengths. If
the disturbance
is strong enough (but not so strong that radiative losses completely
snuff it out), the
flare propagates toward longer wavelengths, peaking as the emission at
that wavelength
becomes optically thin, viz. later at longer wavelengths. Superposed on
this long-term
(timescales of months, typically) trend are substantial flares occurring
on timescales
governed by the decorrelation length scale of the turbulence. Minor
fluctuations
("flickering") superposed on the more pronounced flux density variations
can occur
over even shorter timescales as the shock encounters eddies of
dimensions similar to
the width of the emission region behind the shock front at that
frequency, x(v). The
variability timescale is found to be as short as ~
x( ) /
(
) /
( c), so
very rapid variability,
much faster than ~ R/c, is possible if the shock is very thin
(x << R). The timescales of
these minor variations are shorter, and the amplitudes larger, at the
higher frequencies corresponding to smaller values of
x().
Figure 4 illustrates the general nature of the
numerically generated flickering of the flux density and
polarization. Note the high
amplitude of the polarization variations, including a position angle
swing of over 180°
that is nothing more than a "random walk" as the shock encounters
turbulent cells
with randomly oriented magnetic field. Figure 5
shows the frequency dependence of
the light curves. The lower frequency light curves are much smoother
than those at higher frequencies, which exhibit considerable flickering.
c), so
very rapid variability,
much faster than ~ R/c, is possible if the shock is very thin
(x << R). The timescales of
these minor variations are shorter, and the amplitudes larger, at the
higher frequencies corresponding to smaller values of
x().
Figure 4 illustrates the general nature of the
numerically generated flickering of the flux density and
polarization. Note the high
amplitude of the polarization variations, including a position angle
swing of over 180°
that is nothing more than a "random walk" as the shock encounters
turbulent cells
with randomly oriented magnetic field. Figure 5
shows the frequency dependence of
the light curves. The lower frequency light curves are much smoother
than those at higher frequencies, which exhibit considerable flickering.
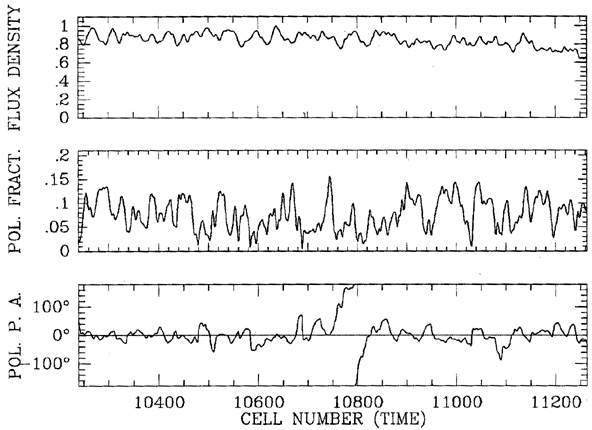
|
Figure 4. Total flux density (normalized), polarization fraction, and polarization position angle "light curves" corresponding to a numerical simulation of a thin shock propagating through a turbulent jet. The gradual decline in flux density is caused by the overall evolution of the shock emission, while the rapid flickering occurs as the shock encounters turbulent fluctuations in magnetic field and density. The mean magnetic field is parallel to the jet axis (perpendicular to the shock front); superposed on this is a random component with magnitude equal to 80% of the mean field. The density fluctuations correspond to 10% of the mean value. From Marscher, Gear, & Travis (1992). |
The turbulent fluctuations can occur far downstream of the compact core of the source. Shocks in turbulent jets are therefore good candidates for explaining much of the "flickering" of radio sources (Heeschen et al. 1987; Quirrenbach et al. 1989). However, it is not clear how shocks thin enough to cause variations on timescales ~ 1 day can occur at centimeter wavelengths, since radiative losses should be negligible. If such thin shocks are possible, the flickering radio emission could be synchrotron radiation from shocks moving through turbulence, while the similar optical variations observed in 0716+714 (Quirrenbach et al. 1991) could be inverse Compton scattered radiation generated inside the flickering radio synchrotron component. I have explored this in a previous paper (Marscher 1992), where I found that a thin shock in a turbulent jet can indeed produce intraday variations similar to those observed, but only if the jet is pointing directly along the line of sight. The implied brightness temperature of 2 x 10¹⁸ derived by Qian et al. (1991) should represent an extreme case, since it can be explained only by the most favorable orientation of the jet relative to the observer. Also, while turbulence can provide quasi-periodic phenomena over several cycles, truly periodic intraday variations cannot be accommodated. Such periodicities would probably require coherent emission mechanisms, which seem unlikely given that the polarization properties of the intraday variables (substantial linear polarization, very low circular polarization) are identical to those observed in garden-variety incoherent synchrotron sources.
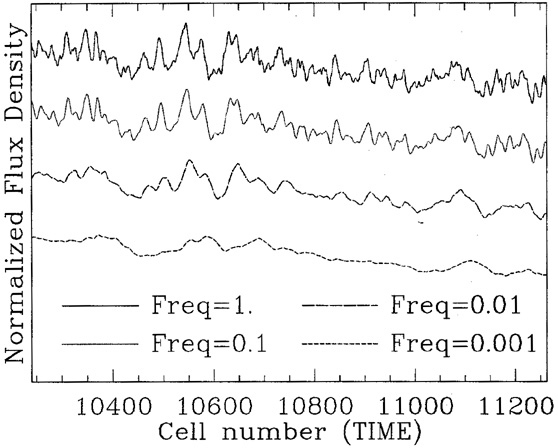
|
Figure 5. Total flux density (normalized) "light curves" at four normalized frequencies corresponding to a numerical simulation of a thin shock propagating through a turbulent jet (as in Fig. 4 but corresponding to a different run). Note that the light curves become smoother toward lower frequencies. From Marscher & Travis (1991). |
The radio-infrared synchrotron flare caused by a shock in a jet should be
accompanied by a self-Compton X-ray and
-ray flare. Since the
self-Compton flux
density is proportional to the synchrotron photon density as well as the
density
of relativistic electrons, both of which increase during an outburst,
the high-energy
flare should be more pronounced than the synchrotron flare, after
subtraction of the
"quiescent" emission. Because of the close connection observed between
the optically
thin synchrotron emission and the X-ray emission in blazars, most
authors consider
self-Compton scattering to be the primary X-ray emission mechanism in
all such sources
except for those BL Lac objects with steep X-ray spectra. For the latter
sources,
synchrotron emission appears to be the dominant mechanism. Since the
extragalactic
sources detected at hard
-ray energies by
the Compton Observatory thus far all
contain compact nonthermal jets, it is clear that the
rays are
intimately connected
with the lower frequency synchrotron emission. Since the
-ray spectra are
obviously
not merely continuations of the lower frequency synchrotron spectra, and
since -ray
synchrotron emission would require extraordinarily high energy electrons
and strong
magnetic fields, processes such as inverse Compton emission or proton
decays are more likely mechanisms. The hard
-ray emission
almost surely arises well outside
the region immediately surrounding the central engine, since otherwise
photon-photon pair production would cause the
rays to be
absorbed (McBreen 1979).
The rays
therefore probably originate either near the VLBI core or deep within
the "inner jet"
that connects the radio jet with the central engine. The same can be
said about the
X-ray emitting region. The very short timescale of variability of the
-ray emission
from 3C 279
(Kanbach et al. 1992)
implies that the inner jet may indeed be the source
of the high-energy emission, as suggested by
Maraschi, Ghisellini, &
Celotti (1992).
Since there is therefore hope that the inner jet may be observationally
accessible, I now discuss it in some detail.