

2.2. 7Li
The abundance of 7Li has been determined by observations of over 100 hot, population-II halo stars, and is found to have a very nearly uniform abundance [14]. For stars with a surface temperature T > 5500 K and a metallicity less than about 1/20th solar (so that effects such as stellar convection may not be important), the abundances show little or no dispersion beyond that which is consistent with the errors of individual measurements. The Li data from Ref. [15] indicate a mean 7Li abundance of
The small error is statistical and is due to the large number of stars
in which 7Li has been observed.
The solid box for 7Li in
Figure 1
represents the 2
There is, however, an important source of systematic error due to the
possibility that Li has been depleted in these stars, though the lack of
dispersion in the Li data limits the amount of depletion. In fact, a
small observed
slope in Li vs Fe and the tiny dispersion about that correlation indicates that
depletion is negligible in these stars
[16].
Furthermore, the slope may indicate
a lower abundance of Li than that in (6). The observation
[17]
of the fragile isotope 6Li is another good indication that
7Li has not been destroyed in these stars
[18].
The weighted mean of the 7Li abundance in the sample of ref.
[16]
is [Li] = 2.12 ([Li] = log 7Li/H + 12) and is slightly lower than
that in eq.
(7), the difference is a systematic effect
due to analysis methods. It is
common to test for the presence of a slope in the Li data by fitting a
regression of
the form [Li] =
with a plausible range between 0.9 - 1.9 x 10⁻¹⁰. The dashed
box in Figure 1
corresponds to this range in Li/H.
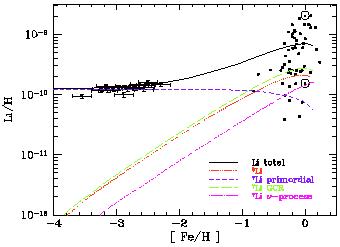
Figure 7. Contributions to the total
predicted lithium abundance from the adopted GCE model of ref.
[20],
compared with low metallicity stars (from
[16])
and a sample of high metallicity stars.
The solid curve is the sum of all components.
Figure 7 shows the different Li
components for a model with (7Li/H)p = 1.23 x
10-10.
The linear slope produced by the model is b' = 65 x 10-10,
and is independent of the input primordial value (unlike the log slope
given above). The model
[20]
includes
in addition to primordial 7Li, lithium produced in galactic
cosmic ray nucleosynthesis (primarily

 stat
range from (7).
 +
+
 [Fe/H]. These data
indicate a rather large slope,
 = 0.07 - 0.06 and
hence a downward shift in the ``primordial'' lithium abundance
 [Li] = -0.20 - -0.09. Models
of galactic evolution which predict a small slope for [Li] vs.
[Fe/H], can produce a value for
 in the range 0.04
- 0.07
[19].
Of course, if we would like to extract the primordial 7Li
abundance, we must examine the linear (rather than log) regressions.
For Li/H = a' + b'Fe /
Fe
 , we find a'
= 1 - 1.2 x 10⁻¹⁰ and b' = 40 - 120 x
10-10. A similar result is found fitting Li vs O.
Overall, when the regression based on the data and other systematic effects are
taken into account a best value for Li/H was found to be
[19]


 +
+
 fusion), and 7Li
produced by
the
  -process during type II
supernovae. As one can see, these processes are not
sufficient to reproduce the population I abundance of 7Li,
and additional production sources are needed.