


The emission-line spectra of Seyfert galaxies have been very well
studied in the optical
spectral region. They are similar to the spectra of gaseous nebulae, but
cover a wider
range of ionization. In the simplest classification scheme, they may be
divided into
two types, Seyfert 1 and Seyfert 2. The Seyfert 2 nuclei have
emission-line spectra
with line widths typically 350 km s-1 full width at half
maximum (FWHM), ranging
from 200 to 700 km s-1 in different objects
(Dahari and De
Robertis 1988a).
These lines include both permitted lines of H I, He I and He II, and
forbidden lines of which
the strongest are [O III]  4959, 5007, [N
II] 6548, 6583; other lines include [O I]
6300, 6364, [S II]
6716, 6731, often [Fe VII]
6087, and in many cases [Fe X]
6375. The Seyfert 1 nuclei
spectra include all these 'narrow' broad emission lines,
plus much broader emission lines of H I, He I, He II and Fe II,
typically with FWHM
3000 km s-1, ranging from 500 to 7000 km s-1 in
different objects. The full widths at
nearly zero intensity (FW0I) of these same lines, so well as they can be
defined, range from 5000 to 30,000 km s-1
(Osterbrock and
Shuder 1982).
4959, 5007, [N
II] 6548, 6583; other lines include [O I]
6300, 6364, [S II]
6716, 6731, often [Fe VII]
6087, and in many cases [Fe X]
6375. The Seyfert 1 nuclei
spectra include all these 'narrow' broad emission lines,
plus much broader emission lines of H I, He I, He II and Fe II,
typically with FWHM
3000 km s-1, ranging from 500 to 7000 km s-1 in
different objects. The full widths at
nearly zero intensity (FW0I) of these same lines, so well as they can be
defined, range from 5000 to 30,000 km s-1
(Osterbrock and
Shuder 1982).
It is evident from these line spectra that in AGNs, as in nearly all
other astronomical
objects we know, H is by far the most abundant element, He next, O, Ne,
N, C next,
etc. The simplest interpretation is that the narrow lines are emitted in
a `narrow-line
region' (NLR) in which the velocity field ranges up to a few hundreds of
km s-1,
and the broad lines in a `broad-line region' (BLR) in which the velocity
field ranges
up to as high as 10 or 15 km s-1. The (nearly) complete
absence of forbidden line
emission from the BLR can only mean that in it they are all
collisionally de-excited;
this implies that the electron density throughout this region is much
higher than the
critical densities for collisional de-excitation of all the
strong forbidden lines observed from the NLR and in gaseous nebulae (see, e.g.,
Osterbrock 1989).
From the known
transition probabilities and collision strengths for collisional
excitation of the forbidden
lines of the expected more abundant ions, this limit is roughly
Ne  108 cm-3.
An upper limit to the electron density in the BLRs may be set from the observed
presence in many Seyfert 1 and QSO spectra of semi-forbidden C III]
1909 emission,
with a FWHM comparable to those of the permitted lines. Its transition
probability,
A = 96 s-1, intermediate between those of typical
permitted and forbidden lines, and
its critical electron density Nec
 3 x 10⁹
cm-3. The density in the regions of the BLR
in which C III] 1909 is
emitted with appreciable strength cannot be much higher
than this, and an intermediate density Ne
109
cm-3 has frequently been taken as
roughly representative of the BLR. However, recent evidence discussed in
section 2.7
argues for higher densities, and thus for appreciable collisional
de-excitation.
3 x 10⁹
cm-3. The density in the regions of the BLR
in which C III] 1909 is
emitted with appreciable strength cannot be much higher
than this, and an intermediate density Ne
109
cm-3 has frequently been taken as
roughly representative of the BLR. However, recent evidence discussed in
section 2.7
argues for higher densities, and thus for appreciable collisional
de-excitation.
The interpretation then of a Seyfert 1 AGN is that it contains a BLR and
a NLR; of a
Seyfert 2, that it contains only a NLR, or as we shall discuss in some
detail in section 6,
that it contains a NLR and a `hidden' BLR that we do not directly
observe, because of
intervening material that cuts off the direct radiation from it toward
us. Intermediate
cases can also be recognized. Seyfert 1.5 is the classification type
generally used for
objects whose spectra show H I emission lines with strong broad and
strong narrow
components, while Seyfert 1.8 and 1.9 are the types used for objects in
which the broad component of
H is very weak or
undetectable, respectively
(Osterbrock 1984).
is very weak or
undetectable, respectively
(Osterbrock 1984).
Diagnostic information is available on the physical conditions within
the NLRs. From
the measured ratios of the strengths of emission lines with different
upper levels, such
as [O III] [I(4959) +
I(5007)] /
I(4363) and [S II]
I(6716) /
I(6731), a representative
`mean' electron temperature and density may be derived for each observed NLR.
Typical values are T
15,000 K and Ne
3 x 10³
cm-3. There is no direct diagnostic
that gives a representative mean temperature for the BLR, but on general
grounds an
estimate T 15,000 K
also is plausible.
Of course these are highly simplified representations of what must be in
reality an
extremely complicated situation. In the somewhat analogous case of a stellar a
atmosphere we know that the density and temperature increase inward, but
for the roughest
semi-quantitative description we may represent it by a single
`effective' temperature
and a single `mean' density. A better representation is to take two
representative
points, still better, three, and the only true description is the
detailed run of mean
temperature and density with depth, with the fluctuations around these
mean values
in space and time. In the case of a Seyfert 1 galaxy a description in
terms of one
representative point is too simplified to be useful; we must specify at
least two points
`the BLR' and `the NLR'. In fact there must be a continuous transition
between these
two idealized `regions', and large variations in the physical conditions
within each of
them. Certainly diagnostic line ratios of different ions give different
mean temperatures
and/or densities, indicating real variations in T and
Ne within the NLR; the
quoted values are the best overall fits to the various different
determinations. In all
gaseous nebulae we know, ionized gas tends to be clumped in
condensations on all
scales down to the smallest observable, so the mean density indicated by
emission-line
processes, dominated by the denser regions of the condensations, is
higher than the
mean density given by the total number of particles within the whole
volume of the
nebula. This can be represented by a `filling factor' f, giving
the fraction of the volume
occupied by dense condensations. It corresponds to describing the nebula
as consisting
of two phases: gas, with electron density Ne and
relative volume f, and vacuum or a
much hotter, lower-density gas with the same pressure and relative
volume 1 - f. For
typical nebulae f
10-2.
From this picture the approximate size of a typical NLR in a Seyfert
galaxy nucleus
can be estimated from its luminosity in a particular emission line, for
instance H. It
is well understood as arising largely from recombination of protons and
electrons to
levels n  4 followed by
downward radiative transitions, and the luminosity in
H
can be written
4 followed by
downward radiative transitions, and the luminosity in
H
can be written
|
Here  H is the effective
recombination coefficient for emission of an
H photon,
h
H is the effective
recombination coefficient for emission of an
H photon,
h is
its energy, and the product of the first four factors is the emission
coefficient per unit
volume, while V is the total volume of the NLR. To a sufficiently
good approximation
Ne = Np + l.5 NHe
(H completely ionized to protons, and He half to He+ and half
to He2+). The recombination coefficient
H varies only
slowly with T, and if to be
specific we assume T = 104 K and a spherical volume,
is
its energy, and the product of the first four factors is the emission
coefficient per unit
volume, while V is the total volume of the NLR. To a sufficiently
good approximation
Ne = Np + l.5 NHe
(H completely ionized to protons, and He half to He+ and half
to He2+). The recombination coefficient
H varies only
slowly with T, and if to be
specific we assume T = 104 K and a spherical volume,

|
will give the radius R. The most luminous NLRs of Seyfert
galaxies have
L(H)
2 x 10⁸
L , which gives
M 7 x 10⁵
(104 / Ne)
M and
R 20
f-1/3 (104 /
Ne)2/3 pc.
Such an NLR with Ne = 104 cm-3
will therefore have a mass of ionized gas M
106
M
and, for an assumed filling factor f = 10-2, R
90 pc. In fact a few of the
nearest
Seyfert 2 NLRs are resolved on direct images, and have apparent
diameters of the order 100 pc or so.
, which gives
M 7 x 10⁵
(104 / Ne)
M and
R 20
f-1/3 (104 /
Ne)2/3 pc.
Such an NLR with Ne = 104 cm-3
will therefore have a mass of ionized gas M
106
M
and, for an assumed filling factor f = 10-2, R
90 pc. In fact a few of the
nearest
Seyfert 2 NLRs are resolved on direct images, and have apparent
diameters of the order 100 pc or so.
Typical BLRS are much smaller. The observed Balmer decrements, or ratios of
intensities of H I lines
I(H) :
I(H) :
I(H )
etc. show that other processes in
addition to recombination contribute to the H I line emission in these
denser objects.
However, for a rough estimate we can ignore them and use the same approximate
calculation. The most luminous Seyfert 1 AGNs typically have
L(H)
109
L, which
gives M
36 M
(109 / Ne) and R
0.015
f-1/3 (109 /
Ne)-2/3 pc. Thus for a representative
density Ne
109
cm-3, the mass of ionized gas in the BLR is only M
40
M,
and for an assumed f
10-2, R
0.07 pc 0.2 light year. This
is far too small to
hope to resolve, even in the nearest Seyfert is, and to date none has
been resolved.
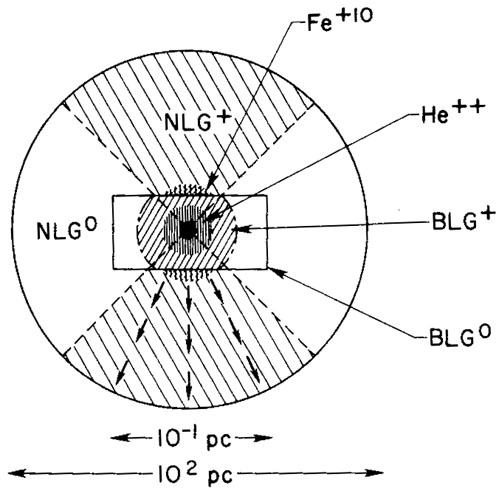
Figure 1 is a highly schematic drawing (not
necessarily all at the same scale) of these
various regions, with the central black hole, its BLR shown as
cylindrically symmetric,
and the NLR as spherically symmetric.
)
etc. show that other processes in
addition to recombination contribute to the H I line emission in these
denser objects.
However, for a rough estimate we can ignore them and use the same approximate
calculation. The most luminous Seyfert 1 AGNs typically have
L(H)
109
L, which
gives M
36 M
(109 / Ne) and R
0.015
f-1/3 (109 /
Ne)-2/3 pc. Thus for a representative
density Ne
109
cm-3, the mass of ionized gas in the BLR is only M
40
M,
and for an assumed f
10-2, R
0.07 pc 0.2 light year. This
is far too small to
hope to resolve, even in the nearest Seyfert is, and to date none has
been resolved.
Figure 1 is a highly schematic drawing (not
necessarily all at the same scale) of these
various regions, with the central black hole, its BLR shown as
cylindrically symmetric,
and the NLR as spherically symmetric.
|
Figure 1. Schematic representation of structure of an active galactic nucleus, including central black hole and accretion disk (black), cylindrically symmetric broad-line region (BLR) containing ionized (BLG+) and neutral (BLG0) gas, with highest stages of ionization such as He2+ concentrated closest to ionization source. Narrow-line region (NLR) taken here to be spherically symmetric, but ionized (NLG+) only in the core in which ionizing radiation from central source can escape or penetrate through the NLR. The figure is necessarily not to scale. (Osterbrock 1978a) |
Next let us discuss the energy-input mechanism for the ionized gas,
first in the NLR.
The relatively low electron temperature, T
15,000 K, together with the
ionization
extending to such high stages as O2+ and Ne2+,
shows that the main energy-input
mechanism must be photoionization. The only other forms of energy input
we know,
conversion of kinetic energy into heat either through shock waves
(`cloud-cloud collisions')
or beams of particles being stopped, require much higher temperatures for the
observed degree of ionization.
Furthermore AGNs have a strong continuous spectrum. Presumably it arises from the accretion disk. In typical objects, in the optical and observable ultraviolet spectral regions, it follows approximately a power-law form

|
|
Figure 2. Reddening-corrected [O III]
|
with n 1.2. This
spectrum, extrapolated further into the ultraviolet and x-ray
regions, apparently is the source of the ionizing photons. This is
indicated by the fact that the equivalent width of the observed
H emission, that is
|
is approximately constant for most Seyfert 2 NLRs. This is exactly what is expected under photoionization by a spectrum of fixed form, such as a power law, if the total number of ionizing photons is balanced by the total number of recombinations
|
where B is the
effective recombination coefficient while the luminosity in
H comes
from a definite fraction of those recombinations
|
A power-law form for the photoionizing spectrum is harder than any O
star spectrum,
which always falls off roughly as exp (-h
/ kT*). This
explains both the higher stages
of ionization in the AGN spectra than that in H II regions, and the
great strength
of the lines of low ionization, such as [O I] and [S II], which arise in
the long partly
ionized region maintained by the high-energy, penetrating photons.

|
Figure 3. Reddening-corrected [O III]
|
These qualitative conclusions are confirmed by quantitative models, calculated
using various power-law input spectra, chosen to match approximately the
observed
luminosities and frequency dependence of the observed NLRs. Some of the
most complete of such calculated models are those by Aldrovandi and Contini
(1984,
1985),
Contini and
Aldrovandi (1983),
Ferland and Netzer
(1983),
Halpern and Steiner
(1983),
Stasinska
(1984a,
1984b), and
Binette (1985).
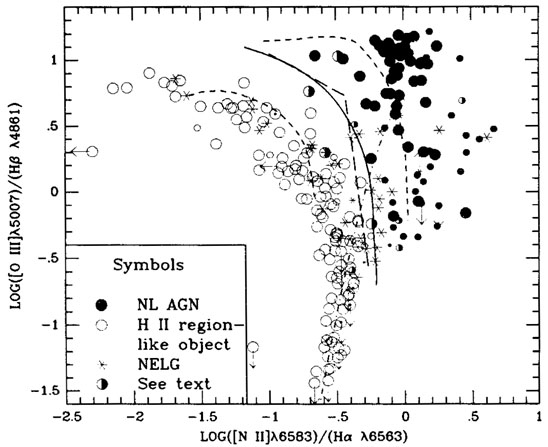
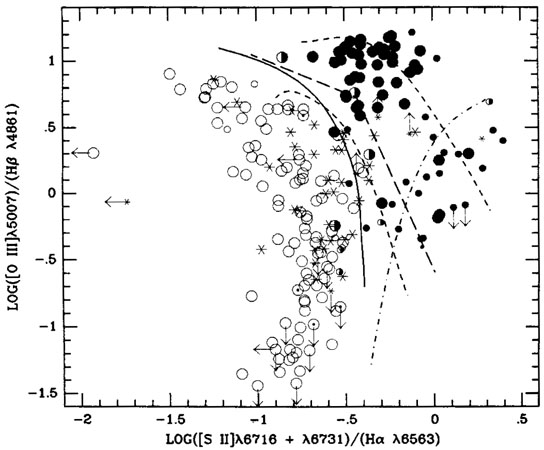
For instance, figures 2,
3 and 4 show the line ratios
I([N II] 6583) /
I(H), I([O I]
6300) /
I(H), and I ([S
II] 6716 +
6731) /
I(H)
plotted against I([O III]
5007) /
I(H). These
are the best diagnostic ratios to
distinguish between AGN spectra and H II region or starburst-galaxy
spectra of those originally proposed by
Baldwin et al
(1981).
The black circles represent measured
ratios for the AGNs, and the open circles are the measured ratios for H
II regions in
other galaxies, starburst, and H II region galaxies, all known to be
photoionized by
O stars. The full line on each diagram is the empirical division between
AGNs and
H II regions. The short broken lines represent sequences of AGN models,
calculated
with input power-law spectra with n = 1.5, Ne
103
cm-3, and either essentially
solar abundances of the elements (upper right curves on all three
diagrams) or with
the abundances of all the heavy elements reduced by a factor 10 relative
to H and He
(lower left curves). Along each of these curves the ionization parameter
|
essentially the ratio of density of ionizing photons to density of free
electrons, decreases
from  = 10-1.5 at
the upper left end to =
10-4 at the lower right. The long
broken lines represent three models calculated with the same input spectrum and
solar abundances, but containing two types of clouds, with
Ne = 102 and 106
cm-3,
to mimic roughly the effects of density variations within the object and
collisional de-excitation.
= 10-1.5 at
the upper left end to =
10-4 at the lower right. The long
broken lines represent three models calculated with the same input spectrum and
solar abundances, but containing two types of clouds, with
Ne = 102 and 106
cm-3,
to mimic roughly the effects of density variations within the object and
collisional de-excitation.
|
Figure 4. Reddening-corrected [O III]
|
It can be seen that the calculated models with power-law input spectra match the observed line ratios for AGNs reasonably well, and do not agree at all with the observed ratios for H II regions and galaxies. These latter, however, are well represented by models with O star input photoionizing spectra (Veilleux and Osterbrock 1987). Note that for the composite density and hence presumably the most realistic AGN models, the [O I] and [S II] data are matched well with `normal' solar abundances, but for [N II] an increase in the abundance (in the first order, of N alone) by roughly a factor of three is indicated by the observed ratios.
The only justification for assuming a power-law form of spectrum is that it is simple. A broken power law, more nearly flat at high energies, may be the next best approximation to reality (see section 3.3). Much more complicated forms, based on observational data and reasonable extrapolations, have been used by Mathews and Ferland (1987), Ferland and Persson (1989), and others. Some other types of input spectra, all sharing the property of including photoionizing spectra over a wide range of energies, have been investigated by Binette et al (1988).
It should be noted that, in addition to recombination, collisional
excitation also
makes an appreciable contribution to the strength of the H I lines,
particularly of
L and
H. The reason is that the gas
clouds in AGNs, photoionized by a `hard'
spectrum (containing relatively many high-energy photons in comparison
with O-star
spectra) have large partly ionized zones in which both H0 and
free electrons exist, in
contrast to gaseous nebulae, in which the ionization of H and the free
electron density
drop very abruptly together at the edge or boundary of the neutral
region. The NLR models typically give calculated intensity ratios
I(H) /
I(H) = 3.1,
which must be
used to determine the reddening by dust observationally, rather than
2.85 as in pure recombination
(Gaskell and Ferland
1984).
It is not so clear that photoionization is the main energy-input
mechanism to the
ionized gas in the BLR, but this interpretation seems most likely. The
main diagnostic
evidence is that the equivalent widths of the H I emission lines,
specifically either H or
H, expressed in
terms of the featureless continuum, are more or less the
same for Seyfert 1 and 2 galaxies, QSOs, and radio galaxies, and fit the
predicted
relationship for a power law with n
1.2
(Yee 1980,
Shuder 1981).
This is the
expected result of photoionization, as discussed in
section 2.3, but it is not unique;
if some other energy-input mechanism, say injection of fast particles or
high-kinetic-energy
clouds, were closely proportional to the luminosity in the featureless
continuum,
the observational result would be the same. No such process has been suggested.
In addition, the observed tight correlation between continuum and broad
emission-line
variability makes it difficult to consider any other
source. Furthermore, detailed
photoionization models can be adjusted to fit approximately the observed
spectra.
However, it is quite possible that a non-negligible fraction of the
heating in some or
all BLRs results from dissipation of mechanical energy, as well as from
photoionization.
Calculating the expected emission-line spectra of model photoionized
BLRs is more
complicated than for gaseous nebulae and NLRs. In the latter objects the
density is low
enough so that the fundamental nebular approximation, that essentially
all ions and
atoms are in their lowest energy levels and that processes involving
ions in excited levels
can be neglected, except for emission of photons, is generally
valid. Furthermore the
optical depths in nearly all the lines are small, and for other lines,
such as the Lyman
series of H, it is a good approximation to consider them infinitely
thick optically. Very
complete calculations are available for the H I and He II recombination
spectra in this nebular approximation
(Hummer and Storey
1987).
They take into account all the
radiative and collisional processes that are relevant up to densities
Ne
107 cm-3 for
the H I spectrum and 109 cm-3 for He II. The
energy-level diagram of He I is more
complicated, but calculations on a reasonably good approximation are
also available for it
(Brocklehurst 1972,
Almog and Netzer 1989).
They also include all relevant
collisional processes (but the various cross sections are not as
accurately known for this
two-electron atom), and in addition approximately include
radiative-transfer effects in
a uniform finite-thickness slab approximation. As a result these He I
calculations are
stated to be correct (within the limitations of the highly simplified
model geometry
and the available values of the collision cross sections) up to
Ne
1014 cm-3.
Most of the earlier theoretical work on BLRs was done on the H I line
spectrum of a dense, optically thick region
(Kwan and Krolik 1981).
Generally these papers assumed
uniform density and temperature, but went beyond the low-density nebular
approximations
in including collisional and radiative excitation and ionization from excited
levels, and also line radiative-transfer effects in a simplified
approximation. One of
the striking early observational discoveries in the spectra of
redshifted quasars is that
H I L is relatively weak with
respect to the Balmer lines, so that the intensity ratio
I(L) /
I(H)
10 typically, rather than 30
as expected in nebular-type (low-density) spectra. The reason is that in
dense BLRs L photons are not
simply scattered, but are
`destroyed' by Balmer-line absorption processes and collision processes
which remove
H0 atoms from tile excited 22P level before they
emit a L photon. Dust extinction
also plays a role, but the discrepancy does not result from it alone.
The best recent papers take into account heating by photoionization,
include other ions in addition to H and He, determine the equilibrium
temperature at each point
from the balance with radiative cooling, and calculate the emergent
spectrum
(Kwan 1984).
The relevant parameters, in addition to the form of the photoionizing spectrum,
are the input ionization parameter
, the assumed constant density
N0 and the total
optical depth of the model `cloud' (semi-infinite slab) at the Lyman
limit. In a general
way, models with ionization parameters derived from the luminosities and
reasonable
interpolations and extrapolations of the observed spectra of AGNs into
the photoionizing region, Ne
109
cm-3 and sizes of BLRs previously mentioned approximately
fit their observed emission-line spectra.
One very interesting but complicated set of diagnostics is the strength of the
Fe II features in the optical region. These are blends of large numbers
of individual
emission lines belonging to several multiplets especially concentrated
in the regions
around 4570, 5120, 5320. They make up a
significant fraction of the flux in the
optical part of the spectrum in many Seyfert 1 galaxies
(Wills et al
1985).
All the observed lines arise from upper levels connected with the ground
configuration of Fe II by permitted ultraviolet resonance
transitions. They are evidently
excited by collisional and radiative fluorescence processes, and the
optical depths in the resonance lines are clearly large
( 0 ~ 104 in
the stronger transitions). Since Fe+
is a relatively low stage of ionization (the ionization potential of
Fe0 is 7.9 eV), the
Fe II lines are emitted quite strongly in the large partly ionized zone,
or `transition
zone', in which the ionization of H is dropping from nearly completely
H+ to nearly completely H0
(Netzer and Wills
1983).
In this region the bulk of the ionization occurs
by highly penetrating x-ray photons. The Mg II emission
2798, 2803 lines observed
in many (redshifted) QSOs and quasars, and Ca II
8498, 8542, 8662, observed in many (low-redshift) Seyfert 1s
(Persson and McGregor
1985,
Persson 1988)
also arise
in this zone, as does a significant fraction of the H I line emission
(Collin-Souffrin et
al 1982,
Collin-Souffrin and
Dumont 1986).
0 ~ 104 in
the stronger transitions). Since Fe+
is a relatively low stage of ionization (the ionization potential of
Fe0 is 7.9 eV), the
Fe II lines are emitted quite strongly in the large partly ionized zone,
or `transition
zone', in which the ionization of H is dropping from nearly completely
H+ to nearly completely H0
(Netzer and Wills
1983).
In this region the bulk of the ionization occurs
by highly penetrating x-ray photons. The Mg II emission
2798, 2803 lines observed
in many (redshifted) QSOs and quasars, and Ca II
8498, 8542, 8662, observed in many (low-redshift) Seyfert 1s
(Persson and McGregor
1985,
Persson 1988)
also arise
in this zone, as does a significant fraction of the H I line emission
(Collin-Souffrin et
al 1982,
Collin-Souffrin and
Dumont 1986).
Quite recently evidence from time variations of the strengths and
profiles of broad
emission lines in some AGNs has suggested that their BLRs may be
considerably smaller
than previously estimated (see section 2.7). This
would imply that their mean densities
are considerably higher than 109 cm-3. Calculated
models are therefore required with
densities up to Ne
1013
cm-3. In this regime the physical conditions are more nearly
similar to those in stellar atmospheres then in typical gaseous
nebulae. Three-body
recombination, large optical depths in many lines, and even Stark
broadening (which
affects the optical depths) must be taken into account. The models
calculated to date with mean densities Ne
1013
cm-3 do not match the observed line spectra and
line profiles of BLRs nearly as well as the models with characteristic
mean densities
Ne
109 cm-3, but the models with mean densities up to
Ne
1010.5 cm-3 are quite acceptable
(Rees et al
1989).
All the published models assume simple density laws,
but undoubtedly the actual BLRs are much more complicated.
One problem in any photoionization model, whether of an NLR or a BLR, is the
physical origin of the small filling factor, that is, the clumping as
gas into density
condensations or `clouds'. If not confined they should quickly
dissipate, essentially at
the speed of sound ( 10 km
s-1) and after the `sound crossing time', approximately
104 y for a BLR with R = 0.07 pc, should no longer
exist. Perhaps they are constantly
regenerated by turbulent processes; perhaps they are confined by a hot,
low-density
invisible gas with which they are in pressure equilibrium. The most
widely accepted
picture is that this intercloud gas is at T
108 K
(Krolik et al
1981).
However, recent theoretical studies by
Fabian et al
(1986) and
Mathews and Ferland
(1987)
show that such gas could not escape detection somewhere in the x-ray,
ultraviolet or
infrared continua of AGNs, as it has to date. Thus whether it exists,
and its nature if it does, are uncertain.
Rees (1987)
has suggested that magnetic fields may provide
the confinement mechanism. The models previously described simply adopt various
power-law forms for the pressure of the assumed confining medium without
specifying their physical cause.
So many energy levels and so many transitions are involved in the Fe II
emission-line
spectrum that it is difficult to model with currently available computers and
calculated atomic parameters. Ca II, with only five relevant levels, is
much more
straightforward. The model calculations show that its emission lines
must arise in
slightly ionized regions at very large optical depths for ionizing
radiation from the
central source, that is, large column densities, NH
1024.5
cm-2. At these large
densities and large optical depths the radiative heating and cooling
processes familiar
in most nebular contexts are ineffective, and processes such as Compton
scattering of
high-energy photons by bound electrons, photoionization of C0
and H- by photons
with h < h
0, and photoionization
of Fe0 K and L electrons by x-rays all come into play
(Collin-Souffrin et
al 1988,
Ferland and Persson
1989).
Even small amounts of dissipation of kinetic energy by heat would also
be important
(Collin-Souffrin et
al 1986).
The observed continuous spectra of AGNs are very complicated mixtures of
several
components. One is a power law extending from the infrared to soft x-ray
spectral
regions, as previously described, but superimposed on it is a broad
continuum which
extends over the range roughly 1014.5 Hz <
< 1016.5 Hz, with a peak
somewhere
between. This is generally called the `big blue bump' (meaning on a plot
of flux Fv, or
even better
F against
frequency), and it is further contaminated by the `little blue
bump', in the near ultraviolet, consisting of Balmer continuum emission
and many unresolved Fe II emission multiplets
(Wills et al
1985).
The big blue bump is
generally attributed to dissipation of energy in an accretion disk near
the central black hole
(Shields 1978).
Various types of accretion disks might exist, for instance thin
disks, radiation tori and ion tori, differing in the physical processes
that dominate in fixing their structure
(Begelman 1985).
Which actually occurs, or which occur in
which specific objects, depends on details of the release of energy in
the accretion
disk that are not yet understood. The simplest and most straightforward case to
calculate is the (geometrically) thin disk, which is optically
thick. Most published
interpretations of observational data have been made in terms of this
model. For
the high-luminosity QSOs, in which the underlying integrated-stellar
galaxy continuum
spectrum makes the smallest contribution and the fit to the blue bump is best
determined, an accretion-disk continuum provides a significantly better
match to the
observed spectrum than a blackbody does. Both have two parameters,
M and  for
the accretion disk, or L and T for the blackbody. The
calculated spectra of accretion
disks about either a Schwarzschild (non-rotating) or Kerr (rotating) black hole
fit equally well; the indicated mass of the Schwarzschild black hole is
about two to
three times that of the corresponding Kerr black hole. The calculated
spectrum of an
accretion disk depends on the angle i between its normal and the
line of sight, but
this angle cannot be determined from the fitted data; to the accuracy of
the data an
increase in i can be compensated for in the emergent spectrum by
an increase in M and
(Malkan 1983).
for
the accretion disk, or L and T for the blackbody. The
calculated spectra of accretion
disks about either a Schwarzschild (non-rotating) or Kerr (rotating) black hole
fit equally well; the indicated mass of the Schwarzschild black hole is
about two to
three times that of the corresponding Kerr black hole. The calculated
spectrum of an
accretion disk depends on the angle i between its normal and the
line of sight, but
this angle cannot be determined from the fitted data; to the accuracy of
the data an
increase in i can be compensated for in the emergent spectrum by
an increase in M and
(Malkan 1983).
Observations over a wide frequency range are necessary to eliminate or fit the
power-law continuum, the Balmer continuum, the Fe II features, and the
underlying
integrated-stellar galaxy continuum. The energy dissipation in the
accretion disk
increases inward toward the black hole, as a result of the Keplerian
velocity field in
the disk. This leads to an increase of effective temperature inward,
with the highest
energy photons coming from the inner edge of the accretion disk. The emergent
spectrum at each radius has been calculated for various theoretical
models in various approximations
(Czerny and Elvis 1987,
Wandel and Petrosian
1988).
The most recent
published treatment takes into account detailed calculations based on
the Kerr metric
of a rotating black hole spun up to the maximum angular momentum-to-mass ratio
(Sun and Malkan 1989).
On physical grounds it should be the best approximation to
the actual situation in nature
(Thorne 1974).
There are relativistic effects especially on
the radiation from near the inner edge of the accretion disks. The
emergent spectrum
depends on the mass of the black hole M, the accretion rate
, and the inclination
of the disk to the line of sight. All the cited papers agree that their
respective models
and fitting procedures give AGN black holes masses ranging from
107.5 to 109.5
M,
the higher range of masses M = 108 to 109.5
M corresponding
to QSOs and the lower
range 107.5 to 108.5
M corresponding
to Seyfert 1 nuclei. Furthermore, the most
luminous QSOs tend to have mass accretion rates and luminosities nearly
as large
as the Eddington luminosities LE corresponding to the
derived masses of their black
holes, while the less luminous Seyfert 1 nuclei typically have
luminosities only a few
percent of their Eddington luminosities. The most recent, and to date
most physically complete model calculations, are those of
Laor and Netzer (1989).
They found that the
upper limit to the luminosity for a thin disk is L <
0.3LE, and that all the AGN-model
thin disks are dominated by radiation pressure.
However, it must be recognized that real problems remain in fitting the
observed
spectra with thin accretion disk models. Earlier calculations predicted
a large absorption discontinuity at the Lyman limit
(912), while the
Laor and Netzer (1989)
calculations predict a large emission discontinuity there. The
observations show
neither, and furthermore the polarization predictions are difficult to
reconcile with the observational data
(Antonucci et
al 1989).
The case is not closed.
The ultraviolet line spectrum of AGNs is simply an extension of the
optical line
spectrum to the region beyond the atmospheric cutoff imposed by the
Earth's atmosphere.
In low-redshift Seyfert nuclei the ultraviolet region is not observable
from the ground;
in high-redshift QSOs it is redshifted into the optical region and
becomes observable,
but correspondingly the optical region is redshifted toward the infrared
and out of the
region in which optical detectors work. For instance in a QSO with
z = 1.7, L is
shifted to ~ 3280, barely
observable with any efficiency at a ground based observatory,
but H is shifted to
~ 13125,
beyond the range of sensitivity of a CCD. As a
result, reasonably complete data are available on the emission lines
over a wide range
in wavelengths only for fairly bright Seyfert galaxies, observable in
the ultraviolet with
the IUE satellite. They show that the ultraviolet spectra of Seyfert 1
galaxies are quite similar to those of QSOs
(Wu et al 1983,
Clavel and Joly 1984).
In QSOs with emission lines, H I
L, if in the observable range,
is nearly always the strongest line. Very frequently C IV
1549, a close doublet which
is unresolved in
all broad-line objects, is also quite strong. Thus in objective prism or
grism surveys
aimed at finding more QSOs, if only a single emission line is seen in a
spectrum, the best working hypothesis is that it is
L, or if not
L,
1549.
The best tests of any model for a particular AGN or a particular class of AGNs are comparison of the predicted spectrum with observational data over the entire ultraviolet, optical and infrared regions, to as long a wavelength as possible (Ferland and Osterbrock 1986, Ferland and Osterbrock 1987, Oliva and Moorwood 1990).
A considerable fraction of all observed Seyfert 1 nuclei, and many QSOs as well, have been observed to vary in light. Among those which vary with reasonably large amplitude for which time-resolved spectral data are available, the strengths of the broad emission lines and their profiles have also been observed to vary. From the physical picture it is seen that the gas in the BLR is photoionized by continuum radiation from the central source, and that the photoionizing continuum varies together with the optical continuum, these variations must give information on the size and geometry of the BLR. This subject has been very well summarized recently by Peterson (1988).
The first observational recognition of these time-variable broad-line profiles
occurred from comparisons of spectra of the same object taken at times
separated by
months or even years. Systematic study of the phenomenon requires
observations at
much more frequent intervals. These are difficult to arrange, except
with a telescope,
spectral scanner and a team of observers dedicated to the project. The
most complete
data now available have observations of NGC 5548 with average sampling
intervals
of 3 to 4 nights. In general, the response of a finite BLR to a pulse of
photoionizing
continuum radiation is expected to occur on a time scale
LT = R/c, the
light-travel
time across the region. (The recombination time, on which the gas
responds to the
pulse on its arrival, is short compared to typical light-travel times.)
Cross-correlating
the continuum and individual broad emission-line light curves (for
instance H I L,
Mg II 2798, C III]
1909, C IV
1549, or
H) for different
assumed lags, and finding
the lag for which the cross-correlation is a maximum is the most
objective method of
determining the light-travel time. This phase shift depends on the
geometrical structure
of the object and can be calculated for simple models; it is straightforward to
show that, for instance, for a thin spherical shell of gas centered on
the nucleus, the
phase shift is exactly LT
as defined previously
(Gaskell and Sparke
1986).
In these space-based observations of NGC 5548, different time delays have been
found for different lines, namely R
4 to 10 light days for the
highest ionization
He II 1640 and N V
1240 emission lines, ~ 12
light days for H I L, 8 to 16 for
C IV 1549, and 26 to 32 for C
III] 1909, while for Mg II
2798 the variations
are small and the phase lag is not well determined but is even longer
(Clavel et al
1991).
These results agree with the photoionization model predictions that the degree
of ionization decreases outward from the central source (unless the
density decreases
very strongly) and the usual assumption that the density probably also
decreases
outward, but not faster than R-2. Ground based
measurements on the variations
of H and
H in NGC 5548 by
Netzer et al
(1990)
over a 5-month interval in 1988
give a phase lag corresponding to R = 7 light days. These authors
assumed various
simplified models for the BLR structure, used the observed continuum
light curve as
the input photoionizing spectrum, calculated the response of each model,
and varied
the parameters to get the best fit. For a spherical thin-shell model
they found R = 7±3 light days. (This agrees with the IUE
results for
L.) Thin shells with R
14 light
days could be excluded at the 95% confidence level, likewise thick
shells with inner
radius Ri = 4 light days and outer radius
Ro > 40 light days, also thin disks inclined
by 60° to the line of sight with Ri = 7 light
days and Ro 30
light days. On the other
hand a large consortium of observers, observing the same nucleus over 10
months in
1988-89, with what appeared to be better signal-to-noise-ratio data and
at a time of larger variation, found a phase lag R ~ 20 light days
(Peterson et al
1991).
Their analysis is still in progress, but there appears to be a clear
contradiction between the two sets of data on the phase lag of the
H variation. Note
the difference with the phase lag ~ 12 days found for
L for essentially the same time
interval
(Clavel et al
1991).
It is not theoretically understood at this time.
For this object the standard photoionization model which best fits the relative
emission-line strengths, =
10-2
(Mushotzky and Ferland 1984),
has, for mean Ne =
1010 cm-3, a radius R = 150 light days,
larger by a factor 20 than that implied by the
time-variation measurements interpreted by the spherical thin-shell models of
Netzer et al
(1990).
Two Seyfert AGNs extensively studied for variation are NGC 4151 and Akn 120.
For NGC 4151 the early data gave a wide range of values of
LT (or R, expressed in
light days) for different lines, but closer analysis shows the
differences are dominated
by observational uncertainties resulting from inadequate time sampling
and insufficient
signal-to-noise-ratio data. All the measurements agree with R ~ 7
light days, with an
uncertainty by a factor two. This does not disagree significantly with
the value from
the static photoionization model that best fits the observed mean
broad-line spectrum, R ~ 16 light days.
The recent optical variation measurements for NGC 4151 are among the best
available for any AGN, because this low-luminosity Seyfert 1 is close
and relatively
bright. Hence it was measured with a very good signal-to-noise ratio
(Maoz et al
1991).
The cross-correlation technique, applied to the broad
H and
H emission
lines, give R = 9 ± 2 days, in reasonable agreement with the
previous measurements
and with the photoionization models. However, with the recent best data
it proved
possible to investigate the `transfer function', or response of several
possible simplified
BLR models to the light variation of the central continuum source. The
models with a
large ratio of the outer to inner radii (~ 10) and with the line
emission either constant
or decreasing outward from the center fit the observed variations best.
On the other hand for Akn 120 the cross-correlation technique gives
R  30 light
days, but the ionization parameter
that best fits the mean
observed spectrum then
demands Ne
1011 cm-3. Thus for some AGNs, including NGC 4151,
the best BLR
time-variation data agree with the photoionization models for mean
densities Ne
1010 cm-3, but for several others including
NGC 5548, Akn 120 and Mrk 279
(Maoz et al
1990)
the sizes, at least for H,
are smaller than expected at these densities. For this
reason the models with mean densities as high as Ne =
1013 previously mentioned are
being investigated. Comparisons of their predictions with the observed
spectra seem to
show that most of the line emissions comes from lower densities, with
Ne = 1010 cm-3
probably a more representative mean density, but up to
Ne = 1011 cm-3 is possible
(Rees et al
1989,
Ferland and Persson
1989).
Some of these BLR models assume a
wide range of densities, with a power-law decrease outward. A crucial
test is the C III
977 /
C III] 1909 line ratio, which is predicted to be about 4 at Ne = 1011 cm-3,
but about 0.3 if Ne = 1010 cm-3
both at T = 15 000 K, a reasonable temperature estimate
(Nussbaumer and Schild
1979).
There are few published observations of
C III 977, partly because of
its short wavelength and the related problem that it
lies in the L `forest' of
absorption lines in the spectra of distant QSOs. However,
in the IUE observations of six AGNs with the IUE by
Green et al
(1980),
four show C III] 1909
emission, and two of these are listed as having measured C III
977,
with intensity ratios I(C III
977) /
I(C III] 1909) = 2 for
PKS 1302-102 and 0.9 for
PG 1247 + 268. These would indicate mean densities (as measured by the C
III lines)
around 3 x 1010 cm-3 for these two AGNs. However,
later, better data suggest that the purported measurement of
977 for PKS 1302-102 was not
correct. For several other QSOS observed with the IUE, C III
977 has not been detected
(Gondhalekar 1990a,
Kinney et al
1991).
For these objects a very rough upper limit appears to be
I(977) /
I(1909) < 0.5,
corresponding to mean densities on any models published to
date Ne < 3 x 1010 cm-3. All
these QSOs, however, are considerably more luminous
than the Seyfert 1 galaxies observed for variability, and the question
of the viability
of standard photoionization models is definitely an open one at present.
30 light
days, but the ionization parameter
that best fits the mean
observed spectrum then
demands Ne
1011 cm-3. Thus for some AGNs, including NGC 4151,
the best BLR
time-variation data agree with the photoionization models for mean
densities Ne
1010 cm-3, but for several others including
NGC 5548, Akn 120 and Mrk 279
(Maoz et al
1990)
the sizes, at least for H,
are smaller than expected at these densities. For this
reason the models with mean densities as high as Ne =
1013 previously mentioned are
being investigated. Comparisons of their predictions with the observed
spectra seem to
show that most of the line emissions comes from lower densities, with
Ne = 1010 cm-3
probably a more representative mean density, but up to
Ne = 1011 cm-3 is possible
(Rees et al
1989,
Ferland and Persson
1989).
Some of these BLR models assume a
wide range of densities, with a power-law decrease outward. A crucial
test is the C III
977 /
C III] 1909 line ratio, which is predicted to be about 4 at Ne = 1011 cm-3,
but about 0.3 if Ne = 1010 cm-3
both at T = 15 000 K, a reasonable temperature estimate
(Nussbaumer and Schild
1979).
There are few published observations of
C III 977, partly because of
its short wavelength and the related problem that it
lies in the L `forest' of
absorption lines in the spectra of distant QSOs. However,
in the IUE observations of six AGNs with the IUE by
Green et al
(1980),
four show C III] 1909
emission, and two of these are listed as having measured C III
977,
with intensity ratios I(C III
977) /
I(C III] 1909) = 2 for
PKS 1302-102 and 0.9 for
PG 1247 + 268. These would indicate mean densities (as measured by the C
III lines)
around 3 x 1010 cm-3 for these two AGNs. However,
later, better data suggest that the purported measurement of
977 for PKS 1302-102 was not
correct. For several other QSOS observed with the IUE, C III
977 has not been detected
(Gondhalekar 1990a,
Kinney et al
1991).
For these objects a very rough upper limit appears to be
I(977) /
I(1909) < 0.5,
corresponding to mean densities on any models published to
date Ne < 3 x 1010 cm-3. All
these QSOs, however, are considerably more luminous
than the Seyfert 1 galaxies observed for variability, and the question
of the viability
of standard photoionization models is definitely an open one at present.
An alternative interpretation to the smaller size and consequent higher
densities
derived from time variations is that the geometry is anisotropic. If the
ray from
varying nucleus to the gas which responds to the variation makes an
angle  to the ray
from the nucleus to the observer, then the time lag of the variation by
this element of
gas is r(1 - cos) /
c. If the gas which is observed to vary lies within a cone of
small half-angle , the phase lag
to the ray
from the nucleus to the observer, then the time lag of the variation by
this element of
gas is r(1 - cos) /
c. If the gas which is observed to vary lies within a cone of
small half-angle , the phase lag
|
may be much less than R/c. This type of model, with a cylindrical geometry, a small opening angle, and the rear side occulted was proposed for 3C 446 by Bregman et al (1986). It is the preferred interpretation of Perez et al (1989a, 1989b) for their time variation data for many AGNs. It would seem to require that only a small fraction of AGNs be observed to vary. However, if the radiation is seen down the axis of a torus, which is opaque in directions near its equatorial plane, so the BLR itself is not visible from those directions, all observed BLRs could be variable. These cylindrically symmetric type models are discussed in section 4.
Some data are also available on the variability of the broad emission
lines L
and C IV 1549 in
high-luminosity QSOs, from multiple IUE observations
(Gondhalekar 1990b).
Since the observed emission-line spectra are essentially independent
of luminosity, the ionization parameter
and electron density
Ne are supposed to be
independent of L and hence the time scale for variation
|
However, the available observational data do not show this dependence, but in fact suggest that the time scale for variation is more nearly independent of luminosity. Thus again, more sophisticated models, probably with variable density and non-spherical geometry, will be necessary to fit the observed AGNs (Gondhalekar 1990b).
Variations are not expected in the `ordinary' narrow emission lines in
times less
than hundreds of years, and none have been observed. However, variations
have been
observed in [Fe X] 6375 in a
few high-ionization AGNs, most(certainly in NGC 5548,
on time scales of a few years. This is expected from photoionization
models, as such
high stages of ionization as Fe+9 are predicted to be at
distances of 0.1 to 1 pc from the ionization source
(Veilleux 1988).
2.8. Completeness of Seyfert galaxy samples
As mentioned in section 1, the first known Seyfert galaxies were recognized and classified on the basis of their emission lines on slit spectrograms. As only a few percent of luminous galaxies are Seyferts, this is a relatively inefficient method of finding new ones. Since many Seyfert 1 and some Seyfert 2 nuclei have strong blue and ultraviolet continua, it is possible to identify candidates on this basis from low-dispersion objective-prism photographic spectra surveys. This program was very successfully carried out at Byurakan Observatory by the late B. E. Markarian and his collaborators, and is now generally referred to as the First Byurakan Survey or FBS (Lipovetsky et al 1987). About 10% of the galaxies isolated by their ultraviolet continuum in this survey turned out to be Seyfert galaxies, on the basis of slit spectra; the other 90% are mostly star-burst galaxies in which the blue continuum comes from the hot stars rather than the accretion disk. More recently Markarian began a second survey (SBS), which has been carried on since his death by his collaborators, using fine-grain plates, objective prisms of various dispersions, and multiple limiting exposures with the prisms in different orientations (Markarian et al 1987). With these techniques they have been able to find much fainter Seyfert galaxies than had been previously recognized. There are many examples as faint as apparent magnitude mB = 17 or 18. In many cases slit spectra are obtained with the 6-m telescope before the identification is published. Nearly every galaxy listed in this SBS has been confirmed as a Seyfert galaxy. However, the level of completeness, that is what fraction of the Seyferts in the field have been found, is not at all well known.
Many of the known Seyfert galaxies were first identified as candidates in the FBS. But many Seyfert 2 galaxies were not found, because their blue continua are too faint to be picked up. Programs for obtaining slit spectra of all emission-line galaxies, or all galaxies down to a given magnitude, such as the Center for Astrophysics (CfA) redshift survey, have shown this by turning up many `new' Seyfert galaxies (Huchra et al 1982, Phillips et al 1983). By comparison with the CfA survey, it is known that among the brighter galaxies the FBS is 67% complete for Seyfert 1s, but only 44% for Seyfert 2s (Lipovetsky et al 1987).
Other, more recent, objective-prism surveys have aimed at finding
Seyfert-galaxy
candidates primarily by their emission lines, especially [O III]
4959, 5007, rather
than by the blue continuum. The largest area is covered by the
University of Michigan survey
(MacAlpine and
Williams 1981).
This method was applied, using a relatively
high-dispersion objective prism to detect relatively weak emission
lines, to a large field surrounding the North Galactic Pole
(Wasilewski 1983).
The limit of completeness of
such a survey clearly cannot really be given simply in terms of a
limiting apparent
magnitude; instead, it depends on a combination of the magnitude and the
strength
of the emission line or lines detected. Faint galaxies with strong
emission lines can be
detected as well as brighter galaxies with weaker emission lines
(Salzer 1989).
Thus a true complete magnitude-limited sample is difficult to obtain, or even to define. Earlier attempts at such samples were seriously deficient in lower-luminosity Seyfert 2 galaxies. The best approximation to a complete, magnitude-limited sample is one drawn from a slit-spectrum survey like the CfA, and taking the sample only down to a magnitude limit well above that of the catalogue. This leaves only a few objects, but is relatively well defined physically (Edelson 1987). Even so, it implies some ill-defined limit to the strength of the emission lines. It is clearly quite possible that many galaxies that are not called Seyfert galaxies have the same or similar phenomenon going on in their nuclei, but the characteristic emission lines are too faint to be detected. Some of the LINERS discussed in section 6.4 fit into this category, but `less active' less luminous, nuclei may well remain undetected.