Neutral Hydrogen (HI) in Galaxies
Observations of interstellar neutral hydrogen are based on the 21-cm
line. Intensity observations give information about the
amount and the distribution of HI; for rotation curves of galaxies
based on Doppler observations.
Reviews (methods, results, correlation with other parameters):
[Roberts, M.S. in Galaxies and the Universe (Sandage, A., Sandage, M.,
& warp in
the HI distribution at the extreme NE and SW of M31 is reported in
Emerson, D.T., Newton, K.in Structure and Properties of Nearby Galaxies
(Berkhuijsen, E.M., Wielebinski, R., eds.), Int. Astron. Union Symp.
77, Reidel, Dordrecht (1978). p. 183].
Warps in the HI distribution have been observed in the case of some
edge-on spiral galaxies
[Sancisi, R. Astron. Astrophys. 53 (1976) 159].
The distribution and the velocity field of HI in 20 bright northern
galaxies combined with optical UBV observations is discussed in
[van der Kruit, P.C., Searle, L. in Photometry, Kinematics and Dynamics of
Galaxies (Evans, D.S., ed.), University of Texas (1979). p. 93].
Interacting Galaxies:
- van Moorsel, G., Astron. Astrophys. 202 (1988) 59.
- Mirabel, I.F., Dottori, H., & Lutz, D., Astron. Astrophys. 256
(1992) L19.
- Hibbard, J.E., Guhathakurta, P., van Gorkom, J.H., & Schweizer, F.,
Astron. J. 107 (1994) 67.
- McNamara, B.R., Sancisi, R., Henning, P.A., & Janar, W., Astron. J.
108 (1994) 844.
Intergalactic HI-Clouds:
- Appleton, P.N., Ghio, F.D., van Gorkom, J.H., Schombert, J.M., &
Struck-Marcell, C., Nature 330 (1987) 140.
- Steidel, C.C., & Sargent, W.L.W., Astrophys. J. 318 (1987) L11.
- Schneider, S.E., Astrophys. J. 343 (1989) 84.
- Djorgovski, S.., Astron. J. 99 (1990) 31.
- McMahon, R.G., Irwin, M.J., Giovanelli, R., Haynes, M.P., Wolfe,
& A.M., Hazert, C., Astrophys. J. 359 (1990) 302.
- Hoffman, G.L., Salpeter, E.E., Lamphier, C., & Roos, T., Astrophys.
J. 388 (1992) L5.
- McNamara, B.R., Sancisi, R., Henning, P.A., & Janar, W., Astron. J.
108 (1994) 844.
Galaxies in the Zone of Avoidance:
- Kerr, F.J., & Henning, P.A., Astrophys. J. 320 (1987) L99.
- Chamaraux, P., Cayatte, V., Balkowski, C., & Fontanelli, P.,
Astron. Astrophys. 229 (1990) 340.
- Lake, G., Schommer, R.A., & van Gorkom, J.H., Astron. J. 99 (1990) 547.
- Martin, J.M., Bottinelli, L., Dennefeld, M., Fouque, P.,
Gouguenheim, L., & Paturel, G., Astron. Astrophys. 235 (1990) 41.
- Kraan-Korteweg, R.C., & Huchtmeier, W.K., Astron. Astrophys. 266
(1992) 150.
- Capaccioli, M., & Longo, G., Astron. Astrophys. Rev. 4 (1994) 293.
- Pantoja, C.A., Giovannardi, C., Altschuler, D.R., & Giovanelli, R.,
Astron. J. 108 (1994) 921.
- Seeberger, R., Huchtmeier, W.K., & Weinberger, R., Astron.
Astrophys. 286 286 (1994) 17.
- Huchtmeier, W.K., Lercher, G., Seeberger, R., Saurer, W., &
Weinberger, R., Astron. Astrophys. 293 (1995) 33.
HI in Voids:
- Brosch, N., Astrophys. J. 344 (1989) 597.
- Henning, P.A., & Kerr, F.J., Astrophys. J. 347 (1989) L1.
HI in Polar-Ring Galaxies:
- Richter, O.G., Sackett, P.D., & Sparke, L.S., Astron. J. 107 (1994) 99.
- van Driel, W., Combes, F., Casoli, F., Gerin, M., Nukai, N.,
Mijayi, T., Hamabe, M., Sofue, Y., Ichikava, T., & Yoshida, S., Astron.
J. 109 (1995) 943.
HI in New Nearby Galaxies:
- Kraan-Korteweg, R.C., Loan, A.J., Burton, W.B., Lahav, O.,
Furguson, H.C., Henning, P.A., & Lynden-Bell, D., Nature 372 (1994) 77.
- Huchtmeier, W.K., Lercher, G., Seeberger, R., Saurer, W., &
Weinberger, R., Astron. Astrophys. 293 (1995) 33.
- Krismer, M., Tully, R.B., & Goia, J.M., Astron. J. 110 (1995) 1584.
Many short papers of HI observations are presented in
[The Structure and Evolution of normal Galaxies (Fall, S.M.,
Lynden-Bell, D., eds.), Cambridge Univ. Press (1981)].
In 6 nearby spheroidal dwarf systems no HI was detected. This gives
an upper limit of the HI content of dwarf spheroidal galaxies as low
as a few parts in 104 by mass
[Knapp, G.R., Kerr, F.J., Bowers, P.F. Astron. J. 83 (1978) 360].
The HI mass and the ratio of hydrogen mass to total mass for 140
galaxies are given in
[Roberts, M.S. in Galaxies and the Universe (Sandage, A., Sandage, M.;
Kristian, J., eds.) = Stars and stellar Systems Vol. IX, Univ.
Chicago Press (1975). p. 309].
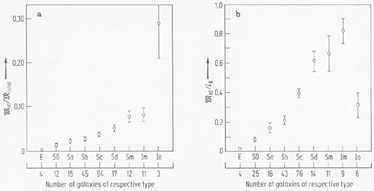
The distance-independent ratio MHI/L is a
function of the
morphological
type, too, increasing to later type galaxies. The main result is shown
in Fig. 8.
|
Figure 8. The average hydrogen content for
different morphological types of galaxies
[Li Zong-Yun, & Liu Ru-liang: Acta Astrophys. Sinica 1 (1981) 28;
Translation: Chinese Astron. 5 (1981) 205].
(a) Ratio hydrogen mass to total mass, (b) ratio mass to (blue) luminosity.
Number of galaxies for each type is indicated. The error bars represent the
standard deviation of the sample mean.
|
Integral properties like mass, luminosity, size, maximal rotation for
169 late-type galaxies determined from H I observations are given in
[Shostak, G.S. Astron. Astrophys. 68 (1978) 321].
Compact Groups:
- Williams, B.A., & van Gorkom, J.H., Astron. J. 95 (1988) 352.
- Rubin, V.C., Hunter, D.A., & Ford Jr., W.K., Astrophys. J. 365
(1990) 86.
- Williams, D.R., & Lynch, J.R., Astron. J. 101 (1991) 1969.
- Rodrigue, M., Schultz, A., Thompson, J., Colegrove, T., Spight,
L.D., Disanti, M., & Fink, U., Astron. J. 109 (1995) 2362.
TULLY-FISHER RELATION:
Tully and Fisher [Tully, R.B., Fisher, J.R. Astron. Astrophys. 54 (1977) 66].
found a relation between the absolute magnitude
and the global width of the HI profile for spiral galaxies, i.e. between
luminosity and total mass (Fig. 9). This gives a
new possibility for distance
determination. This relation was studied in the infrared.
- Aaronson, M., Huchra, J., Mould, J. Astrophys. J. 229 (1979) 1.
- Aaronson, M., Mould, J., Huchra, J. Astrophys. J. 237 (1980) 655.
Observational uncertainties (inclination, luminosity correction for
internal extinction) and possible systematic effects (differences
between morphological types)
[Roberts, M.S. Astron. J. 83 (1978) 1026]
leave some calibration problems. The slope of the relations lies between -6.25
[Tully, R.B., & Fisher, J.R. Astron. Astrophys. 54 (1977) 661]
and -10.0.
- Aaronson, M., Huchra, J., & Mould, J. Astrophys. J. 229 (1979) 1.
- Aaronson, M., Mould, J., & Huchra, J. Astrophys. J. 237 (1980) 655.
A similar correlation (with absolute magnitudes corrected for total
internal absorption) was published by Sandage and Tammann
[Sandage, A., & Tammann, G.A. Astrophys. J. 210 (1976) 7, (Fig. 1)].
The so-called Tully-Fisher-relation is an empirical
dependence between the luminosity and the dynamical mass (i.e. the
maximum rotational velocity) of galaxies. The observed magnitude has
to be corrected for extinction in our galaxy (depending on galactic
latitude to the first order) and for intrinsic absorption within the
observed galaxy (depending on the inclination and the morphological
type of the galaxy). The indices 0 and i indicate that these
corrections have been applied. The correlation between corrected
absolute magnitude M0,iB,T and the
corrected full line width of the integrated neutral hydrogen profile
dv0,i - the Tully-Fisher relation:
M0,iB,T
 log d v0,i ,
has been used as a tool for determining extragalactic distances
- Bottinelli, L., Fouque, P., Gouguenheim, L., Teerikorpi, P., &
Paturel, G., Astron. Astrophys. 181 (1987) 1.
- Tacconi, L.J., & Young, J.S., Astrophys. J. 322 (1987) 681.
- Kraan-Korteweg, R.C., Cameron, L.M., & Tammann, G.A., Astrophys. J.
331 (1988) 620.
- Baan, W.A., Haschick, A.D., & Henkel, C., Astrophys. J. 346 (1989) 680.
- Mould, J., Han, M., & Bothun, G., Astrophys. J. 347 (1989) 112.
- Biviano, A., Giuricin, G., Mardirossian, F., & Mezzetti, M.,
Astrophys. J. Suppl. 74 (1990) 325.
- Fouque, P., Bottinelli, L., Durand, N., Gouguenheim, L., & Paturel,
G., Astron. Astrophys. Suppl. 86 (1990) 473.
- Fouque, P., Bottinelli, L., Gouguenheim, L., & Paturel, G.,
Astrophys. J. 349 (1990) 1.
- Freedman, W.L., Astrophys. J. 355 (1990) 35.
- Puche, D., Carignan, C., & Bosma, A., Astron. J. 100 (1990) 1468.
- Teerikorpi, P., Astron. Astrophys. 234 (1990) 1.
- Fabian, A.C., Nulsen, P.E.J., & Canizares, C.R., Astron. Astrophys. Rev. 2
(1991) 191.
- Fukugita, M., Okamura, S., Tarusawa, K., & Rood, H.J., Astrophys.
J. 376 (1991) 8.
- Haynes, M.P., & Giovanelli, R., Astrophys. J. Suppl. 77 (1991) 331.
- Karachentsev, I.D., Astron. Letters 17 (1991) 176.
- Persic, M., & Salucci, P., Mon. Not. R. Astron. Soc. 248 (1991) 325.
- Peletier, R.F., & Willner, S.P., Astrophys. J. 382 (1991) 382.
- Baan, W.A., Rhoads, J., & Haschick, A.D., Astrophys. J. 401 (1992) 508.
- Bicknell, G.V., Astrophys. J. 399 (1992) 1.
- Teerikorpi, P., Bottinelli, L., Gouguenheim, L., & Paturel, G.,
Astron. Astrophys. 260 (1992) 17.
- Fukugita, M., Okamura, S., & Yasuda, N., Astrophys. J. 412 (1993) L13.
- Guhathakurta, P., Bernstein, G., Raychaudhury, S., Haynes, M.P.,
Giovanelli, R. Herter, I., & Vogt, N., Pub. Astron. Soc. Pac. 105 (1993)
1022.
- Peletier, R.F., & Willner, S.P., Astrophys. J. 418 (1993) 626.
- Rood, H.J., & Williams, B.A., Mon. Not. R. Astron. Soc. 263 (1993) 211.
- Teerikorpi, P., Astron. Astrophys. 280 (1993) 443.
- Bernstein, G.M., Guhathakurta, P., Raychaudhury, S., Giovanelli,
R., Haynes, M.P., Heter, T., & Vogt, N.P., Astron. J. 107 (1994) 1962.
- Feast, M.W., Mon. Not. R. Astron. Soc. 266 (1994) 255.
- Federspiel, M., Sandage, A., & Tammann, G.A., Astrophys. J. 430
(1994) 29.
- Rownd, B.K., Dickey, J.M., & Helou, G., Astron. J. 108 (1994) 1638.
- Di Nella, H., Garcia, A.M., Garnier, R., & Paturel, G., Astron.
Astrophys. Suppl. 113 (1995) 151.
- Sandage, A., Tammann, G.A., & Federspiel, M., Astrophys. J. 452
(1995) 1.
- Sprayberry, D., Bernstein, G.M., Impey, C.D., & Bothun, C.D.,
Astrophys. J. 438 (1995) 72.
- van Driel, W., van den Broek, A.C., & Baan, W.A., Astrophys. J. 444
(1995) 80.
Calibration and Corrections for Malmquist Bias:
- Weinberg, D.H., Szomora, A., Guhathakurta, P., & van Gorkom, J.H.,
Astrophys. J. 372 (1991) L13.
- Taylor, C., Brinks, E., & Skillman, E.D., Astron. J. 105 (1993) 128.
- Pantoja, C.A., Giovannardi, C., Altschuler, D.R., & Giovanelli, R.,
Astron. J. 108 (1994) 921.
and Galaxy Shape:
- Freedman, W.L., Astrophys. J. 355 (1990) 35.
- Fasano, G., & Bettoni, D., Astron. J. 107 (1994) 1649.
- Sandage, A., Tammann, G.A., & Federspiel, M., Astrophys. J. 452
(1995) 1.
Using CO Linewidths:
- Dickey, J.M., & Kazes, I., Astrophys. J. 393 (1992) 530.
- Sofue, Y., Pub. Astron. Soc. Japan. 44 (1992) 231.
- Schoniger, F., & Sofue, Y., Astro. Astrophys. 283 (1994) 21.
for Dwarf Galaxies:
[Pantoja, C.A., Giovannardi, C., Altschuler, D.R., & Giovanelli, R.,
Astron. J. 108 (1994) 921].
The lower absorption in the IR reduces the scatter of the (blue) TF relation:
- Fouque, P., Bottinelli, L., Durand, N., Gouguenheim, L., & Paturel,
G., Astron. Astrophys. Suppl. 86 (1990) 473.
- Peletier, R.F., & Willner, S.P., Astrophys. J. 382 (1991) 382.
- Garcia, A.M., Bottinelli, L., Garnier, R., Gouguenheim, L., &
Paturel, G., Astron. Astrophys. Suppl. 97 (1993) 801.
- Peletier, R.F., & Willner, S.P., Astrophys. J. 418 (1993) 626.
- Bernstein, G.M., Guhathakurta, P., Raychaudhury, S., Giovanelli,
R., Haynes, M.P., Heter, T., & Vogt, N.P., Astron. J. 107 (1994) 1962.
- Schulman, E., Bregman, J.N., & Roberts, M.S., Astrophys. J. 423
(1994) 180.
The most optimistic estimate for the accuracy of distances derived from
the IR TF relation is 5%
[Baas, F., Israel, F.P., & Koorneef, J., Astron. Astrophys. 284
(1994) 403].
for the calibrator galaxies.
|
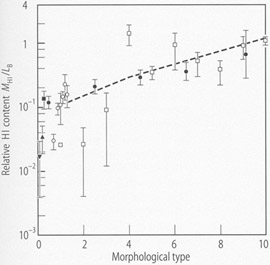
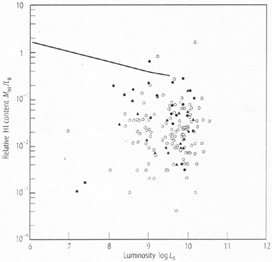
Figure 1. The relative neutral hydrogen content
as a function of morphological type. The distance-independent quantity
MHI/LB is often used as the
relative HI content to be compared with other global galaxian
parameters. Here we compare the dependence of
MHI/LB with morphological type for
two galaxy samples. The averages per morphological type are given for
the:
1) sample of nearby galaxies (v0
 500 km s-1), data from
[Huchtmeier, W.K., & Richter, O.-G., Astron. Astrophys. 203 (1988) 237]
are shown as open squares, 500 km s-1), data from
[Huchtmeier, W.K., & Richter, O.-G., Astron. Astrophys. 203 (1988) 237]
are shown as open squares,
2) sample of galaxies from
[Roberts, M.S., & Haynes, M.P., Annu. Rev. Astron. Astrophys. 32
(1994) 115] are given as filled circles.
3) sample of Sa galaxies
[Huchtmeier, W.K., (1995) in preparation]
from the RSA
[A revised Shapeley-Ames Catalog of Bright Galaxies (Sandage, A.R.,
Tammann, G.A.), Washington D.C., Carnegie Institution (1987)]
are shown as open circles for the morphological subtypes as defined by
Sandage
[Hogg, D.E., Roberts, M.S., & Sandage, A.R., Astron. J. 106 (1993) 907].
The general trend of MHI/LB to
increase with morphological type seems to be valid even for the Sa
subtypes. However, the MHI/LB for
the earliest subtype is very low as most Sa galaxies of this subtype
are HI-deficient objects in the Virgo cluster and in nearby
groups. The filled square represents the mean
MHI/LB value for Sa galaxies
outside the Virgo cluster, the filled upper triangle the mean for Sa
galaxies within the Virgo cluster, and the filled lower triangle the
mean for the Sa galaxies in the Coma I cloud
[Garcia-Barreto, J.A., Downes, D., & Huchtmeier, W.K., Astron.
Astrophys. 288 (1994) 705].
The broken line represents the whole data set of "normal" galaxies and
will be used in the following figures for comparison with different
galaxy samples.
|
|
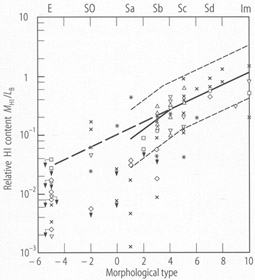
Figure 2. HI-deficiency in selected groups
of galaxies. MHI/LB versus
morphological type is given for a selected sample of seven galaxy groups
(from [Nearby Galaxies Catalog (Tully, R.B.), Cambridge, Cambridge
University Press (1988)])
[Huchtmeier, W.K., & Garcia-Barreto, J.A., (1995) unpublished data]
with early-type galaxies in their central areas.
Galaxy group, 21-1 (triangle down), 41-1 (square on top), 42-1
(triangle up), 42-13 (square), 51-4+4 (star), 52-7+7 (circle). Coma I
group (x), upper limits are indicated by arrows. The full line
represents the sample of nearby galaxies (see Fig. 1), the two broken
lines mark the 95% confidence interval. Most disk galaxies from these
selected groups fit nicely to the relation defined by the sample of
nearby galaxies. However, a small number of early-type disk galaxies
is definitely HI-deficient (up to two orders of magnitude for the Sa
galaxy NGC 4314 in the Coma I group). The HI detected elliptical
galaxies show very low values of
MHI/LB (compared to the thick
broken line, an extrapolation of the HI-rich part of the relation for
nearby galaxies).
|
|
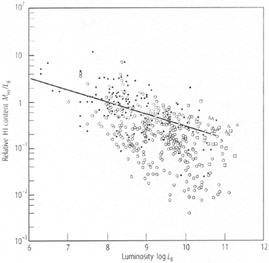
Figure 3.
HI-deficiency in the Virgo cluster. The relative HI
content MHI/LB is plotted versus
blue luminosity. The nearby galaxy sample (filled circles,
[Huchtmeier, W.K., & Richter, O.-G., Astron. Astrophys. 203 (1988) 237])
is fitted by the full line. Virgo galaxies (open circles,
[Huchtmeier, W.K., & Richter, O.G., Astron. Astrophys. 210 (1989) 1])
partly fall in the range of the diagram occupied
by the nearby galaxy sample. A considerable number of Virgo galaxies has
MHI/LB values much lower than
expected for their luminosity. This is the
manifestation of the HI deficiency observed in several clusters and in a
few nearby groups (see Fig. 2). Other manifestations of the HI
deficiency are found in plots of MHI/LB
against a number of different
global parameters like morphological type, total mass, linear extent.
Open squares indicate bright galaxies from the Hydra cluster
[Huchtmeier, W.K., in [The Evolution of Galaxies and their
Environment. Proceedings of the Third Teton Summer School of
Astrophysics (D. Hollenbach, H.A. Thronson, & J.M. Shull, eds.),
Washington, NASA Conference Publication 3190 (1993) p. 207].
|
|
Figure 4.
The relative HI-content of elliptical galaxies.
MHI/LB versus LB
is given for two complete samples of elliptical galaxies
[Huchtmeier, W.K., Sage, L.J., & Henkel, C., Astron. Astrophys. 300
(1995) 675] :
a) elliptical galaxies from the RSA
[A Revised Shapeley-Ames Catalog of Bright Galaxies (Sandage, A.R, &
Tammann, G.A.), Washington D.C., Carnegie Institution (1987)],
filled triangles,
b) elliptical galaxies with IRAS 100 µm fluxes
 0.5 Jy
[Knapp, G.R., Guhathakurta, P., Kim, D.-W., & Jura, M., Astrophys.
J. Suppl. 70 (1989) 329], filled circles. 0.5 Jy
[Knapp, G.R., Guhathakurta, P., Kim, D.-W., & Jura, M., Astrophys.
J. Suppl. 70 (1989) 329], filled circles.
Upper limits for both samples are given by open circles. The full line
represents the nearby galaxy sample
[Huchtmeier, W.K., & Richter, O.-G., Astron. Astrophys. 203 (1988) 237],
see Fig. 3. The great number of upper limits is
partially due to lack of sensitivity. In
general elliptical galaxies are poor in HI, low upper limits and detection are
as low as three orders of magnitude below the expected values (full
line) for disk galaxies. However, a few elliptical galaxies have
MHI/LB
values as high as spiral galaxies. These objects are in some way
peculiar and tend to have blue colors (indicated by greater filled
circles).
|
|
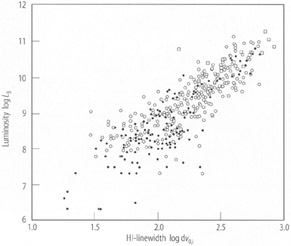
Figure 5.
The "blue" Tully-Fisher relation - logarithm of the corrected
total blue absolute magnitude M0,iB,T versus
logarithm of the corrected
HI-linewidth dv0,i - for the sample of nearby
galaxies (filled circles
[Huchtmeier, W.K., & Richter, O.-G., Astron. Astrophys. 203 (1988) 237]),
the Virgo cluster sample (open circles
[Huchtmeier, W.K., & Richter, O.G., Astron. Astrophys. 210 (1989) 1]),
and the Hydra cluster (open squares). Dwarf galaxies show a greater
scatter due to uncertainties of their inclination values. Cluster
galaxies show a higher scatter due to the greater observational errors
(greater distances).
|
Observations of HI in Cluster Galaxies:
HI in the Virgo cluster:
- Hoffman, G.L., Helou, G., Salpeter, E.E., & Sandage, A.R., Astrophys.
J. 289 (1985) L15.
- Huchtmeier, W.K., & Richter, O.-G., Astron. Astrophys. Suppl. 64
(1986) 111.
- Hoffman, G.L., Helou, G., Salpeter, E.E., Glossun, J., & Sandage,
A.R., Astrophys. J. Suppl. 63 (1987) 247.
- Skillman, E.D., Bothun, G.D., Murray, M.A., & Warmels, R.H.,
Astron. Astrophys. 185 (1987) 61.
- Guhathakurta, P., van Gorkom, J.H., & Kotany, C., Astron. J. 96
(1988) 851.
- Phillips, S., Astron. Astrophys. 194 (1988) 77.
- van Driel, W., Rots, A.H., & van Woerden, H., Astron. Astrophys.
204 (1988) 39.
- Warmels, R.H., Astron. Astrophys. Suppl. 72 (1988) 19.
- Warmels, R.H., Astron. Astrophys. Suppl. 72 (1988) 57.
- Warmels, R.H., Astron. Astrophys. Suppl. 72 (1988) 427.
- Warmels, R.H., Astron. Astrophys. Suppl. 73 (1988) 453.
- Hoffman, G.L., Helou, G., Salpeter, E.E., & Lewis, B.M., Astrophys.
J. 339 (1989) 812.
- Hoffman, G.L., Williams, B.M., Lewis, B.M., Helou, G., & Salpeter,
E.E., Astrophys. J. Suppl. 69 (1989) 65.
- Hoffman, G.L., Williams, H.L., Salpeter, E.E., Sandage, A.R.,
& Binggeli, B., Astrophys. L. Suppl. 71 (1989) 701.
- Huchtmeier, W.K., & Richter, O.G., Astron. Astrophys. 210 (1989) 1.
- Cayatte, V., van Gorkom, J.H., Balkowski, C., & Kotanyi C., Astron.
J. 100 (1990) 604.
- Schneider, S.E., Thuan, T.X., Magri, C., & Wadiak, J.E., Astrophys.
J. Suppl. 72 (1990) 245.
- Cayatte, V., Kotany, C., Balkowski, C., & van Gorkom, J.H., Astron.
J. 107 (1994) 1003.
- Boselli, A., Astron. Astrophys. 292 (1994) 1.
HI in the Hydra-Centaurus cluster:
- Richter, O.-G., & Huchtmeier, W.K., Astron. Astrophys. Suppl. 68
(1987) 427.
- Aaronson, M., Bothun, G.D., Cornell, M.E., Dawe, J.A., Dickens,
J.R., Hall, P.J., Sheng, H.M., Huchra, J.P., Lucey, J.R., Mould, J.R.,
Murray, J.D., Schommer, R.A., & Wright, A.., Astrophys. J. 338 (1989) 654.
- McMahon, P.M., Richter, O.-G., van Gorkum, J.H., & Ferguson, H.C.,
Astron. J. 103 (1992) 399.
HI in the Coma cluster:
- Gavazzi, G., Astrophys. J. 320 (1987) 96.
- Gavazzi, G., Astrophys. J. 346 (1989) 59.
- Casoli, F., Boisse, P., Combes, F., & Dupraz, C., Astron.
Astrophys. 249 (1991) 359.
- Dickey, J.M., & Gavazzi, G., Astrophys. J. 373 (1991) 347.
HI in the Perseus-Pisces cluster:
- Focardi, P., Marano, B., & Vettolani, G., Astron. Astrophys. 136
(1984) 178.
- Hauschildt, M., Astron. Astrophys. 184 (1987) 43.
- Chamaraux, P., Cayatte, V., Balkowski, C., & Fontanelli, P.,
Astron. Astrophys. 229 (1990) 340.
- Giovanelli, R., & Haynes, M.P., Astron. J. 97 (1989) 633.
- Chamaraux, P., Cayatte, V., Balkowski, C., & Fontanelli, P.,
Astron. Astrophys. 229 (1990) 340.
- Seeberger, R., Huchtmeier, W.K., & Weinberger, R., Astron.
Astrophys. 286 286 (1994) 17.
HI in the Hercules cluster:
- Freudling, W., Haynes, M.P., & Giovanelli, R., Publ. Astron. Soc.
Pacific 190 (1988) 1220.
- Freudling, W., Haynes, M.P., & Giovanelli, R., Astron. J. 96 (1988) 1791.
- Freudling, W., Astron. Astrophys. Suppl. 112 (1995) 429.
HI in the Fornax cluster:
- D'Onofrio, M., Zaggia, S.A., Longo, G., Caou, N., & Capaccioli, M.,
Astron. Astrophys. 296 (1995) 319.
- Horellou, C., Casoli, F., Dupras, C., Astron. Astrophys. 303
(1995) 361.
HI in Galaxy Clusters:
- Magri, C., Haynes, M.P., Forman, W., Jones, C., & Giovanelli, R.,
Astrophys. J. 333 (1988) 136.
- Haynes, M.P., & Giovanelli, R., Astrophys. J. Suppl. 77 (1991) 331.
- Hoffman, G.L., & Williams, H.L., Astron. J. 101 (1991) 325.
- Richter, O.-G., & Huchtmeier, W.K., Astron. Astrophys. Suppl. 87
(1991) 425.
- Williams, B.A., McMahon, P.M., & van Gorkom, J.H., Astron. J. 101
(1991) 1957.
- Scodeggio, M., Boselli, A., Gavazzi, G., Trinchieri, G., & Carilli,
B., Astron. Astrophys. Suppl. 94 (1992) 299.
- Hogg, D.E., Roberts, M.S., & Sandage, A.R., Astron. J. 106 (1993) 907.
- Scodeggio, M., & Gavazzi, G., Astrophys. J. 409 (1993) 110.
- Vallee, J.P., Astrophys. Space Sci. 206 (1993) 275.
- Dwarakanath, K.S., van Gorkom, J.H., & Owen, F.N., Astrophys. J.
432 (1994) 469.
- O'Dea, C.P., Baum, S.A., & Gallimore, J.E., Astrophys. J. 436 (1994) 669.
- Giovanelli, R., Scodeggio, M., Solanes, J.M., Haynes, M.P., Arce,
H., & Skai, S., Astron. J. 109 (1995) 1451.
- Mould, J., Martin, S., Bothun, G., Huchra, J., & Schommer, B.,
Astrophys. J. Suppl. 96 (1995) 1.
HI in Cooling Flows:
- McNamara, B.B., Bregman, J.N., & O'Connell, R.W., Astrophys. J. 360
(1990) 20.
- Dwarakanath, K.S., van Gorkom, J.H., & Owen, F.N., Astrophys. J.
432 (1994) 469.
HI-Absorption in Galaxies:
- Brown, R.L., Broderick, J.J., Johnston, K.J., Benson, J.M.,
Mitchell, K.J., & Waltmman, M.B., Astrophys. J. 329 (1988) 138.
- Dickey, J.M., & Brinks, E., Mon. Not. R. Astron. Soc. 233 (1988) 781.
- Krishan, V., Mon. Not. R. Astron. Soc. 231 (1988) 353.
- van Gorkom, J.H., Knapp, G.R., Ekers, R.D., Ekers, D.D., & Laing,
R.A., Astron. J. 97 (1989) 708.
- Baan, W.A., Rhoads, J., & Haschick, A.D., Astrophys. J. 401 (1992) 508.
- Carilli, C.L., Perlman, E.S., & Stocke, J.T., Astrophys. J. 400
(1992) 13.
- Dickey, J.M., Brinks, E., & Puche, D., Astrophys. J. 385 (1992) 501.
- Dickey, J.M., & Brinks, E., Astrophys. J. 405 (1993) 153.
- Schneider, S.E., & Corbelli, E., Astrophys. J. 414 (1993) 500.
- Gallimore, J.F., Baum, S.A., O'Dea, C.P., Brinks, E., & Pedlar, A.,
Astrophys. J. 422 (1994) 13.
- O'Dea, C.P., Baum, S.A., & Gallimore, J.E., Astrophys. J. 436 (1994) 669.
- Schiminovich, D., van Gorkom, J.H., van der Hulst, J.M., & Kasow,
S., Astrophys. J. 423 (1994) L101.
- Taramopoulos, A., Briggs, F.H., & Turnshek, D.A., Astron. J. 107
(1994) 193.
- Conway, J.E., & Blanco, P.R., Astrophys. J. 449 (1995) 131.
- Dwarakanath, K.S., Owen, F.N., & van Gorkom, J.H., Astrophys. J.
442 (1995) L1.
- Taylor, C.L., Brinks, E., Grushuis, R.M., & Skillman, E.D.,
Astrophys. J. Suppl. 99 (1995) 427.
HI in Radio Galaxies:
- van Gorkom, J.H., Knapp, G.R., Ekers, R.D., Ekers, D.D., & Laing,
R.A., Astron. J. 97 (1989) 708.
- England, M.N., & Gottesman, S.T., Astron. J. 100 (1990) 96.
- Jaffe, W., Astron. Astrophys. 240 (1990) 254.
- Mirabel, I.F., Astrophys. J. 352 (1990) L3.
- van Gorkom, J.H., van der Hulst, J.M., Haschick, A.D., & Tubbs,
A.D., Astron. J. 99 (1990) 1781.
- Ikeuchi, S., Astron. Space Res. 11 (1991) 245.
- Carilli, C.L., & van Gorkom, J.H., Astrophys. J., 399 (1992) 372.
- Wieringa, M.H., de Bruyn, A.G., & Katgert, P., Astron. Astrophys.
256 (1992) 331.
- Schneider, S.E., & Corbelli, E., Astrophys. J. 414 (1993) 500.
- Dwarakanath, K.S., Owen, F.N., & van Gorkom, J.H., Astrophys. J.
442 (1995) L1.
General:
- Broeils, A.H., Astron. Astrophys. 256 (1992) 19.
- Elmegreen, B.G., Astrophys. J. 411 (1993) 170.
- Maia, M.A.G., Da Costa, L.N., Giovanelli, R., & Haynes, M.P.,
Astron. J. 105 (1993) 2107.
- Rao, S., & Briggs, F., Astrophys. J. 419 (1993) 515.
- Vallee, J.P., Astrophys. Space Sci. 206 (1993) 275.
- Golla, G., & Hummel, E., Astron. Astrophys. 284 (1994) 777.
- Taramopoulos, A., Briggs, F.H., & Turnshek, D.A., Astron. J. 107
(1994) 193.
- Braun, R., Astron. Astrophys. Suppl. 114 (1995) 409.
- Corbelli, E., & Salpeter, E.E., Astrophys. J. 450 (1995) 32.
- Helfer, T.I., & Blitz, L., Astrophys. J. 450 (1995) 90.
- Sofue, Y., Honma, M., & Arimoto, N., Astron. Astrophys. 296 (1995)
33.
Main |
Introduction |
Basic Data |
Galaxies
| Cosmology
| Particle Physics
Spectroscopy |
Glossary and Lexicon of Term |
Tabular Information
Graphical Relations |
Annual Review Articles |
Astrostatistics
CUP Monographs |
Author Index |
New Additions |
Catalogs
Table of Contents |
Text
Search |
Web Links


 V vs.
absolute magnitude for spiral galaxies
[Tully, R.B., & Fisher, J.R. Astron. Astrophys. 54 (1977) 661].
V vs.
absolute magnitude for spiral galaxies
[Tully, R.B., & Fisher, J.R. Astron. Astrophys. 54 (1977) 661].


