
| © CAMBRIDGE UNIVERSITY PRESS 1999
| |


How is the mass distributed in the universe? Does it follow, on the average, the light distribution? To address this important question, peculiar motions on large scales are studied in order to directly trace the mass distribution. It is believed that the peculiar motions (motions relative to a pure Hubble expansion) are caused by the growth of cosmic structures due to gravity. A comparison of the mass-density distribution, as reconstructed from peculiar velocity data, with the light distribution (i.e., galaxies) provides information on how well the mass traces light (see chapter by Dekel, 1994). The basic underlying relation between peculiar velocity and density is given by
| (58) |
where
 m
m
 (
(
 /
)m
is the mass overdensity,
g is the
galaxy overdensity, and
b
g /
m
is the bias parameter discussed in Section 6.
A formal analysis yields a measure of the parameter
/
)m
is the mass overdensity,
g is the
galaxy overdensity, and
b
g /
m
is the bias parameter discussed in Section 6.
A formal analysis yields a measure of the parameter

 m0.6/b. Other methods that place
constraints on
include the anisotropy in the galaxy distribution in the redshift
direction due to peculiar motions (see
Strauss and Willick 1995
for a review).
m0.6/b. Other methods that place
constraints on
include the anisotropy in the galaxy distribution in the redshift
direction due to peculiar motions (see
Strauss and Willick 1995
for a review).
Measuring peculiar motions is difficult. The motions are
usually inferred with the aid of measured distances to galaxies or clusters
that are obtained using some (moderately-reliable)
distance-indicators (such as the Tully-Fisher or
Dn -  relations), and
the measured galaxy redshift. The peculiar velocity vp is
then determined from the difference between the measured redshift
velocity, cz, and
the measured Hubble velocity, vH, of the system (the
latter obtained from the distance-indicator):
vp = cz - vH.
relations), and
the measured galaxy redshift. The peculiar velocity vp is
then determined from the difference between the measured redshift
velocity, cz, and
the measured Hubble velocity, vH, of the system (the
latter obtained from the distance-indicator):
vp = cz - vH.
A summary of all measurements of
made so far is
presented in
Strauss and Willick
(1995).
The dispersion in the current measurements of
is very
large; the various determinations range from
~ 0.4 to ~
1, implying, for b
 1,
m ~ 0.2
to ~ 1. No strong conclusion can therefore be reached at present
regarding the values of
or
m. The
larger and more accurate
surveys currently underway, including high precision velocity
measurements, will likely lead to the determination of
and possibly
its decomposition into
m and
b (e.g.,
Cole et al. 1994).
1,
m ~ 0.2
to ~ 1. No strong conclusion can therefore be reached at present
regarding the values of
or
m. The
larger and more accurate
surveys currently underway, including high precision velocity
measurements, will likely lead to the determination of
and possibly
its decomposition into
m and
b (e.g.,
Cole et al. 1994).
Clusters of galaxies can also serve as
efficient tracers of the large-scale peculiar velocity field in the
universe
(Bahcall, Gramann and Cen
1994).
Measurements of cluster peculiar velocities are
likely to be more accurate than measurements of individual
galaxies, since cluster distances can be determined by averaging
a large number of cluster members as well as by using different
distance indicators. Using large-scale cosmological simulations,
Bahcall et al. (1994)
find that clusters
move reasonably fast in all the cosmological models studied, tracing
well the
underlying matter velocity field on large scales. The clusters exhibit a
Maxwellian distribution of
peculiar velocities as expected from Gaussian initial density
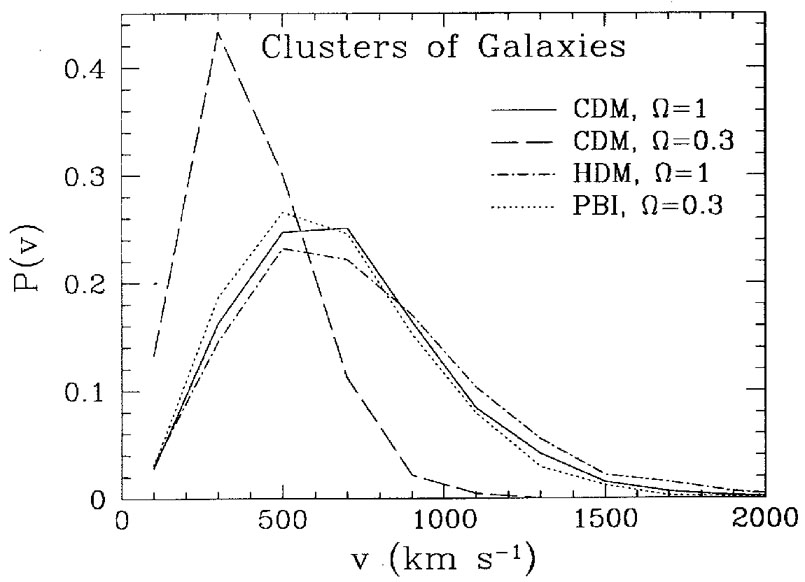
fluctuations. The model cluster 3-D velocity distribution,
presented in Figure 10, typically peaks
at v ~ 600 km s-1 and extends to high
cluster velocities of ~ 2000 km s-1. The
low-density CDM model exhibits lower velocities
(Fig. 10). Approximately 10% of all
model rich clusters (1% for low-density CDM) move with v
 103
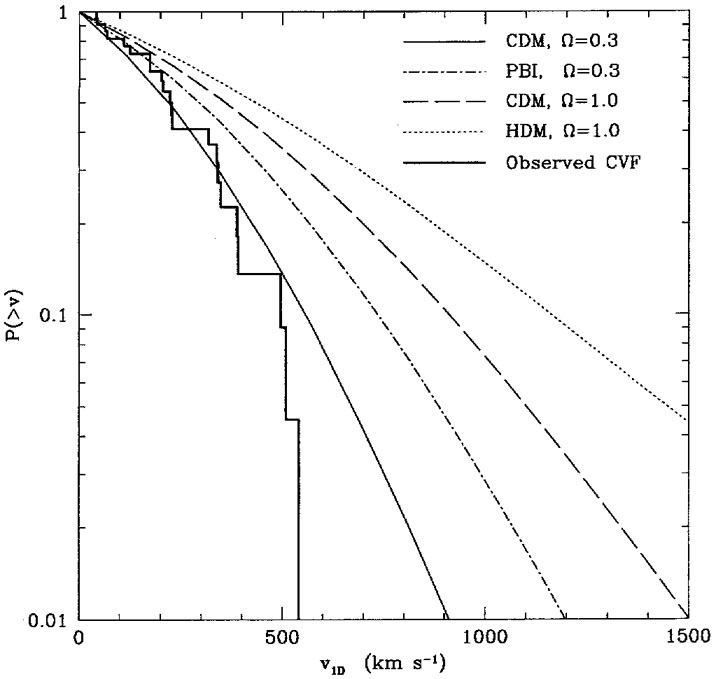
km s-1. A comparison of model
expectation with recent, well calibrated cluster velocity data
(Giovanelli et al. 1996)
is presented in Figure 11
(Bahcall and Oh 1996).
The comparison between models and observations suggests that the
cluster velocity data is consistent with a low-density CDM model, and
is inconsistent with a standard
m = 1 CDM
model, since no high velocity clusters are observed.
103
km s-1. A comparison of model
expectation with recent, well calibrated cluster velocity data
(Giovanelli et al. 1996)
is presented in Figure 11
(Bahcall and Oh 1996).
The comparison between models and observations suggests that the
cluster velocity data is consistent with a low-density CDM model, and
is inconsistent with a standard
m = 1 CDM
model, since no high velocity clusters are observed.
|
Figure 10. Differential three-dimensional peculiar velocity distribution of rich clusters of galaxies for four cosmological models (Bahcall, Gramann and Cen 1994). |
|
Figure 11. Observed vs. model cluster peculiar velocity functions (from Bahcall and Oh 1996). The Giovanelli and Haynes (1996) data are compared with model expectations convolved with the observational errors. Note the absence of a high velocity tail in the observed cluster velocity function. |
Cen, Bahcall and Gramann
(1994)
determined the expected velocity correlation function
of clusters in different cosmologies. They find that close cluster
pairs, with separations
r  10h-1 Mpc, exhibit strong attractive motions; the
pairwise velocities depend sensitively on the model. The mean pairwise
attractive cluster velocities on
5h-1 Mpc scale ranges from
~ 1700 km s-1 for
m = 1 CDM
to ~ 700 km s-1 for
m = 0.3
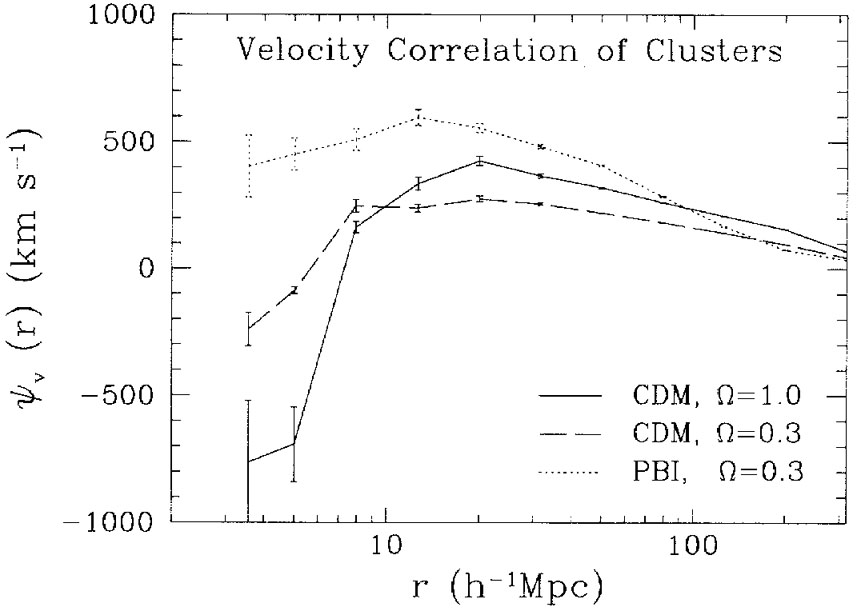
CDM. The cluster velocity correlation function,
presented in Figure 12, is negative
on small scales--indicating large attractive
velocities, and is positive on large scales, to
~ 200h-1 Mpc - indicating significant bulk motions
in the models. None of the models reproduce the very large
bulk flow of clusters on 150h-1 Mpc scale,
v 689 ± 178
km s-1, recently reported by
Lauer and Postman (1994).
The bulk flow expected on this large scale is generally
200 km
s-1 for all the models studied
(m = 1 and
m
0.3 CDM, and PBI).
10h-1 Mpc, exhibit strong attractive motions; the
pairwise velocities depend sensitively on the model. The mean pairwise
attractive cluster velocities on
5h-1 Mpc scale ranges from
~ 1700 km s-1 for
m = 1 CDM
to ~ 700 km s-1 for
m = 0.3
CDM. The cluster velocity correlation function,
presented in Figure 12, is negative
on small scales--indicating large attractive
velocities, and is positive on large scales, to
~ 200h-1 Mpc - indicating significant bulk motions
in the models. None of the models reproduce the very large
bulk flow of clusters on 150h-1 Mpc scale,
v 689 ± 178
km s-1, recently reported by
Lauer and Postman (1994).
The bulk flow expected on this large scale is generally
200 km
s-1 for all the models studied
(m = 1 and
m
0.3 CDM, and PBI).
|
Figure 12. Velocity correlation function of
rich
(R |
 1) clusters
of galaxies for three models. Error bars indicate the
1
1) clusters
of galaxies for three models. Error bars indicate the
1