
| © CAMBRIDGE UNIVERSITY PRESS 1999
| |


The correlation function of clusters of galaxies
efficiently quantifies the large-scale structure of the
universe. Clusters are correlated in space more strongly than
are individual galaxies, by
an order of magnitude, and their correlation extends to considerably larger
scales (~ 50h-1 Mpc). The cluster correlation strength
increases with richness
( luminosity or mass)
of the system from single galaxies to the richest clusters
(Bahcall and Soneira
1983;
Bahcall and West 1992).
The correlation strength also increases with
the mean spatial separation of the clusters
(Szalay and Schramm 1985;
Bahcall and Burgett 1986;
Bahcall and West 1992).
This dependence results in a "universal"
dimensionless cluster correlation function; the cluster dimensionless
correlation scale is constant for all clusters when
normalized by the mean cluster separation.
luminosity or mass)
of the system from single galaxies to the richest clusters
(Bahcall and Soneira
1983;
Bahcall and West 1992).
The correlation strength also increases with
the mean spatial separation of the clusters
(Szalay and Schramm 1985;
Bahcall and Burgett 1986;
Bahcall and West 1992).
This dependence results in a "universal"
dimensionless cluster correlation function; the cluster dimensionless
correlation scale is constant for all clusters when
normalized by the mean cluster separation.
Empirically, two general relations have been found
(Bahcall and West 1992)
for the correlation function of clusters of galaxies,
 i =
Air-1.8:
i =
Air-1.8:

| (56) |
| (57) |
where Ai is
the amplitude of the cluster correlation function,
Ni is the richness of the galaxy clusters of type i
(Section 2.2),
and di is the mean separation of the clusters. Here
di = ni-1/3, where
ni is the mean spatial
number density of clusters of richness Ni
(Section 2.3) in a volume-limited,
richness-limited complete sample. The first relation,
Eq. (56),
states that the amplitude of the cluster correlation function
increases with cluster richness, i.e., rich clusters are more strongly
correlated than poorer clusters. The second relation,
Eq. (57), states
that the amplitude of the cluster correlation function depends on the
mean separation of clusters (or, equivalently, on their number
density); the rarer, large mean separation richer clusters are more
strongly correlated than the more numerous poorer clusters.
Eqs. (56) and (57) relate to each other
through the richness function
of clusters, i.e., the number density of clusters as a function of
their richness. Equation (57)
describes a universal scale-invariant (dimensionless) correlation
function with a correlation scale
ro, i = Ai1/1.8
 0.4di
(for 30
0.4di
(for 30  di
90h-1 Mpc).
di
90h-1 Mpc).
There are some conflicting statements in the literature about the precise values of the correlation amplitude, Ai. Nearly all these contradictions are caused by not taking account of Eq. (56). When apples are compared to oranges, or the clustering of rich clusters is compared to the clustering of poorer clusters, differences are expected and observed.
Figure 6 clarifies the observational situation. The Ai(di) relation for groups and clusters of various richnesses is presented in the figure. The recent automated cluster surveys of APM (Dalton et al. 1992) and EDCC (Nichol et al. 1992) are consistent with the predictions of Eqs. (56) and (57), as is the correlation function of X-ray selected ROSAT clusters of galaxies (Romer et al. 1994). Bahcall and Cen (1994) show that a flux-limited sample of X-ray selected clusters will exhibit a correlation scale that is smaller than that of a volume-limited, richness-limited sample of comparable apparent spatial density since the flux-limited sample contains poor groups nearby and only the richest clusters farther away. Using the richness-dependent cluster correlations of Eqs. (56) and (57), Bahcall and Cen (1994) find excellent agreement with the observed flux-limited X-ray cluster correlations of Romer et al. (1994).

|
Figure 6. The universal dimensionless cluster correlations: the dependence of correlation amplitude on mean separation (Bahcall and West 1992). Data points include different samples and catalogs of clusters and groups, as well as X-ray-selected and cD clusters. Quasars and radio galaxies, as represented by their parent groups, are also included. The APM results are presented; they are consistent with the expected relation. |
The strong correlation amplitude of galaxy clusters, and the large scales to which clusters are observed to be positively correlated ( ~ 50-100h-1 Mpc), complement and quantify the superclustering of galaxy clusters discussed in Section 9. Clusters of galaxies are strongly clustered in superclusters of large scales (Section 9), consistent with the strong cluster correlations to these scales (Section 10).
This fundamental observed property of clusters of galaxies - the
cluster correlation function - can be used to place strong constraints
on cosmological models and the density parameter
 m by
comparison with model expectations.
Bahcall and Cen (1992)
contrasted
these cluster observations with standard and nonstandard CDM models
using large N-body simulations
(400h-1 box, 107.2
particles). They find that none of the standard
m = 1 CDM
models can fit consistently the strong cluster correlations. A
low-density
(m ~
0.2-0.3) CDM-type model (with or
without a cosmological constant), however, provides a good fit to the
cluster correlations (see
Figs. 7-9)
as well as to the observed cluster mass-function
(Section 7,
Fig. 5). This is the first CDM-type
model that is consistent
with the high amplitude and large extent of the correlation function
of the Abell, APM, and EDCC clusters. Such low-density models are
also consistent with other observables as discussed in this paper.
The m
constraints of these cluster results are model
dependent; a mixed hot + cold dark matter model, for example, with
m = 1, is
also consistent with these cluster data (see
Primack's chapter in this book).
m by
comparison with model expectations.
Bahcall and Cen (1992)
contrasted
these cluster observations with standard and nonstandard CDM models
using large N-body simulations
(400h-1 box, 107.2
particles). They find that none of the standard
m = 1 CDM
models can fit consistently the strong cluster correlations. A
low-density
(m ~
0.2-0.3) CDM-type model (with or
without a cosmological constant), however, provides a good fit to the
cluster correlations (see
Figs. 7-9)
as well as to the observed cluster mass-function
(Section 7,
Fig. 5). This is the first CDM-type
model that is consistent
with the high amplitude and large extent of the correlation function
of the Abell, APM, and EDCC clusters. Such low-density models are
also consistent with other observables as discussed in this paper.
The m
constraints of these cluster results are model
dependent; a mixed hot + cold dark matter model, for example, with
m = 1, is
also consistent with these cluster data (see
Primack's chapter in this book).
The CDM results for clusters corresponding to the
rich Abell clusters (richness class R
 1) with
d = 55h-1 Mpc are
presented in Figure 7 together with
the observed correlations
(Bahcall and Soneira
1983;
Peacock and West 1992).
The results indicate that the standard
m = 1 CDM
models are inconsistent with the observations; they cannot provide
either the strong amplitude or the large scales
(
1) with
d = 55h-1 Mpc are
presented in Figure 7 together with
the observed correlations
(Bahcall and Soneira
1983;
Peacock and West 1992).
The results indicate that the standard
m = 1 CDM
models are inconsistent with the observations; they cannot provide
either the strong amplitude or the large scales
( 50h-1 Mpc) to
which the cluster correlations are observed. Similar results are
found for the APM and EDCC clusters.
50h-1 Mpc) to
which the cluster correlations are observed. Similar results are
found for the APM and EDCC clusters.

|
Figure 7. Two-point correlation function of
Abell R
|
The low-density, low-bias model is consistent with the data; it reproduces both the strong amplitude and the large scale to which the cluster correlations are detected.
|
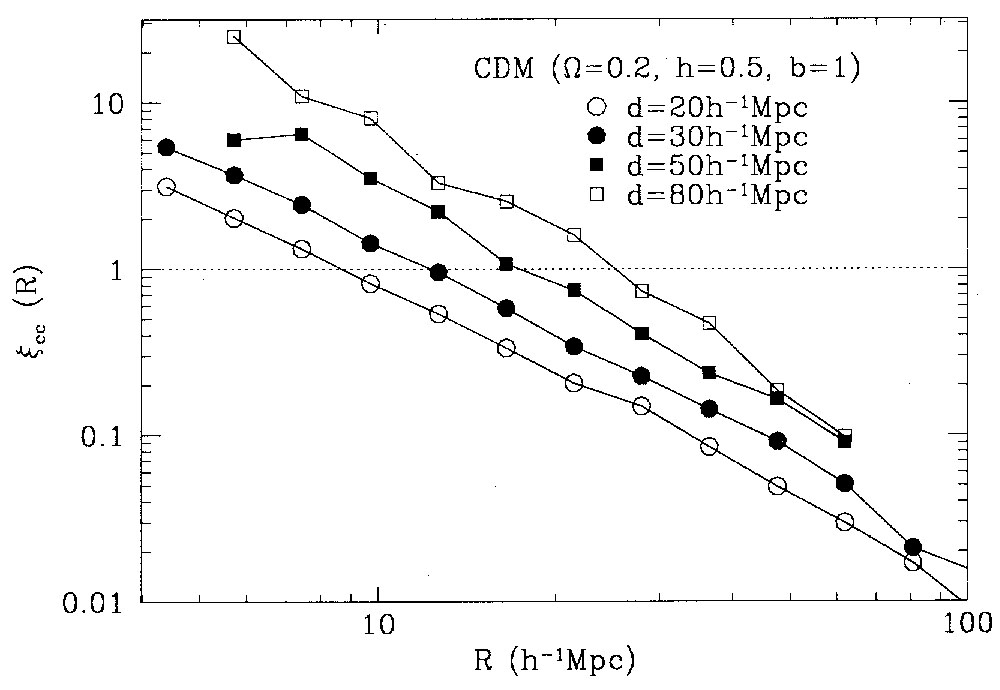
Figure 8. Model dependence of the cluster
correlation function on mean separation d (CDM simulation:
|
|
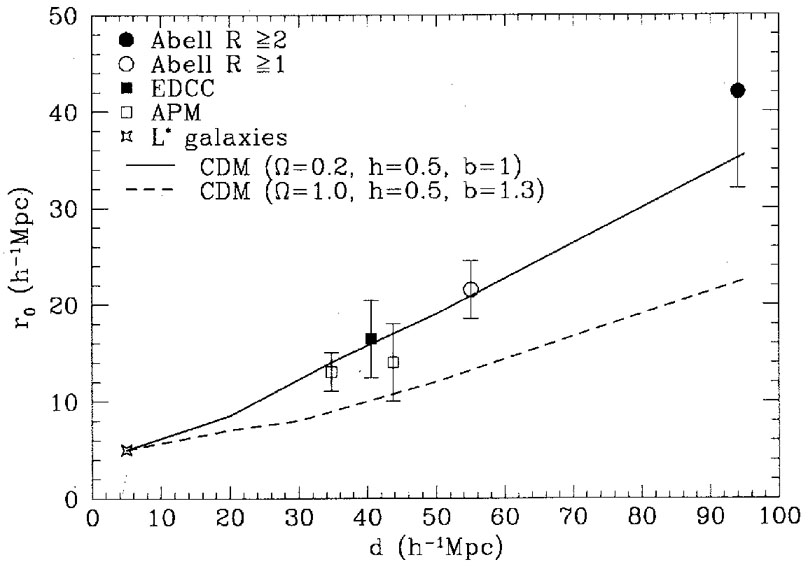
Figure 9. Correlation length as a function of cluster separation, from both observations and simulations (Bahcall and Cen 1992). |
The dependence of the observed cluster correlation on d was also
tested in the simulations.
The results are shown in Figure 8 for the
low-density model. The dependence of correlation amplitude on mean
separation is
clearly seen in the simulations. To compare this result directly
with observations, I plot in Figure 9
the dependence of the
correlation scale, ro, on d for both the
simulations and the observations. The low-density
model agrees well with the observations, yielding
r0  0.4d, as observed. The
m = 1
model, while also showing an increase of ro with
d, yields considerably smaller correlation scales and a much slower
increase of r0(d ).
0.4d, as observed. The
m = 1
model, while also showing an increase of ro with
d, yields considerably smaller correlation scales and a much slower
increase of r0(d ).
What causes the observed dependence on cluster richness [Eqs. (56-57]? The dependence, seen both in the observations and in the simulations, is most likely caused by the statistics of rare peak events, which Kaiser (1984) suggested as an explanation of the observed strong increase of correlation amplitude from galaxies to rich clusters. The correlation function of rare peaks in a Gaussian field increases with their selection threshold. Since more massive clusters correspond to a higher threshold, implying rarer events and thus larger mean separation, Eq. (57) results. A fractal distribution of galaxies and clusters would also produce Eq. (57) (e.g., Szalay and Schramm 1985).