


For the determination of H0, a given method for measuring
distances should satisfy several basic criteria (e.g.,
Freedman 1997):
(a) It should exhibit high internal precision; (b) have a solid empirical
calibration; (c) ideally it should be applicable to large distances
(and therefore not subject to significant systematics due to
large-scale flows); and also (d) ideally it should be based on
straightforward physics. As discussed further below, based on these
criteria, each of the relative distance indicators has its own merits
and drawbacks. For example, Type Ia supernovae (SNIa) have a number
of advantages relative to other methods: currently they can be applied
at the greatest distances (~ 400 Mpc) and the internal precision
of this method is very high. But finding them is difficult:
supernovae are rare objects, and separating the supernova from the
background light of the galaxy is challenging in the inner regions of
galaxies. Moreover, for nearby galaxies, surveying for supernovae is a
time-consuming process that must be done on a galaxy-by-galaxy
basis. The internal precision of the surface-brightness-fluctuation
(SBF) method is also very high, but this method currently has the most
limited distance range, of only ~ 70 Mpc. Of somewhat lower
internal precision is the Tully-Fisher (TF) relation, but it can be
applied out to intermediate distances (~ 150 Mpc). The
fundamental plane (FP) for elliptical galaxies can be applied, in
principle, out to to z ~ 1, but in practice, stellar evolution
effects limit this method to z
 0.1 (~ 400
Mpc). Moreover,
since elliptical galaxies do not contain Cepheids, the FP calibration
currently relies on less direct group/cluster distances. Each of
these distance indicators is now discussed briefly. The results from
these methods are then combined in Section 7.
0.1 (~ 400
Mpc). Moreover,
since elliptical galaxies do not contain Cepheids, the FP calibration
currently relies on less direct group/cluster distances. Each of
these distance indicators is now discussed briefly. The results from
these methods are then combined in Section 7.
One of the most promising cosmological distance indicators is the peak brightness of Type Ia supernovae. Of longstanding interest (e.g., Kowal 1968; Sandage & Tammann 1982), this secondary indicator currently probes further into the unperturbed Hubble flow, and possesses the smallest intrinsic scatter of any of the indicators discussed thus far. A simple lack of Cepheid calibrators prevented the accurate calibration of type Ia supernovae prior to HST. Substantial improvements to the supernova distance scale have resulted both from recent dedicated, ground-based supernova search and followup programs yielding CCD light curves (e.g., Hamuy et al. 1995, 1996; Riess et al. 1998, 1999), as well as a campaign to find Cepheids in nearby galaxies which have been host to Type Ia supernovae (Sandage et al. 1996; Saha et al. 1999).
An ALLFRAME analysis of the Cepheid distances to Type Ia supernova
hosts, and a comparison with the published DoPHOT results was
undertaken by
Gibson et
al. (2000)
as part of the Key Project. Using
the same pipeline reduction methods that we applied to all of the Key
Project galaxies, we independently derived Cepheid distances to seven
galaxies that were hosts to Type Ia supernovae. We found that on
average, our new distance moduli were 0.12 ± 0.07mag (6% in
distance) smaller than those previously published (see Gibson et al.
Table 4). Adopting the recalibrated distances, and applying these to
the reddening-corrected Hubble relations of
Suntzeff et
al. (1999),
Gibson et al. determined a value of H0 = 68 ± 2r
±5skms-1Mpc-1. In general, the
published
DoPHOT Cepheid photometry and our ALLFRAME analysis agrees quite well,
at or significantly better than the
1- level, with the I-band
data tending to show poorer agreement. Thus, photometric reduction is
not the major source of the difference. A variety of reasons,
detailed by Gibson et al., lead to the differences in the final
distance moduli.
level, with the I-band
data tending to show poorer agreement. Thus, photometric reduction is
not the major source of the difference. A variety of reasons,
detailed by Gibson et al., lead to the differences in the final
distance moduli.
In principle, one could average the distances determined by the two groups. However, in some cases, there are very clear-cut reasons to prefer the Gibson et al. results. For example, in the case of NGC 4536, the WFC2 chip results are discrepant (by 0.66 mag) in the Saha et al. (1996a) DoPHOT analysis, whereas the Saha et al. analysis of the other three chips agrees with our ALLFRAME analysis of all four WFPC chips. Parodi et al. (2000) have attributed this difference to uncertainties in aperture corrections, and continue to prefer to average all 4 chips together. However, given their quoted aperture correction uncertainties (0.10 to 0.15 mag), and the fact that our analysis reveals no such difference in aperture correction, this appears to be an unlikely explanation. For the case of NGC 4639, Saha et al. (1997) introduced a different weighting scheme for that galaxy only; however, in our analysis we find no significant difference in a weighted or unweighted fit. Our preferred approach is to treat the fitting of all of the galaxies and their reddening determinations in a consistent manner, rather than adopting different schemes for individual galaxies.
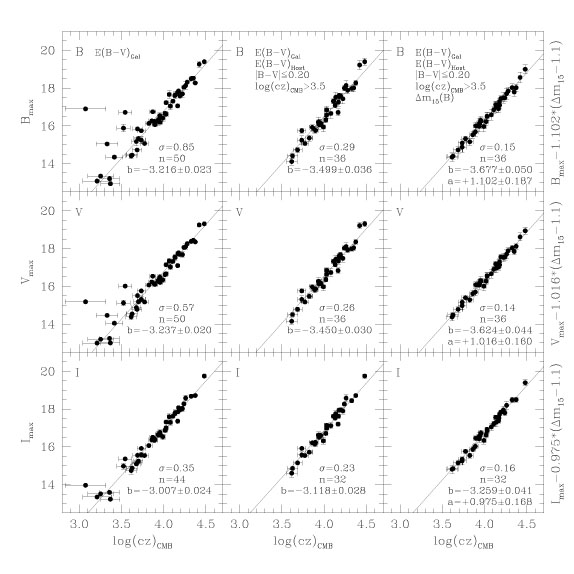
The supernova Hubble relation calibrated by Gibson et al. (2000) was that of Suntzeff et al. (1999), based upon a subsample of 35 supernovae from Hamuy et al. (1996) and Riess et al. (1998). A larger total sample of nearby supernovae is now available as a result of the ongoing search program of Riess et al. (1999). In this paper, we add 21 of these additional 22 supernovae to the original Hamuy et al. sample of 29; only SN1996ab is not considered further, as its redshift is in excess of the regime over which the Hamuy et al. (1993) k-corrections are applicable. For completeness, in the first panel of Figure 2, we show the raw, uncorrected, B, V, and I Hubble diagrams for this full set of 50 supernovae.
|
Figure 2. Three sets of Hubble relations
constructed from the Calán-Tololo
(Hamuy et
al. 1996)
and CfA-2
(Riess et
al. 1999)
Type Ia supernova samples. Left Panel : The full sample of 50
supernovae, with peak magnitudes corrected only for foreground
Galactic reddening. All tabulated heliocentric velocities have been
corrected to the cosmic microwave background reference frame using the
velocity calculator available in the
NASA
Extragalactic Database (NED).
Middle Panel : Our adopted sample of 36 supernovae,
excluding those with peak B-V colors in excess of 0.20 mag and
velocities with respect to the cosmic microwave background below 3100
kms-1. Both foreground Galactic and host galaxy reddening
corrections were applied. Right Panel : The Hubble relations
adopted for this paper. Same as for the middle panel, but now an
additional correction for the light curve shape (linear in
|
Following Jha et
al. (1999),
in the middle panel of
Figure 2, we show the B, V, and I Hubble
diagrams for the subset of 36 supernovae having 3.5 <
log(cz)CMB <4.5, and peak magnitude colors
|Bmax - Vmax|
 0.20. In
addition, a correction for the internal reddening of the host galaxy
E(B-V)Host, from
Phillips et al. (1999),
has been applied.
In the third panel of Figure 2, our adopted
subset of 36
supernovae have had their peak magnitudes corrected for their light
curve shape, via application of a simple linear fit to the relation
between decline rate
0.20. In
addition, a correction for the internal reddening of the host galaxy
E(B-V)Host, from
Phillips et al. (1999),
has been applied.
In the third panel of Figure 2, our adopted
subset of 36
supernovae have had their peak magnitudes corrected for their light
curve shape, via application of a simple linear fit to the relation
between decline rate
 m15(B) and
peak magnitude. This correction echoes that adopted in the original
Hamuy et al. (1996)
analysis, as opposed to the quadratic fits adopted by
Phillips et al. (1999)
and Gibson et
al. (2000);
however, we find no difference in the
result whether a linear or quadratic fit is adopted.
m15(B) and
peak magnitude. This correction echoes that adopted in the original
Hamuy et al. (1996)
analysis, as opposed to the quadratic fits adopted by
Phillips et al. (1999)
and Gibson et
al. (2000);
however, we find no difference in the
result whether a linear or quadratic fit is adopted.
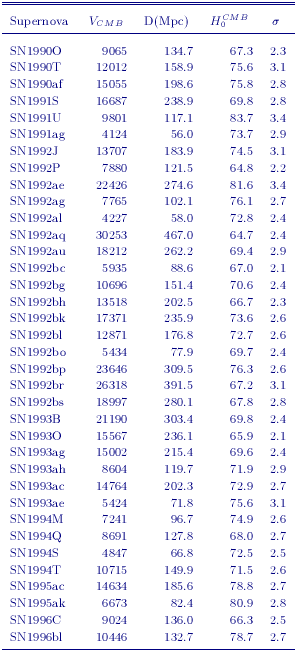
Adopting our default Hubble relations (Figure 2), coupled with the zero points provided by our revised Cepheid distances (applying a metallicity correction of -0.2 ± 0.2 mag/dex) to NGC 4639, 4536, 3627, 3368, 5253, and IC 4182 from Table 4, yields a value of H0 = 71 ± 2r ±6skms-1Mpc-1. This value can be compared to that from Gibson et al. (2000) of H0 = 68 ± 2r ±5skms-1Mpc-1. The difference in H0 compared to Gibson et al. comes from the new calibration of the PL relation, a metallicity correction, and our adoption of an expanded supernovae sample. An identical error analysis to that employed by Gibson et al. was assumed here. The velocities, distances, H0 values, and uncertainties for the 36 type Ia supernovae used in this analysis are listed in Table 6.
|
6.2. The Tully-Fisher Relation
For spiral galaxies, the total (corrected to face-on inclination) luminosity is strongly correlated with the maximum rotation velocity of the galaxy (corrected to edge-on inclination), which is useful for measuring extragalactic distances (Tully & Fisher 1977; Aaronson et al. 1986; Pierce & Tully 1988; Giovanelli et al. 1997). The Tully-Fisher relation at present is the most commonly applied distance indicator: thousands of distances are now available for galaxies both in the general field, and in groups and clusters. The scatter in this relation is approximately ±0.3 mag (Giovanelli et al. 1997; Sakai et al. 2000; Tully & Pierce 2000), or ±15% in distance for a single galaxy. In a broad sense, the Tully-Fisher relation can be understood in terms of the virial relation applied to rotationally supported disk galaxies, under the assumption of a constant mass-to-light ratio (Aaronson, Mould & Huchra 1979). However, a detailed self-consistent, physical picture that reproduces the Tully-Fisher relation (e.g., Steinmetz & Navarro 1999), and the role of dark matter in producing almost universal spiral galaxy rotation curves (Persic, Salucci, & Stel 1999; McGaugh et al. 2000) still remain a challenge.
Macri et al. (2000) obtained new BVRI photometry, and using published data, remeasured line widths for the Cepheid galaxies that are Tully-Fisher calibrators. Sakai et al. (2000) applied this calibration to a sample of 21 clusters out to 9,000 km/sec observed by Giovanelli et al. (1997), and to an H-band sample of 10 clusters from Aaronson et al. (1982, 1986). With an adopted distance to the LMC of 50 kpc, Sakai et al. determined a value of H0 = 71 ± 4r ± 7s km s-1 Mpc-1. Based on the same set of Key Project Cepheid calibrator distances, the same LMC zero point, and a compilation of BRIK data for Tully-Fisher cluster galaxies from the literature, Tully & Pierce (2000) determined a value of H0 = 77 ± 8 km s-1 Mpc-1 (at a quoted 95% confidence level). In the I-band, where there is good overlap with Tully and Pierce, Sakai et al. found H0 = 73 ± 2r ± 9s km/sec/Mpc. Based on analyses using an earlier available subset of Cepheid calibrators, Giovanelli et al. (1997) concluded that H0 = 69 ± 5 km s-1 Mpc-1, consistent with Madore et al. (1998), who obtained H0 = 72 ± 5r ± 7s km s-1 Mpc-1. However, for a consistent set of calibrators, the difference in these values probably reflects some of the systematic uncertainties inherent in implementing the Tully-Fisher technique. Tully & Pierce discuss at length possible reasons for the source of the differences amongst various published values of H0 based on the Tully-Fisher relation, but they conclude that the reason for much of this discrepancy remains unresolved.
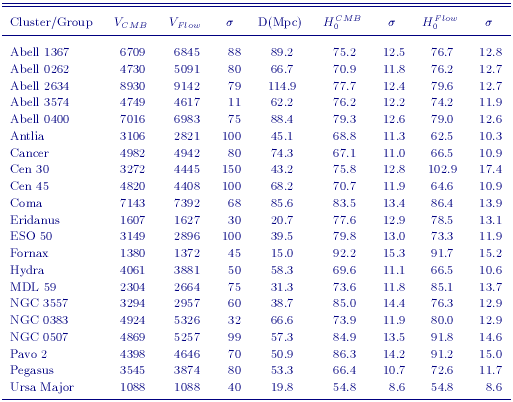
Adopting the same Tully-Fisher (BVIH) galaxy sample discussed in Sakai et al. (2000), applying the new PL calibration, and adopting the metallicity-corrected distances for the Tully-Fisher calibrators given in Table 4, results in a value of H0 = 71 ±3r ± 7s km s-1 Mpc-1, with no net change from that published by Sakai et al. The adopted distances and velocities for the Tully-Fisher clusters used in this analysis are given in Table 7. Also tabulated are the velocities in the cosmic microwave background frame, and H0 values and uncertainties.
|
6.3. Fundamental Plane for Elliptical Galaxies
For elliptical galaxies, a correlation exists between the stellar
velocity dispersion and the intrinsic luminosity
(Faber & Jackson
1976),
analogous to the relation between rotation velocity and
luminosity for spirals. Elliptical galaxies are found to occupy a
`fundamental plane' (r
e 
 < I >
< I >
 e)
wherein a defined galaxy effective radius (re)
is tightly correlated with the surface brightness (Ie) within
re, and central velocity dispersion of the galaxy
()
(Dressler et al. 1987;
Djorgovski & Davis
1987);
and ~ 1.2 and
~ -0.85
(Djorgovski & Davis
1987).
The scatter in
this relation is approximately 10-20% in distance for an individual
cluster.
e)
wherein a defined galaxy effective radius (re)
is tightly correlated with the surface brightness (Ie) within
re, and central velocity dispersion of the galaxy
()
(Dressler et al. 1987;
Djorgovski & Davis
1987);
and ~ 1.2 and
~ -0.85
(Djorgovski & Davis
1987).
The scatter in
this relation is approximately 10-20% in distance for an individual
cluster.
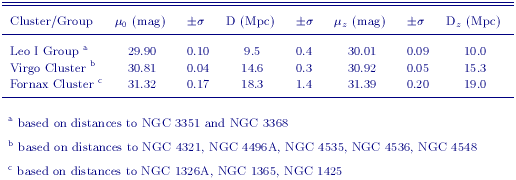
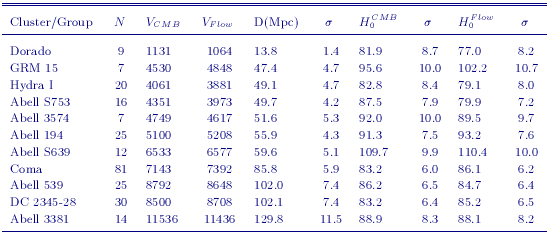
Jorgensen, Franx & Kjaergaard (1996) have measured the fundamental plane for 224 early-type galaxies in 11 clusters spanning cz ~ 1,000 to 11,000 km/sec. Kelson et al. (2000) provided a Cepheid calibration for the distant clusters based on Key Project distances to spiral galaxies in the Leo I group, and the Virgo and Fornax clusters, yielding H0 = 78 ± 5r ± 9s km s-1 Mpc-1. The revised Cepheid distances presented in this paper result in new distances to the Virgo cluster, the Fornax cluster, and the Leo I group (Table 8). The galaxies in these objects are amongst the most distant in the Key Project sample, and they also have high metallicities. Hence, the new calibration impacts the fundamental plane more than for the other secondary methods analyzed here. The new calibration yields H0 = 82 ± 6r ± 9s km s-1 Mpc-1, adopting a metallicity correction of -0.2 ± 0.2 mag/dex. The numbers of galaxies, adopted distances, velocities, H0 values and uncertainties for the clusters in this analysis are given in Table 9.
|
|
6.4. Surface Brightness Fluctuations
Another method with high internal precision, developed by
Tonry & Schneider
(1988);
Tonry et al. 1997; and
Tonry et al. (2000)
makes use
of the fact that the resolution of stars within galaxies is distance
dependent. This method is applicable to elliptical galaxies or to
spirals with prominent bulges. By normalizing to the mean total flux,
and correcting for an observed color dependence, relative distances to
galaxies can be measured. The intrinsic scatter of this method is
small: a factor of three improvement compared to the Tully-Fisher and
Dn - relations
makes the method an order of magnitude less
susceptible to Malmquist biases. Application of the method requires
careful removal of sources of noise such as bad pixels on the
detector, objects such as star clusters, dust lanes, background
galaxies, and foreground stars. With HST, this method is now being
extended to larger distances
(Lauer et al. 1998);
unfortunately,
however, only 6 galaxies beyond the Fornax cluster have published
surface-brightness fluctuation distances, with only 4 of them accurate
enough to be of interest for cosmology. Furthermore, all lie within
the very narrow range cz = 3800 to 5800 km/s, where local flow-field
contributions to the observed velocities are still non-negligible
(~15% vCMB).
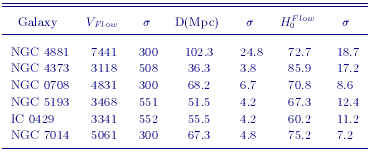
As part of the Key Project, Ferrarese et al. (2000a) applied an HST Cepheid calibration to the 4 Lauer et al. (1998) SBF galaxies, and derived H0 = 69 ± 4r ± 6s km/s/Mpc. The results are unchanged if all 6 clusters are included. The largest sources of random uncertainty are the large-scale flow corrections to the velocities, combined with the very sparse sample of available galaxies. Most of the systematic uncertainty is dominated by the uncertainty in the Cepheid calibration of the method itself (Ferrarese et al. 2000a, Tonry et al. 2000). These three factors account for the 10% difference between the SBF-based values of H0 derived by the KP and that by Tonry et al. (2000). Flow-corrected velocities, distances, and H0 values for the 6 clusters with SBF measurements are given in Table 10. Applying our new calibration, we obtain H0 = 70 ± 5r ± 6s km/s/Mpc applying a metallicity correction of -0.2 mag/dex, as described in Section 3.
|
Type II supernovae result from massive stars. They are fainter, and show a wider variation in luminosity than the type Ia supernovae. Although not "standard candles", type II supernovae can yield distances through application of the Baade-Wesselink technique to their expanding atmospheres. By following the time evolution of spectra for the expanding atmosphere (yielding the radius as a function of time and velocity), in combination with the photometric angular size (yielding the ratio of the radius to the distance of the supernova), the distance to the supernova can be obtained. Recent applications of this technique have been undertaken by Schmidt et al. (1994) and Eastman et al. (1996) using detailed model atmospheres to correct for the scattering in the atmosphere. In principle, the method can be applied independent of the local calibration of the extragalactic distance scale. The diversity of different methods is critical in constraining the overall systematic errors in the distances measured as part of the Key Project, since the underlying physics of expanding supernova atmospheres is completely independent of the Cepheid distance scale and its calibration. Based on 16 Type II supernovae, covering a range of redshifts from cz = 1100 to 14,600 km/sec, Schmidt et al. (1994) determine a value of H0 = 73 ± 6r ± 7s km s-1 Mpc-1.
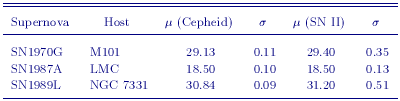
In Table 11, we list the 3 galaxies currently having both Cepheid and Type II supernovae (SNII) distances. The Type II supernovae distances are from Schmidt, Kirshner, & Eastman (1994). The distances from the two methods agree well within the quoted errors, and a weighted fit for the three calibrators yields a mean difference in the distance moduli of 0.09 ± 0.14 mag, in the sense of the Cepheids giving slightly shorter distances. A fourth galaxy, NGC 3627, also has both a Cepheid and a Type II distance, but the latter has a quoted uncertainty of ±1.00 mag. We did not include the observed SNII for M81, M100, or NGC 1559 because Schmidt, Kirshner & Eastman comment that these supernovae are peculiar SNII. There are 4 galaxies in the Schmidt et al. (1994) sample having velocities in the range ~ 2000 < vCMB < 14,000. If we apply a Cepheid calibration based on the distances to the LMC, M101, and NGC 7331 to these distant SNII, for which we adopt velocities corrected to the CMB frame, we find H0 = 72 ± 9r ± 7s km s-1 Mpc-1. This result does not change if the Cepheid distances are corrected for metallicity since two of the calibrators (the LMC and M101) are not affected by the metallicity term, and the difference in distance modulus for NGC 7331 is only 0.03 mag. Hence, the value of H0 remains unchanged after applying a metallicity correction to the Cepheid distances for SNII.
|
We note that our results agree very well with Schmidt, Eastman & Kirshner (1994), despite the 5% difference in the distances seen in Table 11. However, we have limited our H0 analysis to galaxies beyond cz = 1500 km s-1, whereas 10 of the 14 galaxies in the Schmidt et al. sample are within this limit. The nearest supernovae (where flow field effects are largest) yield a higher value of H0.