


So far we have worked only in terms of relative probabilities
and rms values to give an idea of the accuracy of the
determination
 =
*. One can also ask the
question, What is
the probability that lies
between two certain values such as
' and
"? This is called a
confidence interval,
=
*. One can also ask the
question, What is
the probability that lies
between two certain values such as
' and
"? This is called a
confidence interval,
|
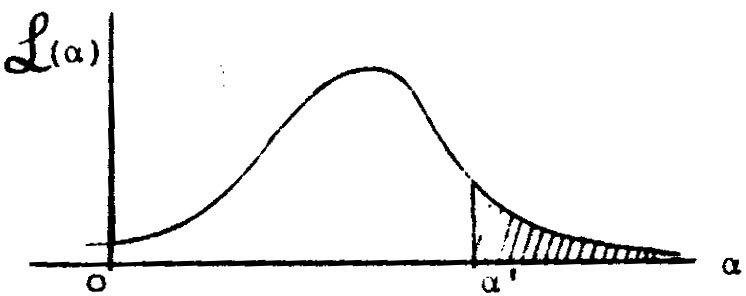
Unfortunately such a probability depends on the arbitrary choice
of what quantity is chosen for
. To show this consider the
area under the tail of
 ().
().
|
|
Figure 3. Shaded area is
P( |
If  =
() had been chosen as the physical
parameter instead, the same confidence interval is
=
() had been chosen as the physical
parameter instead, the same confidence interval is
|
Thus, in general, the numerical value of a confidence interval
depends on the choice of the physical parameter. This is also
true to some extent in evaluating
 . Only the maximum likelihood
solution and the relative probabilities are unaffected by
the choice of . For Gaussian
distributions, confidence
intervals can be evaluated by using tables of the probability integral.
Tables of cumulative binomial distributions and cumulative
Poisson distributions are also available.
Appendix V contains
a plot of the cumulative Gaussian distribution.
. Only the maximum likelihood
solution and the relative probabilities are unaffected by
the choice of . For Gaussian
distributions, confidence
intervals can be evaluated by using tables of the probability integral.
Tables of cumulative binomial distributions and cumulative
Poisson distributions are also available.
Appendix V contains
a plot of the cumulative Gaussian distribution.