


2.1. Basic Characteristics of Variability
AGNs have been found to be variable at all wavelengths at which they have been observed. The variations appear to be aperiodic and have variable amplitude. While variability in high-luminosity AGNs (quasars) was reported soon after their discovery, variability in lower-luminosity AGNs (Seyfert galaxies) was not reported 25 until 1967, and was less dramatic. The reason for this is probably quite simple: most of the quasars that were monitored are now known to be the jet-dominated sources known as "blazars". i.e., BL Lac objects and optically violent variables (OVVs). The optical identifications of quasars were based on coincidence with radio-source positions, which naturally led to biases towards radio-loud quasars, blazars in particular. Indeed, the original arguments about size and variability time scales in retrospect apply to the jets, not necessarily what we now identify as thermally emitting accretion disks. Nevertheless, the original conclusions about AGN sizes proved to be generally correct for both blazars and non-blazars.
UV/Optical Variability.
Fig. 1 shows a light curve for
a typical Seyfert 1 galaxy,
NGC 5548, which will serve as a continuing example
through
this chapter as it is one of the best-studied objects of this class.
While no periodic behavior has been identified,
there are some basic parameterizations
that allow us to characterize the variability.
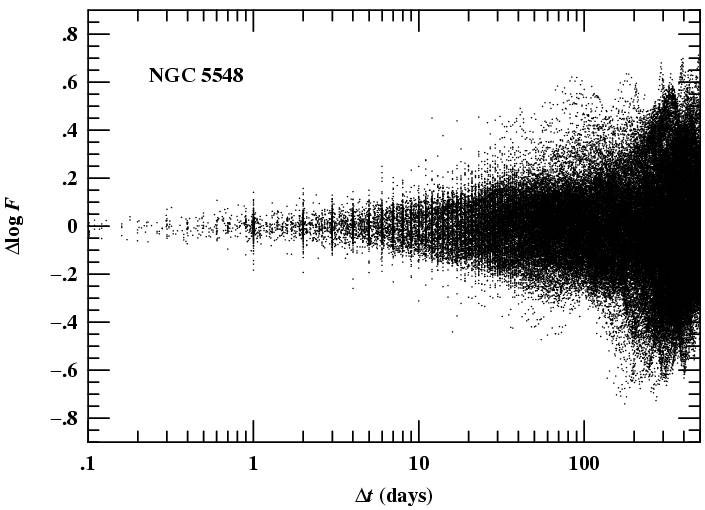
An example is shown in Fig. 2. We compare
each flux measurement at an arbitrary time ti
with the flux at every later time tj. The quantity
we show is the flux ratio as a function of
the time interval between observations
 t =
tj - ti, i.e.,
log F = log
F(tj) / F(ti), where
in each case the contaminating flux due to starlight
in the host galaxy (as shown in Fig. 1)
has been first
removed. Fig. 2 shows that NGC 5548 shows little
variability on time scales shorter than a few days,
but on time scales of several weeks or months, very
large variations can be observed. We note in passing
that the quantity shown here is closely related to
the "structure function".
The structure function is simply the mean absolute
value of 2.5 log
F(t), i.e., the
mean difference in magnitudes between observations
separated by times t.
t =
tj - ti, i.e.,
log F = log
F(tj) / F(ti), where
in each case the contaminating flux due to starlight
in the host galaxy (as shown in Fig. 1)
has been first
removed. Fig. 2 shows that NGC 5548 shows little
variability on time scales shorter than a few days,
but on time scales of several weeks or months, very
large variations can be observed. We note in passing
that the quantity shown here is closely related to
the "structure function".
The structure function is simply the mean absolute
value of 2.5 log
F(t), i.e., the
mean difference in magnitudes between observations
separated by times t.

|
Figure 1. Optical (5100 Å) light curve of NGC 5548 from late 1988 to late 1996. The horizontal line indicates the constant contribution from starlight through the standard aperture used, which projects to 5" × 7".5. From Peterson et al. 71 © 1999 AAS. |
|
Figure 2. Difference in optical flux as a
function of interval between observations
|
| (2) |
where the quantities are (a) the mean flux for all N observations,

| (3) |
(b) the variance of the flux (as observed),
| (4) |
and (c) the mean square uncertainty of the fluxes

| (5) |
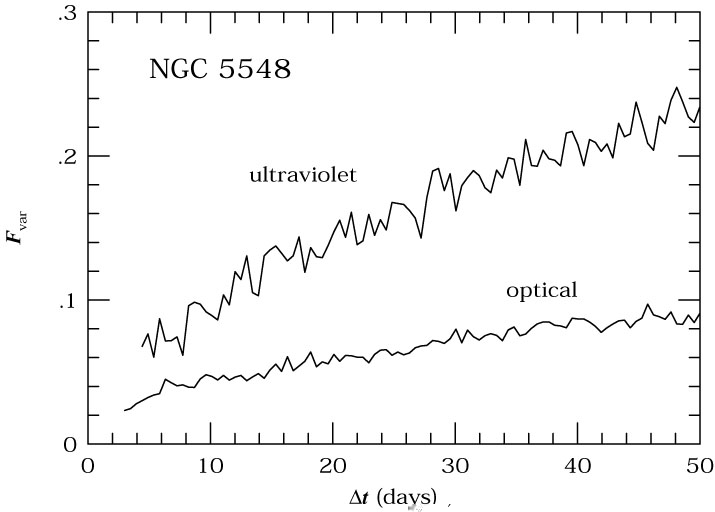
Even if the continuum is constant, there will still be apparent flux variations simply due to measurement uncertainties (noise); the virtue of Fvar is that it adjusts the fractional variation downwards to account for the effect of random errors. The parameter Fvar is thus sometimes referred to as the "excess variance." In Fig. 3, we show Fvar as a function of time interval UV and optical variations in NGC 5548. This shows that UV continuum variations are typically around 10-20% on time scales of about a month. The fractional variations in the optical are less pronounced, at least in part because of contamination of the fluxes by a large constant contribution from starlight in the host galaxy.
|
Figure 3. Variability parameter Fvar from ultraviolet and optical continuum measurements of NGC 5548, as a function of interval between observations; the optical data used are those shown in Fig. 1. Courtesy of S. Collier. |
X-Ray Variability. Rapid X-ray variability is a hallmark of AGNs (for a review, see Mushotzky et al. 54). It is of historical importance since it effectively eliminates alternatives to supermassive black holes, e.g., massive stars or starbursts, as competing explanations for the high luminosities of AGNs. X-rays are expected to arise near the event horizon of the black hole, so the shortest time-scale X-ray variability is expected on a few times the crossing time
| (6) |
Prior to the 1990s and the advent of RXTE, the best X-ray monitoring data was from EXOSAT, which was in a high-Earth orbit that allowed up to 80 hours of uninterrupted observations. The EXOSAT "long-looks" at variable AGNs established that variability is most rapid in low-luminosity systems.
A useful way to characterize variability is in terms of the "power density spectrum" (PDS), which is the product of the Fourier transform of the light curve and its complex conjugate. The PDS for AGNs is often parameterized as a power law,

| (7) |
The EXOSAT data
52 showed that
AGN X-ray variations can be characterized by PDS indices in
the range 1 
 2 over time scales of
hours to months. The total power in the
variations is given by integrating the PDS over all frequencies.
Thus, the PDS must turn over at low frequencies
(i.e., as defined above
must become less than unity)
to prevent divergence in the total power. Such breaks in the
PDS are observed in stellar-mass X-ray sources, and the
turnover frequency correlates inversely with mass, though
the fundamental reason for this is not understood.
The basic idea is that the mass
of the black hole can be inferred, since
MBH
2 over time scales of
hours to months. The total power in the
variations is given by integrating the PDS over all frequencies.
Thus, the PDS must turn over at low frequencies
(i.e., as defined above
must become less than unity)
to prevent divergence in the total power. Such breaks in the
PDS are observed in stellar-mass X-ray sources, and the
turnover frequency correlates inversely with mass, though
the fundamental reason for this is not understood.
The basic idea is that the mass
of the black hole can be inferred, since
MBH  Rgrav
tcrossing.
If we scale AGNs relative to stellar-mass systems
(which have turnover frequencies f
Rgrav
tcrossing.
If we scale AGNs relative to stellar-mass systems
(which have turnover frequencies f
 0.1 Hz),
we expect that the turnover frequencies for AGNs will occur at
about 10-8 Hz.
In only one case, NGC 3516, has there been a plausible
detection of the turnover frequency. Edelson & Nandra
21
find that for this Seyfert 1 galaxy the turnover frequency
is f 4 ×
10-7 Hz, which corresponds to
a time scale of about one month. The mass inferred, again
scaling relative to stellar-mass systems, is in the range
106-107
M
0.1 Hz),
we expect that the turnover frequencies for AGNs will occur at
about 10-8 Hz.
In only one case, NGC 3516, has there been a plausible
detection of the turnover frequency. Edelson & Nandra
21
find that for this Seyfert 1 galaxy the turnover frequency
is f 4 ×
10-7 Hz, which corresponds to
a time scale of about one month. The mass inferred, again
scaling relative to stellar-mass systems, is in the range
106-107
M .
.
Periodicities in X-ray light curves, which might reflect orbital or precession periods, have been searched for, but never found. As a historical footnote, however, it is worth mentioning that one such detection was claimed 53, namely a 12,000 s period in NGC 6814. However, ROSAT observations revealed that the variable source is in fact a foreground Galactic binary in the same field as the AGN 47.