


The past three decades have witnessed great progress in the modelling of stellar populations. In the next paragraphs I will describe the basic steps that have featured the development of these models to present-day releases, by grouping the literature works into decades. The outstanding developments in each decade are emphasized.
3.1. The 60's: the first color/time evolution
A first example of stellar population model is that of [14]. The authors describe the evolution of the B-V colour of the old open cluster M67. This is accomplished with a rudimental isochrone obtained by best fitting the observed B-V vs. MV diagram, then aged and rejuvenated by 5 Gyr, by applying homology arguments and keeping fixed the RGB tip in the isochrones (cf. their Fig 1). Although stellar evolutionary computations have shown later that isochrones are not homologous, yet the paper is important because it recognizes that the integrated colours of stellar populations because of their sensitivity to age, can be used to date extragalactic systems.
Following the developments of the first wide sets of evolutionary
tracks, [41]
compute the first "galaxy" model. The evolution
of colour indices from U to L is provided, using the empirical
Teff-colour relations by
[21].
Stellar tracks describe only the
upper MS and SGB, the RGB is added empirically as well as the lower
Main Sequence. The basic learnings are: i) stars must be set in
numbers  lifetimes; ii) the post-main sequence evolution is
so fast that mass dispersion is not important (see
Section 3.3).
lifetimes; ii) the post-main sequence evolution is
so fast that mass dispersion is not important (see
Section 3.3).
3.2. The 70's: the Tinsley legacy
The 70's see the full development of B. Tinsley's fundamental work. In a series of papers (e.g. [42], [43]) the evolutionary population synthesis as a method to compute the spectrophotometric properties of galaxies is defined. Analytical approximations are provided for the main parameters., e.g. star formation rates, IMFs, chemical evolution, that are still used in nowadays models. The Tinsley's models are targeted to galaxies, and a wider discussion on them goes beyond the aim of this review. Relevant to our context is the early modeling of near infrared colours ([44]), that made evident the problem of the accuracy of the integration along the RGB. By citing the authors ".. very slight departures from equal spacing in the stellar lifetimes lead to unacceptable irregularities in color because of short-lived but energetically important points".
3.3. The 80's: the fuel consumption theorem
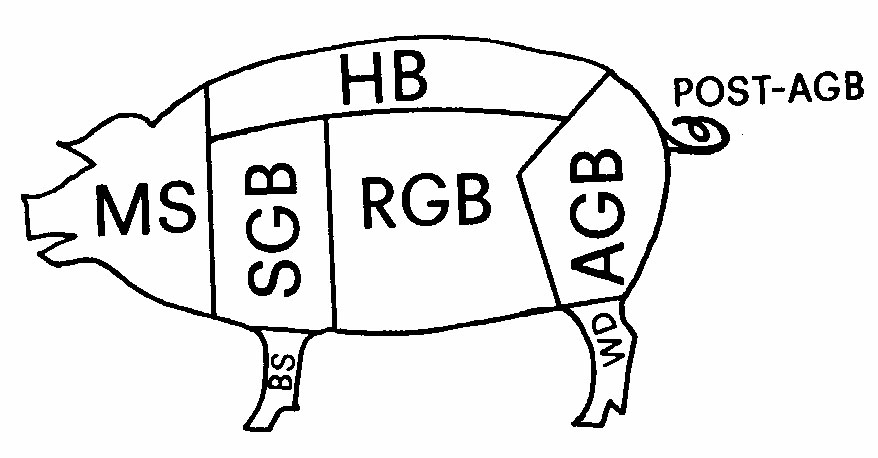
The culmination of the efforts of the 70's is the last work of B. Tinsley ([18]). The authors adopted the first release of the Yale isochrones, to which empirical RGB, AGB and lower-MS were added. The application of these models to ellipticals suggested rather young ages, of the order of a few Gyrs. Indeed, it turned out (see Figure 1 in [33]) that those Yale isochrones had an uncalibrated mixing-length and were found not to be able to reproduce the MS of galactic GCs. The danger at deriving ages and metallicities of unresolved stellar populations with models based on uncalibrated stellar ingredients motivated [33] to re-discuss the concept of stellar population model. First, simple models should be preferred against the more complicated realizations, for these models can be straighforwardly compared to globular clusters. By simple it is meant that all stars are coeval and chemically homogeneous, that is the definition of SSP à la [31]. Second, two conditions should be fulfilled: i) The use of isochrones with calibrated mixing-length. ii) The account of every evolutionary phase with its proper energetic contribution. Indeed in the models of the '70's major evolutionary phases (e.g. HB, AGB, Post-AGB) were not included or their contribution not properly evaluated. The fuel consumption theorem was used to show how much they can contribute. It defines the energy conservation law for the stellar case, and is stated as: The contribution by any Post Main Sequence evolutionary phase to the total luminosity of a simple stellar population is proportional to the amount of nuclear fuel burned in that phase ([31]). The bolometric budget of a SSP as a function of age, computed with the fuel consumption theorem is shown in Figure 3. The bolometric modeling of [32] is extended to the monochromatic by [7]. These models span a wide metallicity range, consider all stellar evolutionary phases and take into account various morphologies of the Horizontal Branch. However these models are computed only for old ages. [25] extends the fuel consumption approach to a wider age range (Section 3.6).
 |
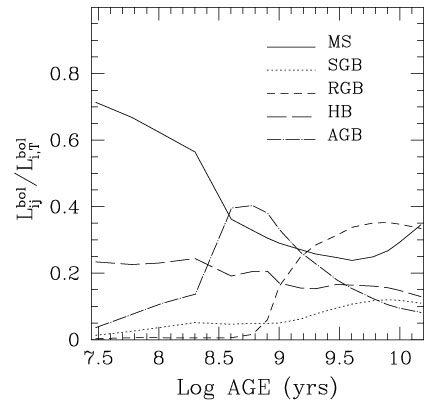 |
Figure 3. An art view of the bolometric budget of a stellar population (left; from [33]) and its quantitative evaluation (right; from [25]). Evolutionary phases are labelled as in Figure 1. |
Worth noting in the same decade are the first stellar population models aimed at describing the redshift evolution of galaxies ([5]).
3.4. The 90's: isochrone synthesis
The technique called isochrone synthesis is by far the most popular method to compute EPS models, due to its straightforwardness of definition (see Section 2.3). The isochrone synthesis boosted with the works of Bruzual & Charlot (but see also [13]). Early implementations of the method by [5] suffered from erratic color jumps due to poor interpolation algorythms, which were later refined ([11] and [6]). Also different from the past is the use of a nearly homogeneous set of stellar ingredients, and the semi-empirical inclusion of the TP-AGB phase (see Section 3.6). Although only for solar metallicity, these models span a wide age range including for the first time very young (t < 1 Gyr) ages. A wider metallicity range has been provided by successive releases. These works have defined a standard technique for most models in the literature, which are constructed by applying isochrone synthesis to the isochrones released by the Geneva or by the Padova group (e.g. [38], [23], latest Worthey models, latest Vazdekis models).
3.5. The 90's: the Lick indices
Parallel to the diffusion of the isochrone synthesis, the 90's see the
full development of the so-called comprehensive models, the
feature of which is to provide the largest number of model output,
e.g. broad-band colours, spectral energy distributions, mass-to-light
ratios, spectral indices, surface brightness fluctuations, for the
largest number of model parameters (metallicities, ages, IMFs,
etc.). The most complete of these models for the study of old
stellar populations are the models by
[49].
With these a modern quantification of the age/metallicity degeneracy
(e.g. [16])
has been made, which is known as the "3/2 rule"
 log t /
log Z ~
3/2. But perhaps the
most important feature of the Worthey's models is to provide as first
the SSP values of the whole set of the absorption line indices in the
Lick system, the so-called Lick indices (Mg2, Fe5270,
H
log t /
log Z ~
3/2. But perhaps the
most important feature of the Worthey's models is to provide as first
the SSP values of the whole set of the absorption line indices in the
Lick system, the so-called Lick indices (Mg2, Fe5270,
H ,
etc.). These are obtained by inserting in the Worthey's EPS code the
fitting functions
([50]),
that provide the stellar index as a function of
Teff, gravity and metallicity, and are
constructed with real stars. Similar fitting functions for the indices
Mg2, Fe5270, Fe5335 and
H are
provided by
[8] and
[9],
with the corresponding SSP models in the framework
of the evolutionary synthesis of
[7].
When coupled with the
same evolutionary synthesis these two sets of fitting functions
produce consistent SSP indices
([28]).
Both fitting
functions by Buzzoni and Worthey do not take element abundance ratios
into account but depend only on total metallicity. However, the
specific abundances of given elements likely affect the absorption
features, and it is known that, e.g. the magnesium-to-iron abundance
ratio in Milky Way stars varies as a function of total metallicity. A
step forward was made by
[4],
whose fitting function for
Mg2 contains the explicit dependence of the Mg abundance
relative to
Fe. However this approach has not been extended to other indices. Only
very recently SSP models of all Lick indices in which the abundances
of the specific elements are a model parameter, have been made
available ([39];
see Section 3.6).
,
etc.). These are obtained by inserting in the Worthey's EPS code the
fitting functions
([50]),
that provide the stellar index as a function of
Teff, gravity and metallicity, and are
constructed with real stars. Similar fitting functions for the indices
Mg2, Fe5270, Fe5335 and
H are
provided by
[8] and
[9],
with the corresponding SSP models in the framework
of the evolutionary synthesis of
[7].
When coupled with the
same evolutionary synthesis these two sets of fitting functions
produce consistent SSP indices
([28]).
Both fitting
functions by Buzzoni and Worthey do not take element abundance ratios
into account but depend only on total metallicity. However, the
specific abundances of given elements likely affect the absorption
features, and it is known that, e.g. the magnesium-to-iron abundance
ratio in Milky Way stars varies as a function of total metallicity. A
step forward was made by
[4],
whose fitting function for
Mg2 contains the explicit dependence of the Mg abundance
relative to
Fe. However this approach has not been extended to other indices. Only
very recently SSP models of all Lick indices in which the abundances
of the specific elements are a model parameter, have been made
available ([39];
see Section 3.6).
3.6. Around the turn of the century
Back to the fuel for TP-AGB
The TP-AGB is perhaps the most critical stellar phase to be accounted
for in a SSP model, because its energetic and extension are affected
by mass-loss and nuclear burning in the envelope, both phenomena
requiring parametrizations to be calibrated with data. However, the
TP-AGB phase is the most important phase in intermediate-age
(0.2 Gyr  t
1 Gyr) stellar
populations, contributing ~ 40% to the bolometric light
([32]).
The fuel consumption approach allows one to include the TP-AGB phase in a
SSP model in a semi-empirical way.
This is done in SSP models in which the TP-AGB phase is calibrated
with data of intermediate-age Magellanic Clouds GCs
([25]).
It is shown there (and in Figure 4) that the
inclusion of this
phase is crucial to match the integrated near-IR colours of these
clusters. The calibrated models of
[25]
have been used to
succesfully reveal the occurrence of AGB dominated GCs in the merger
remnant galaxy NGC 7252
([27];
Figure 5).
t
1 Gyr) stellar
populations, contributing ~ 40% to the bolometric light
([32]).
The fuel consumption approach allows one to include the TP-AGB phase in a
SSP model in a semi-empirical way.
This is done in SSP models in which the TP-AGB phase is calibrated
with data of intermediate-age Magellanic Clouds GCs
([25]).
It is shown there (and in Figure 4) that the
inclusion of this
phase is crucial to match the integrated near-IR colours of these
clusters. The calibrated models of
[25]
have been used to
succesfully reveal the occurrence of AGB dominated GCs in the merger
remnant galaxy NGC 7252
([27];
Figure 5).
 |
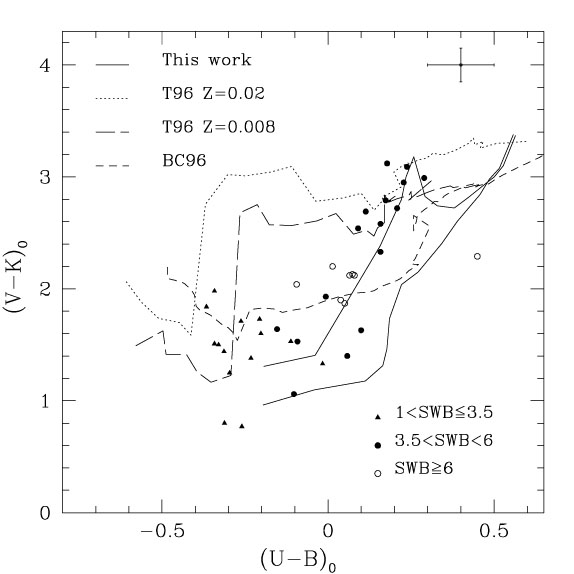 |
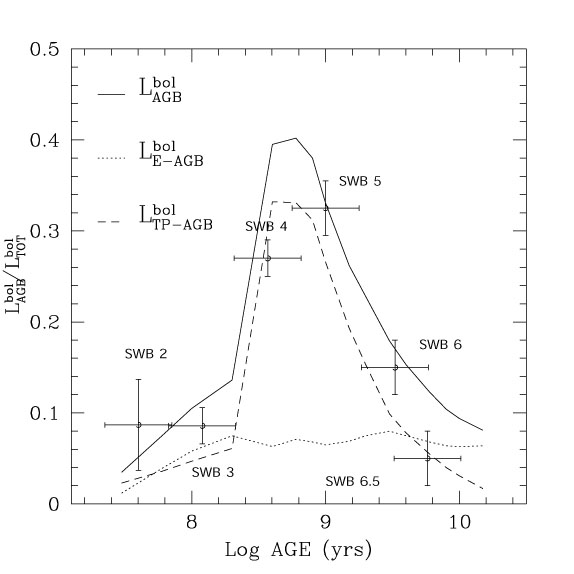
Figure 4. Left-hand panel. Calibration of the bolometric contribution of the TP-AGB phase for SSP models as a function of the SSP age, with Magellanic Clouds GCs data. Right-hand panel. Calibration of the SSP broad-band colours V-K vs. U-B (solid thick line) with the same data. The filled circles are intermediate-age GCs. The solid thin line shows the same SSPs but without the TP-AGB phase. The other line styles show SSPs from other authors. From [25]. |
It is also shown that SSP models using uncalibrated stellar tracks for the TP-AGB fail to reproduce the Magellanic Clouds GCs colours. As mentioned in Section 3.4, the TP-AGB phase is included semi-empirically also by [11], and the AGB bolometric contribution is calibrated with Magellanic Clouds GCs, like in Figure 4. However, the SSP integrated colours (dashed line in Figure 3) do not exhibit the required "jump" in V-K displayed by these GCs. This might be due to the fact that in their models the contribution by the sole TP-AGB never exceeds ~ 10% (Figure 10 in [11]), at variance with Figure 4.
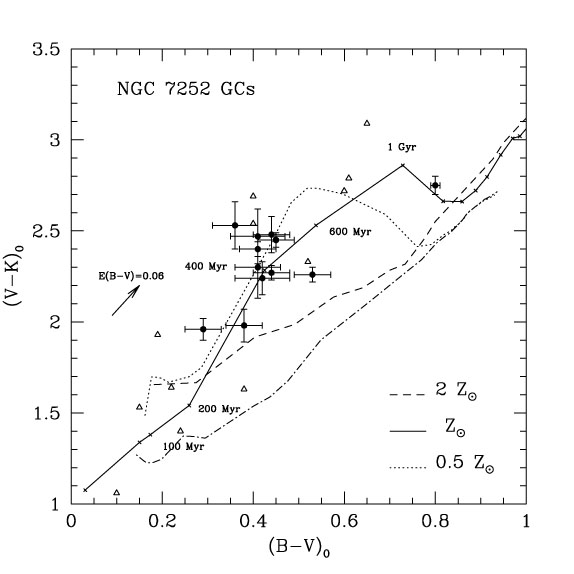 |
Figure 5. Detection of AGB-dominated GCs in an external galaxy. Same diagram as in Figure 4 for the GCs of the merger remnant galaxy NGC 7252 (filled symbols). From [27]. |
The influence of nebular continua. The SED of very young stellar populations located in starforming regions may be affected by emission from gas. This is what the models of the Starburst99 group ([23]) try to account for. Specifically designed for active starforming regions, these models include also emission lines from interstellar components. The TP-AGB phase is not included in these models, that are therefore appropriate for ages smaller than ~ 100 Myr.
High-resolution SSPs [46] presents high spectral resolution (1.8 Å) SEDs of old SSPs. These are obtained by using empirical stellar libraries instead of the Kurucz model atmospheres. The advantage is that the observed spectra can be directly compared with the models without degrading their resolution. However, the presently very limited empirical libraries permit to model only a rather narrow range in ages and metallcities.
Model Lick indices for non solar chemistries
The ratio of  -elements
to Fe-peak elements
([ / Fe]) is a key
diagnostic for the formation timescales of the stellar populations in
galaxies (e.g. [40]).
However, the standard model Lick indices
(Section 3.5) are inadequate to study stellar
populations with
[ / Fe]
-elements
to Fe-peak elements
([ / Fe]) is a key
diagnostic for the formation timescales of the stellar populations in
galaxies (e.g. [40]).
However, the standard model Lick indices
(Section 3.5) are inadequate to study stellar
populations with
[ / Fe]
 0.
This is demonstrated by the calibration of these type of models up to
Z
0.
This is demonstrated by the calibration of these type of models up to
Z ([28]),
accomplished with the metal-rich (Z ~
Z) and
[ / Fe] = 0.3 GCs
NGC 6528 and NGC 6553 of the galactic Bulge
(Figure 6,
[28]).
The model comparison with
galactic GCs with lower metallicities shows that the standard models
reflect non solar
[ / Fe] at
subsolar metallicities. This variable
[ / Fe] of the
standard models results from the calibrating stars used to
compute the fitting functions
([28]).
To derive the
abundances of unresolved extra-galactic stellar populations it is
desirable to have models with well-defined values of element abundance
ratios. [39]
provide such new generation models, that
for the first time are given as functions of element abundances
(e.g. the
[ / Fe] ratio)
and for various values of
[ / Fe],
[ / Ca],
[ / N],
etc. To establish their adequacy, these models for
[ / Fe] = 0.3 are
calibrated with GCs (thick lines in Figure 6).
([28]),
accomplished with the metal-rich (Z ~
Z) and
[ / Fe] = 0.3 GCs
NGC 6528 and NGC 6553 of the galactic Bulge
(Figure 6,
[28]).
The model comparison with
galactic GCs with lower metallicities shows that the standard models
reflect non solar
[ / Fe] at
subsolar metallicities. This variable
[ / Fe] of the
standard models results from the calibrating stars used to
compute the fitting functions
([28]).
To derive the
abundances of unresolved extra-galactic stellar populations it is
desirable to have models with well-defined values of element abundance
ratios. [39]
provide such new generation models, that
for the first time are given as functions of element abundances
(e.g. the
[ / Fe] ratio)
and for various values of
[ / Fe],
[ / Ca],
[ / N],
etc. To establish their adequacy, these models for
[ / Fe] = 0.3 are
calibrated with GCs (thick lines in Figure 6).
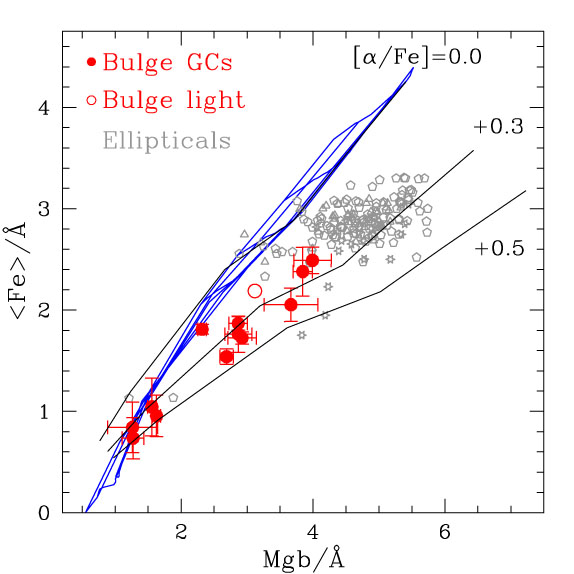 |
Figure 6. From
[28].
Calibration of standard model Lick
indices (grid) with GCs including Bulge objects (filled large symbols,
from [30]).
The three thick lines show the models by
[39]
with a constant age of 12 Gyr and three values of the
[ |
Horizontal Branch morphology and age confusion
The morphology of the HB impacts on Balmer lines and broad band
colours. We focus here on Balmer lines, since they are widely used as
age indicators for GCs. The degeneracy age-HB morphology arises from
the fact that the blue HBs of metal-poor GCs enhance their integrated
H values,
that become larger than those of coeval GCs with red HBs.
The bluer HBs at decreasing metallicity are due to, as a first
parameter, hotter stars at lower metallicity. As a second parameter to
the mass-loss along the RGB, which by removing stellar envelope,
shifts the Teff of the stars to higher
values. Therefore the Balmer
lines of coeval stellar populations increase with decreasing
metallicity, which undermines their power as age indicators
([26]).
As mentioned in Section 2.2, the
assumed mass loss in SSP models must be calibrated a posteriori.
[26]
calibrate the mass-loss required to reproduce the
H line
observed in galactic GCs as a
function of metallicity. An updated version of that calibration, which
extends to higher-order Balmer lines with the aid of new data is shown
in Figure 7 (from
[28]).
The age ambiguity induced
by the HB morphology is nicely illustrated by the four GCs at
[Z / H] ~ -0.6.
Two of them (NGC 6441 and NGC 6338) have blue HB stars,
which are responsible for their rather large
H's ( ~ 2
Å). Note that if this effect is not accounted for, these two GCs
would appear considerably younger ( ~ 8 Gyr) than those with same
[Z / H] that lie on the 15 Gyr old SSP, in spite of the very similar ages
derived from their MS turnoff.
 |
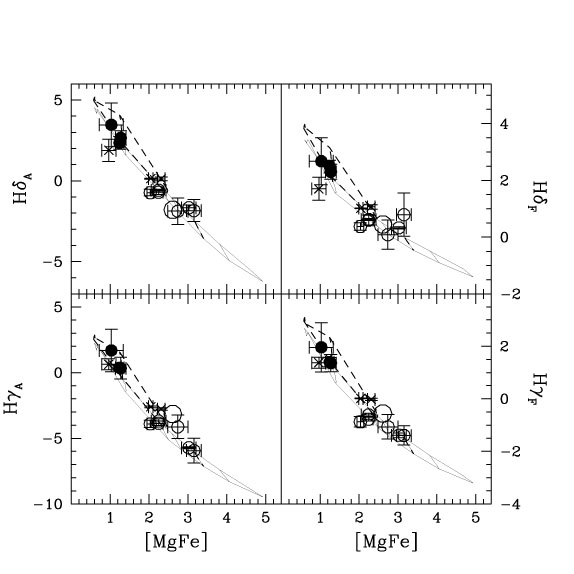 |
Figure 7. Calibration of Balmer lines
vs. HB morphology with galactic GCs, from
[28].
Left-hand panel:
H |
 A,
H
A,
H A,
H
A,
H