


In order to obtain integrated photometry of the galaxies in our sample
we edited the final, flux-calibrated images of the Atlas. Field stars
and background galaxies falling near the position of our galaxies were
removed using the IRAF task CREDIT within the CRUTIL
package. We
did this for all the B and R-band images. Emission from field
stars and from background galaxies in the
H images was removed at
the time of the H
continuum subtraction.
images was removed at
the time of the H
continuum subtraction.
The criteria for identifying a region as belonging to the galaxy
(or not) were those used by
Gil de Paz et al. (2000b).
Briefly, these criteria are based (1) on the size and ellipticity of the
emitting region compared to the image PSF, (2) the presence of
H emission associated
with the region, and (3) the distance of
the region from the galaxy center (see
Gil de Paz et al. 2000b
for more details).
Once all the images were edited we defined two sets of polygonal
apertures. The first set was constructed to include the total
integrated light originating from the galaxy at continuum wavelengths,
and it was identically used to measure both the B and R-band
integrated magnitudes. Due to the different spatial distribution and
morphology of the H
emission compared with the continuum, the
integrated H fluxes were
measured using different sets of
polygonal apertures. In both cases, the integrated fluxes were
obtained using the IRAF task POLYPHOT.
The color term required to determine the B and R-band magnitudes of the galaxies was first computed assuming a mean (B - R) color of 0.8mag and using the color coefficients given in Table 4. However, the integrated colors derived were in some cases significantly different from this average value. The final magnitudes and colors were then iteratively computed using the limit of the following sequence as the best (B - R) color for the galaxy,
 |
(2) |
where kB, B-R and kR, B-R are the
color coefficients for the
B and R bands, respectively. This sequence ranges from
i = 1 to
n, where (B - R)0 = 0.8 mag and (B -
R)1 is the integrated color
initially measured on the images. Convergence
( (B -
R) << 0.01)
occurred after a few (n ~ 5-10) iterations. The final magnitudes
and colors are given in Table 5. The
errors shown
in this table were obtained by combining the photometry errors given by the
task POLYPHOT with those associated with the calibration
of the images. Fluxes, magnitudes and colors shown are corrected for
Galactic extinction (using the values given in
Table 1 and the
Galactic extinction law of
Cardelli, Clayton, &
Mathis 1989),
but they are not corrected for internal extinction.
H fluxes given in
Table 5 are also corrected for
underlying stellar absorption adopting an equivalent width of -3Å
(González-Delgado,
Leitherer, & Heckman 1999).
(B -
R) << 0.01)
occurred after a few (n ~ 5-10) iterations. The final magnitudes
and colors are given in Table 5. The
errors shown
in this table were obtained by combining the photometry errors given by the
task POLYPHOT with those associated with the calibration
of the images. Fluxes, magnitudes and colors shown are corrected for
Galactic extinction (using the values given in
Table 1 and the
Galactic extinction law of
Cardelli, Clayton, &
Mathis 1989),
but they are not corrected for internal extinction.
H fluxes given in
Table 5 are also corrected for
underlying stellar absorption adopting an equivalent width of -3Å
(González-Delgado,
Leitherer, & Heckman 1999).
We have compared our integrated magnitudes measured with the asymptotic values given by Doublier et al. (1997, 1999) and Cairós et al. (2001b) and the BT and RT magnitudes in the RC3 and ESO-LV catalogs (BT, de Vaucouleurs et al. 1991; BT, RT; Lauberts & Valentijn 1989). The mean difference between the B-band magnitudes given by Cairós et al. (2001b) and ours for a total of 14 galaxies in common is +0.06 mag with an rms of ± 0.22 mag (our magnitudes are marginally brighter). The comparison between the total B-band magnitudes in the RC3 catalogue and our observed magnitudes gave a difference of -0.04 ± 0.19 mag (44 galaxies in common). The largest B-band difference (+0.36 ± 0.34 mag) is obtained when comparing with the results for 23 galaxies in common with Doublier et al. (1997, 1999). For the R-band data the differences are -0.22 ± 0.20 mag (11 galaxies) and -0.15 ± 0.36 mag (26 galaxies) with respect to the Cairós et al. (2001b) and Doublier et al. (1997, 1999) samples, respectively. This systematic difference is reduced to -0.05 ± 0.16 mag (9 galaxies) when comparison is made with the R-band magnitudes in the ESO-LV catalogue. Note that the comparison with the RC3 and ESO-LV catalogs was done using observed magnitudes (i.e. not corrected for Galactic extinction). Finally, we compared the aperture-photometry data of Cairós et al. (2001a) with our results. This yields differences of +0.16 ± 0.18 mag (14 galaxies) and -0.10 ± 0.23 mag (11 galaxies) in the B and R bands, respectively. The existence of these differences is attributed to (1) intrinsic differences between the extrapolated asymptotic magnitudes and our aperture-photometry data, (2) the different galactic-extinction maps used (Burstein & Heiles 1984 or Schelegel et al. 1998), and (3) the different methods adopted for the removal of field stars and background galaxies falling near the position of the galaxies under study.
Absolute magnitudes and H
luminosities were derived using the
distances given in Table 1. We
computed the equivalent
widths of H by dividing
the H flux by the flux
(per unit wavelength) in the R-band after taking into account the
added contribution of H
to the observed R-band magnitude itself
(see Appendix A for more details).
In Figures 4a & 4b
we show the frequency
histograms in (B - R) color and B-band absolute
magnitude. Average
color and absolute magnitude of the galaxies in our sample are
(B - R) = 0.7 ± 0.3 mag and MB = -16.1
± 1.4 mag. The average
H luminosity is
log(LH) =
40.0 ± 0.6
(erg s-1). In Panels 4c,
4d,
4e, and 4f we have
plotted, respectively, (B - R)
vs. MB, EW(H)
vs. MB,
LH vs.
MB, and EW(H)
vs. (B - R), using different symbols for
each morphological type (dots, nE; filled-stars, iE; open-squares, iI;
open-circles, i0).
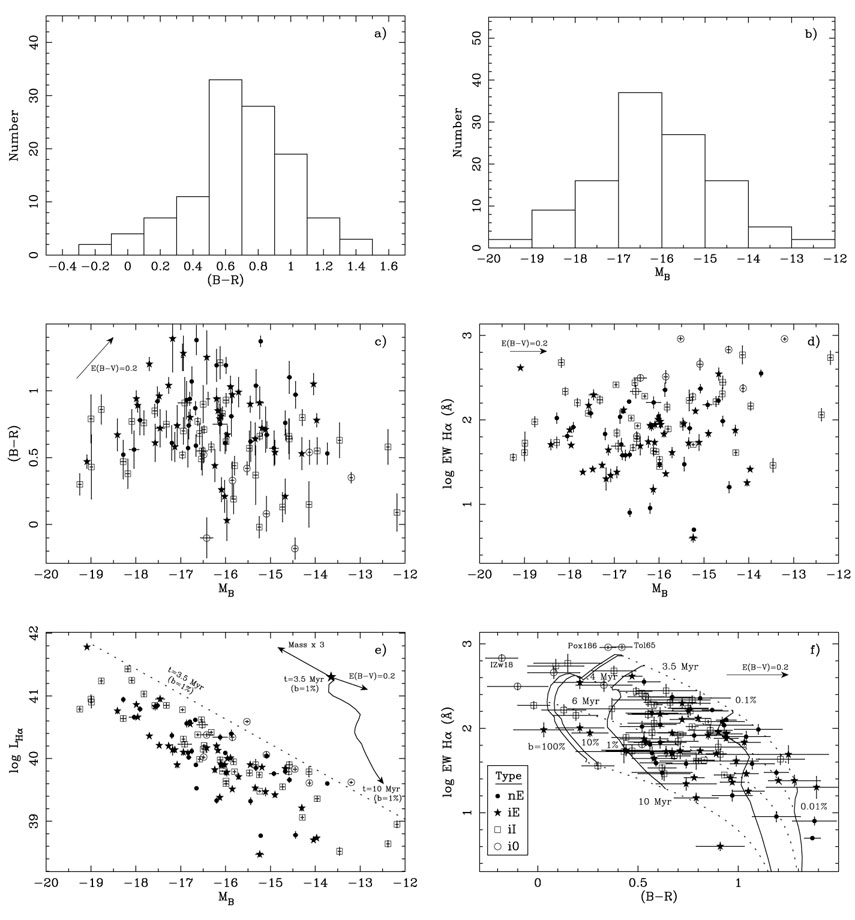 |
Figure 4. a)
Frequency histogram of the (B - R)
color. b) Frequency histogram of the
absolute magnitude, MB. c)
Color vs. MB diagram. Different symbols are used
for nE, iE, iI, and i0 BCDs (see legend in Panel f). The effect of a
color excess of E(B - V) = 0.2 mag is shown by
arrows. d)
EW(H |
Figure 4c shows that fainter BCD galaxies tend
to have bluer colors. Also the galaxies classified as iI and i0 BCD show, on
average, bluer colors than those in the nE and iE classes. This same
difference is also present in the case of the
EW(H) (see
Figure 4d), where iI and i0 BCDs show
significantly larger
equivalent widths. The average colors and equivalent widths of the nE
and iE BCDs are (B - V) = 0.8 mag and
EW(H) = 90Å,
respectively, while for the iI and i0 BCDs these values are
(B - V) = 0.5 mag and
EW(H) = 200Å. If we
consider only the galaxies classified as iI BCDs the average colors and
EW(H)
values derived are 0.6 mag and 150Å, respectively. Moreover,
Figure 4c also shows that for (B -
R) < 0.5 about 27% (6
over 22) of the galaxies are nE/iE types while for (B - R)
> 0.95 this
percentage goes up to 95% (18/19). With regard to the equivalent
width of H,
Figure 4d indicates that for
logEW(H) > 2.4 about
23% (3/13) are nE/iE BCDs while for
logEW(H) < 1.2 the
percentage is 100% (14/14). The lack of
objects showing both low continuum and
H luminosity
(lower-right corner of Figure 4d) is mainly due
to the
selection effects associated with the objective-prism surveys
searching for emission-line galaxies from whose many galaxies in our
sample were selected. In these surveys the probability of detection is
mainly driven by the emission-line flux and its contrast against the
continuum (Salzer 1989).
Therefore, objects with low luminosity will
be detected only if the contrast between the line and the continuum
is very strong, in other words, if the equivalent width is large
( > 20Å typically).
The dotted-line in Figure 4e represents the model
predictions for a composite stellar population formed by a 3.5-Myr-old
burst with Z /
5 metallicity and 1% burst strength in mass
superimposed on a 9-Gyr-old underlying stellar population with the
same metallicity. The independent effects of a change in the age of
the burst, the internal extinction and total mass of the galaxy are
also shown. These models were extensively described in
Section 3.
/
5 metallicity and 1% burst strength in mass
superimposed on a 9-Gyr-old underlying stellar population with the
same metallicity. The independent effects of a change in the age of
the burst, the internal extinction and total mass of the galaxy are
also shown. These models were extensively described in
Section 3.
Finally, in Figure 4f we show the distribution
of our galaxies in the EW(H)
vs. (B - R) color diagram along with
the predictions of the same models for different values of the burst
age and burst strength, ranging from 3.5 to 10 Myr and from 0.01 to
100%, respectively. This figure shows that in most of the BCDs in our
sample ( ~ 80%) the presence of an evolved, underlying stellar
population is required, even if a moderate internal extinction of
E(B - V) = 0.2 mag is assumed and differences in
metallicity between
individual galaxies are taken into account. This value of the color
excess corresponds to the most frequently found value in the
spectroscopic atlas of BCDs of
Terlevich et al. (1991).
The most metal-poor objects in our sample, however, do not appear to
require an evolved stellar population to reproduce their (B -
R) colors and
EW(H). But, the
(B - R) color is not very sensitive to the
presence of an evolved stellar population when the burst strength is
larger than a few percent, so the existence in these galaxies of such
an evolved population cannot be ruled out by these data. The
combination of optical data and deep near-infrared observations is
crucial in solving this problem
(James 1994;
Doublier et al. 2001b,
Vanzi et al. 2002;
Noeske et al. 2003, submitted).
Figure 4f also confirms (see above) that there
is a clear difference between the properties of the nE/iE BCDs (filled
symbols) and those of the iI/i0 BCDs (open symbols). BCD galaxies
classified as nE and iE types are significantly redder and show lower
EWs in H than the iI and
i0 BCDs. This is probably due to (1)
a lower dust extinction, (2) higher burst strength, and/or (3) lower
metallicity of the iI and i0 galaxies compared to the nE and iE
BCDs. Some differences in this same sense have been already pointed out by
Noeske et al. (2000)
for the case of the iI,C (cometary) BCDs.
It is worth noting that, despite the number of surveys involved, different selection criteria, and different physical sizes and environments where these galaxies were discovered, there are observational properties that are common to all BCD galaxies within the same morphological class, although with a significant dispersion. This suggests that the morphology of these galaxies is direct testimony to their merging and star-formation histories.
In order to show the wide range of morphologies and physical sizes
spanned by these galaxies, and its relation to their luminosities and
optical colors, we have plotted together the R-band and
H
maps for 80 of the galaxies in the sample set to a common distance and
using a common surface brightness scale (see
Figures 5 and
6). Due to the dense clustering of galaxies at
certain positions in the color-magnitude diagram (see
Figure 4c)
the representation of the complete sample of 114 objects in
Figures 5 and 6 is not
possible. The R-band
and H images of the
galaxies are shown in boxes of fixed
physical size of 5 kpc on a side using a gray scale ranging from the
sky level (white) to a surface brightness of 21mag/arcsec-2 in
R and 1.5 × 10⁻¹⁵ erg s-1
cm-2 arcsec-2
in H (black) (these
surface brightness are observed values,
except for the highly obscured objects II Zw 40 and IC 10 which were
corrected for Galactic extinction). Figure 6
shows that, as commented on above, the largest
H EWs are found within
those objects showing the lowest luminosities and bluest colors
(bottom-right in this figure). These images also graphically
illustrate that BCD galaxies cover, at least, one order of magnitude
in physical size, from ~ 0.3 kpc to
 3 kpc. A more detailed
analysis of the physical size, structure, and population content of
BCDs will be carried out in subsequent papers.
3 kpc. A more detailed
analysis of the physical size, structure, and population content of
BCDs will be carried out in subsequent papers.
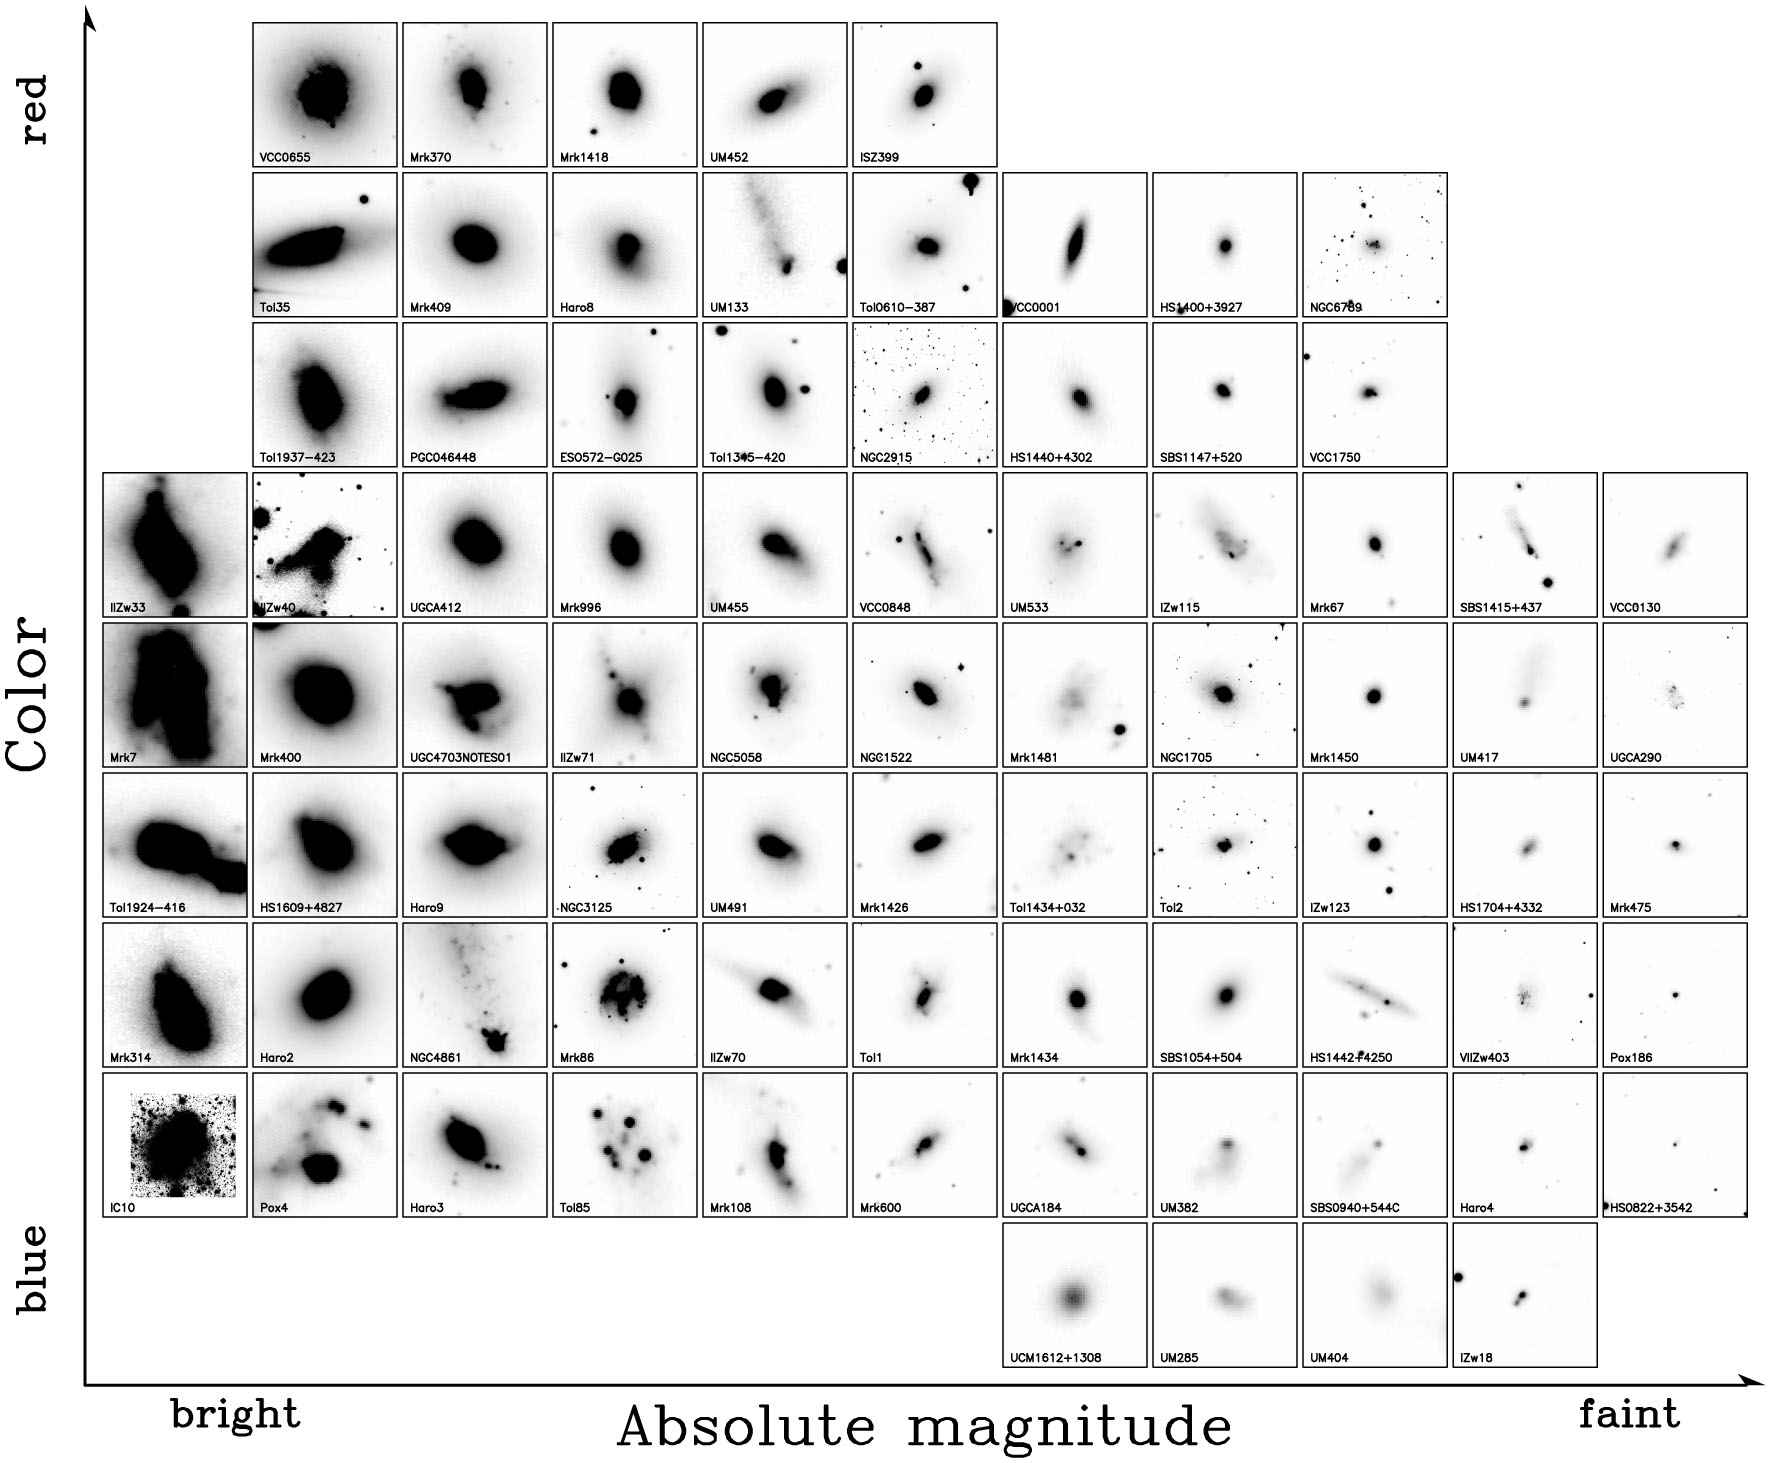 |
Figure 5. R-band images of 80 of the galaxies in the sample. All panels are 5 kpc in size. The grayscale ranges between the value of the sky (white) and that corresponding to a surface brigthness of 21 mag arcsec-2 (black). The name of the galaxy is shown at the bottom-left corner of each panel. |
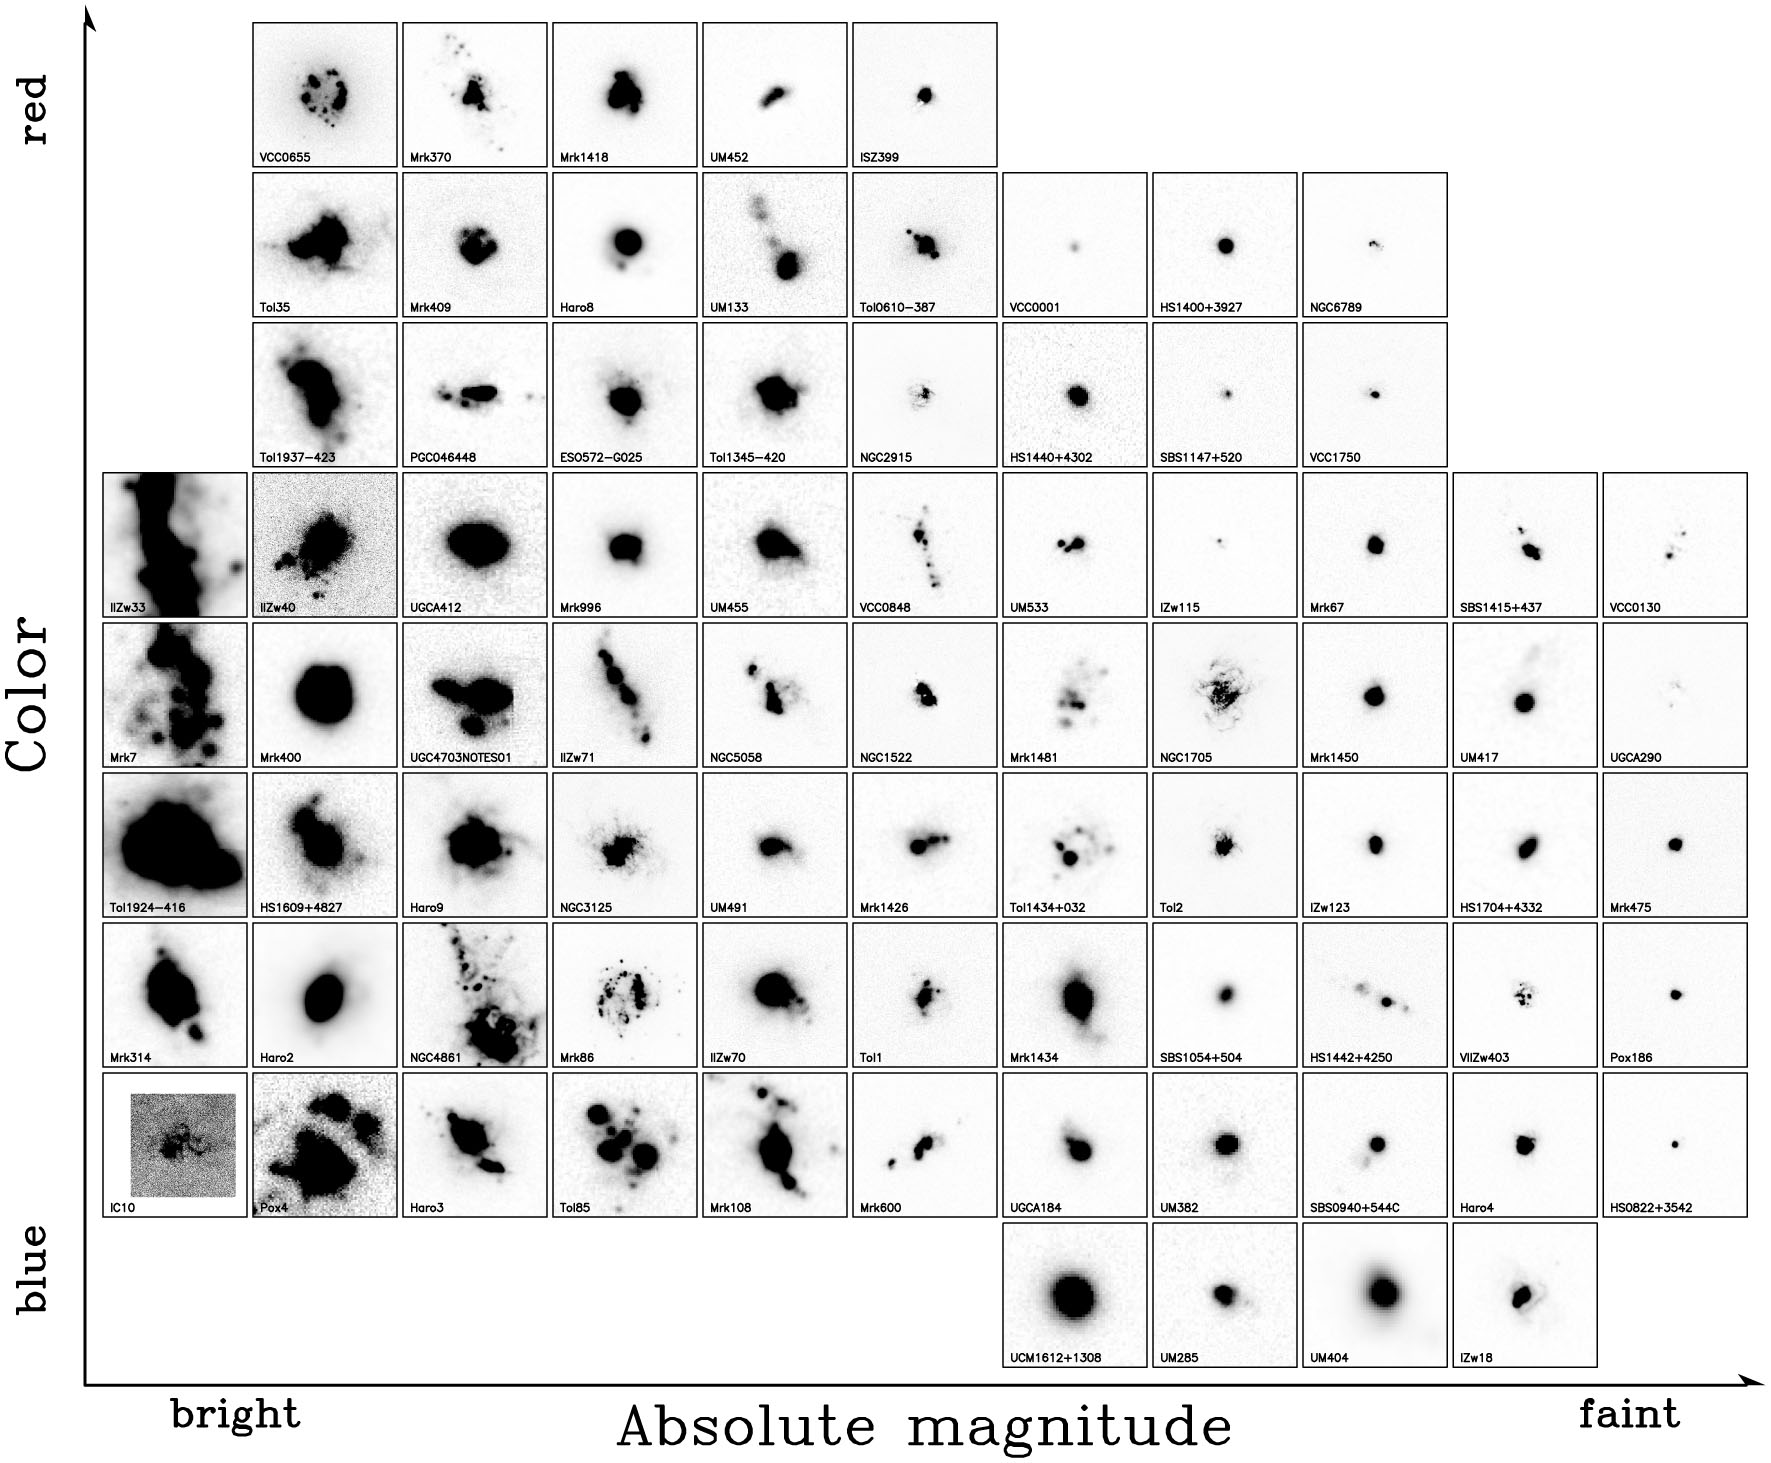 |
Figure 6. Continuum-subtracted
H |