Copyright © 2000 by Annual Reviews. All rights reserved
| Annu. Rev. Astron. Astrophys. 2000. 38: 761-814 Copyright © 2000 by Annual Reviews. All rights reserved |


3.2.3. The [CII] Line as Global Tracer of Star Formation Activity in Galaxies
Observations with the Kuiper Airborne Observatory (KAO), the COBE satellite, and balloons have established that the 158 µm [CII] emission line commonly is the strongest spectral line in the far-IR spectra of galaxies (Crawford et al 1985, Stacey et al 1991, Lord et al 1996, Wright et al 1991, Mochizuki et al 1994). The [CII] line traces photodissociation regions (PDRs) as well as diffuse HI and HII regions. It should be an excellent tracer of the global galactic star formation activity, including that of somewhat lower-mass (A+B) stars (Stacey et al 1991).
A number of studies with ISO's Long Wavelength Spectrometer (LWS) of the [CII] (and [OI]) lines have taken place. Malhotra et al (1997, 1999a), Fischer et al (1996, 1999), Lord et al (1996, 2000), Colbert et al (1999), Helou et al (1999), Braine & Hughes (1999) have observed 70 star-forming galaxies over a wide range of activity level. Smith & Madden (1997), Pierini et al (1999) have studied 21 Virgo cluster galaxies of normal and low star formation activity. Luhman et al (1998, and private communication) and Harvey et al (1999) have observed 14 ultraluminous galaxies. Figure 8a (see color insert) and 8b summarize these results (along with earlier work) and puts them in the context of PDR models. For most normal and moderately active star-forming galaxies, the [CII] line is proportional to total far-IR flux and contains between 0.1 and 1% of the luminosity (Figure 8b; Malhotra et al 1997). In a plot 6 of the ratio of [CII] line flux to integrated far-IR continuum flux (Y[CII]) as a function of the ratio of CO 1-0 line flux to FIR flux (YCO), most extragalactic (and galactic) data are in good overall agreeement with PDR models for hydrogen densities of 103..5 and radiation fields of 102..4 times the solar neighborhood field.
 |
Figure 8A. [CII] observations and PDR models. Ratio of [CII] line intensity to total far-infrared intensity (Y[CII]) as a function of ratio of CO 1-0 line intensity to far-infrared intensity (YCO). KAO observations: star forming galaxies (light blue open circles, Stacey et al 1991, Lord et al 1995, 1996), normal galaxies/outer parts of spirals (filled blue circles, Stacey et al 1991, Madden et al 1993), low metallicity galaxies (pink filled rectangles, Poglitsch et al 1995, Madden et al 1997) and Galactic HII regions/PDRs (green crosses, Stacey et al 1991). LWS ISO observations: US Key Project, normal and star forming galaxies (blue, down-pointing open triangles, Malhotra et al 1997, Lord et al 2000), Virgo galaxies with normal and low activity (black open, up-pointing triangles, Smith & Madden 1997, Pierini et al 1999) and ultra-luminous galaxies (filled red circles, Luhman et al 1998, Luhman 1999). Solar metallicity PDR models for clouds of AV = 10 and nH = 103 (thick blue line), 105 (dashed red) and 107 cm-3 (thin dashed light blue) are from Kaufman et al (1999), with radiation field densities of 10, 103 and 105 times the solar neighborhood field (G0) marked by black, long dashed lines. A model for a AV = 3, Z = 0.1 cloud is given as green dashed curve. |
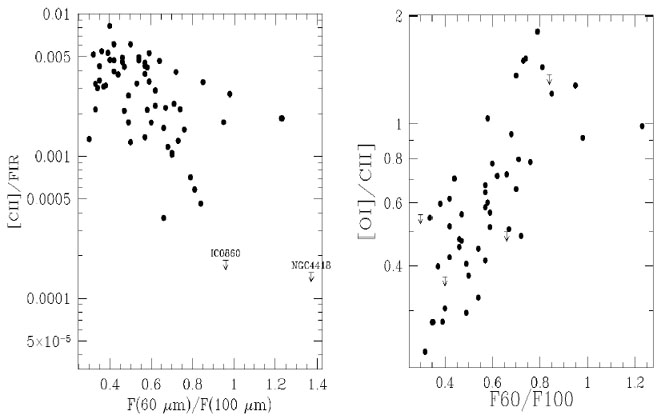 |
Figure 8B. [CII] and [OI] observations. Dependence of Y[CII] on IRAS 60 to 100 µm flux density ratio (~ dust temperature) (from Malhotra et al 1997, 1999a). Right: Line flux ratio of [OI]/[CII] as a function of the IRAS 60 to 100 µm ratio (from Malhotra et al 1999a). |
However, for luminous galactic HII regions and the most active star-forming galaxies, including ULIRGs, the [CII]/FIR ratio plumets to < 0.1%. Malhotra et al (1997, 1999a) found that there is an inverse correlation between Y[CII] and dust temperature, and also between Y[CII] and star formation activity (as measured by the ratio of IR to B-band luminosities; Figure 8b). The [CII] line is faint for the most IR-luminous galaxies (Luhman et al 1998, Fischer et al 1999). In the context of standard PDR models, one major reason for the drop of Y[CII] is probably the lower gas heating efficiency at high radiation fields (Malhotra et al 1997). For the high UV energy densities characteristic of ULIRGs and other active galaxies, the photoelectric heating efficiency is low. This is because the dust grains are highly positively charged, and the UIB molecules (important contributors of the photoelectrons; Bakes and Tielens 1994) are destroyed. As a consequence, the line emissivity of the PDR tracers drops sharply. Another factor may be that in such active galaxies the pressure and gas density of the ISM is significantly greater than in normal galaxies, and the 2P3/2 level of the ground state of C+ is collisionally de-excited. The location of the ULIRGs in Figure 8a (see color insert) can be qualitatively understood if gas densities exceed 105 cm-3. An increase of the 63 µm [OI] / [CII] line ratio with density is, in fact, observed in the US Key Project sample (Figure 8b; Malhotra et al 1999a) but can only account for part of the decrease in Y[CII].
Another important effect is self-absorption in the lines. In the yet more extreme ULIRGs of the Luhman et al sample, both the 63 µm [OI] and the 145 µm [OI] lines are weak (or even in absorption) in Arp 220 (Figure 4) and Mrk 231 (Fischer et al 1997, 1999, Harvey et al 1999). The Sgr B2 star-forming region in the galactic center perhaps comes closest to the conditions in ULIRGs in terms of UV and FIR energy density, high gas density, and large H2 column density. In Sgr B2, both the [CII] and [OI] lines show (partial) self-absorption resulting from intervening cold or subthermally excited gas (Figure 4; Cox et al 1999). The self-absorption model, does not explain the lack of 145 µm [OI] emission in Arp 220 (Luhman et al 1998), as its lower level is 228 K above the ground state and should not be populated in cold or diffuse gas. Fischer et al (1999) proposed that the radiation field in ULIRGs is soft, perhaps as a result of an aging burst. Nakagawa et al (1996) gave the same explanation for the relative weakness of the [CII] emission in the extended galactic center region. However, the moderately strong [NeII] and [SIII] lines (requiring substantial Lyman continuum luminosity) detected in the same sources make this explanation fairly implausible.
Low-metallicity galaxies often exhibit unusually intense [CII] emission,
as compared with the CO mm-emission
(Stacey et al 1991,
Mochizuki et al 1994,
Poglitsch et al 1995,
Madden et al 1997;
but see
Israel et al 1995,
Mochizuki et al
1998).
They lie in the upper left of the Y[CII]-YCO plot
(Figure 8a). Low metallicity by itself
cannot account for this effect, but the
combination of low metallicity with small cloud column densities can
(Poglitsch et al
1995,
Pak et al 1998).
The thin dashed curve in the upper left of
Figure 8a is the model for an
AV = 3, Z = 0.1
Z cloud
(Kaufman et al 1999).
cloud
(Kaufman et al 1999).
In the other extreme of low star-forming activity encountered in the Virgo sample, the [CII]/FIR ratio is also lower than in moderately active galaxies (Smith & Madden 1997, Pierini et al 1999). Again, this is expected in PDR models (Figure 8a) as a result of inefficient heating of the PDRs at low energy density, of a lower ratio of UV to FIR energy density, and of lower gas heating efficiency in a lower density, "HI"-medium (Madden et al 1993, 1997).
In summary, the ISO LWS results generally confirm the predictions of PDR theory (Tielens & Hollenbach 1985, Hollenbach & Tielens 1997, Kaufman et al 1999) and support the interpretation that the [CII] line is a good tool for tracing global star formation in normal and moderately active galaxies. The decrease of the [CII] / FIR ratio in very active galaxies and ULIRGs came as a surprise. In retrospect, some of that should have been expected on the basis of the theoretical predictions. Much hope has been placed on future applications of the [CII] line as a tracer of global star formation at high redshifts. The ISO data cast some doubt that these expectations will be realized for the most luminous objects unless low metallicity helps out.
6 This Y[CII]-YCO plot was first introduced by Wolfire et al (1990) to remove the dependence on the PDR filling factor in the data and allows a direct comparison with models. These models assume that all three tracers come from the same regions, an assumption that is not always fulfilled. Back.