


The starting point for estimating the mass of a stellar or galactic system in dynamcal equilibrium is the time-independent Jeans equation:
 |
(1) |
Here n(r) is the number density of some "tracer" population
(stars, galaxies, etc.),
 (r) is their
mean velocity,
(r) is their
mean velocity,
 (r) is the total
potential, and
(r) is the total
potential, and
 2 is the velocity
dispersion tensor:
2 is the velocity
dispersion tensor:
 |
(2) |
The Jeans equation is a moment (over velocity space) of the
collisionless Boltzmann equation, which describes the "flow" of a set of
particles through phase-space in response to the acceleration induced by
some gravitational potential
(r). Equation (1)
is more useful
than the full Boltzmann equation because the right hand side depends
only on the lowest moments of the phasespace distribution function
f (r, v), which are generally far more accessible to
observation than the
distribution function itself. The Jeans equation is however incomplete
in the sense that the distribution function of a collisionless system is
not uniquely specified by its lowest moments. Thus it is possible to
find solutions to equation (1) which appear reasonable, but are not
consistent with any completely nonnegative phase-space density. (This
fact can sometimes be used to rule out certain potentials
(r); see below.)
Furthermore, reduction of the kinematical data to its lowest moments
(e.g. n(r),
2(r))
can easily conceal the fact that a particular system is
far from equilibrium, and therefore not describable by a
time-independent equation. This point is particularly important given
the recent evidence that many galaxy clusters contain statistically
significant substructure (see review by M. Fitchett in this volume).
Galaxy clusters are generically fairly round and slowly-rotating. Assuming spherical symmetry and setting the mean-motion terms to zero, the Jeans equation becomes
 |
(3) |
Here M(r) is the total mass contained within r, and
r
and t are the
galaxy velocity dispersions along and
tangential to any radius vector. Equation (3) allows us to estimate the
mass distribution in a cluster given knowledge of the three functions
{n(r),
r(r),
t(r)}.
Until recently,
equation (3) was rarely used for this purpose, primarily because of the
difficulty of obtaining a usefully-large sample of galaxy radial
velocities. This is no longer the case; new techniques, such as
multi-object fiber spectrometry, allow one to measure dozens of radial
velocities in a single observing run. There are now several clusters for
which more than 100 radial velocities have been measured, and for the
Coma and Virgo clusters, this number exceeds 300. A more
fundamental
problem with equation (3) arises from the nature of the information
required to evaluate its right hand side. By measuring the radial
velocity of a large sample of galaxies, we can in principle determine
los(R),
the dependence of the line-of-sight velocity
dispersion on (projected) radius from the cluster center. But there is
no way to deconvolve a single function of radius
los(R)
to obtain the two desired functions
{r(r),
t(r)}.
Physically, this indeterminacy reflects the
fact that spatial variations in either velocity anisotropy or cluster
mass-to-light ratio may be responsible for the observed variation of
los with
R.
Given this indeterminacy, there are several possible ways of proceeding,
none completely satisfactory. By far the most common is to make an a
priori assumption about the form of the mass distribution - e.g., that
the matter is distributed like the observed galaxies - and then to
derive a total mass using the virial theorem. If we multiply equation
(3) by 4 r3
and integrate from zero to infinity, the result is
r3
and integrate from zero to infinity, the result is
 |
(4) |
The brackets indicate spatial averages over the observed sample of
galaxies. Writing
d / dr =
GM(r) / r2 =
GM F(r) / r2, where
F(r)
F(r) / r2, where
F(r)  1 is the
mass traction within r, equation (4) becomes
1 is the
mass traction within r, equation (4) becomes
 |
(5) |
Equation (5), which is a form of the virial theorem, relates the total
cluster mass
M
to the velocity dispersion of the observed
sample, and a quantity <r-1F>,
which depends on the (generally unknown) form of the matter
distribution. Note that, by taking the proper moment of the Jeans
equation, we obtained an expression for the total mass that depends only
on the total mean square velocity
<v2> = 3<vlos2>.
It is this lack of dependence on velocity
anisotropy (at least in the context of spherical systems) that makes the
virial theorem so useful. However it is clear from equation (5) that the
inferred total mass will depend strongly on its assumed distribution. If
the mass is distributed like the observed galaxies - in the form of
"heavy halos", for instance - then the appropriate form of equation (5) is
easily shown to be
 |
(6) |
(Limber and Mathews 1960), where rij is the projected distance between any pair of galaxies. An equation similar to (6) was used by Zwicky (1933) to infer the mass of the Coma cluster from a sample of seven galaxies. He found a mass-to-light ratio consistent with the best modern estimates, i.e.
 |
(7) |
(e.g. Kent and Gunn
1982),
where h = H0 in units of 100 km s-1.
Applying this
mass-to-light ratio to the local universe gives a cosmological density
parameter
 0
0
 0.15.
0.15.
If the dark matter has a different distribution than the galaxies-as it
must if, for instance,
0 = 1 -
then the virial theorem is not
very useful. One can easily derive a lower limit on the mass
required to bind a cluster by setting
F(r) = M(r) /
M = 1,
i.e. by putting all of the dark matter at the cluster center. For a
cluster like Coma, this assumption reduces the required mass below
Zwicky's value by a factor of about five. A more reasonable model (at
least in the eyes of most cosmologists) would have a dark matter
distribution that is more extended than the galaxies, in which
case F(r)
is small and the total mass can be arbitrarily large. Thus, although the
virial theorem does not constrain the total mass very well, it does
imply a relation between the total mass and its distribution: the
more centrally concentrated the matter, the less is required to bind the
cluster, and vice versa.
One can reduce (though not eliminate) this indeterminacy by making use
of the additional information contained within the line-of-sight
velocity dispersion profile
los(R) .
For any assumed dark matter potential
(r), there is a
unique set of functions {r2(r),
t2(r)} which
satisfy the Jeans equation (3) and give the correct projected profile
los(R).
But for certain
(r), the derived
r2
or t2
may be negative at some radii,
corresponding to models with negative numbers of galaxies on some
orbits. Such models can be ruled out as unphysical.
Figure 1 illustrates this technique with the
Kent and Gunn (1982)
Coma data, and an assumed potential
 |
(8) |
corresponding to a mass density that falls off as r-2
at large
radii (more slowly than the galaxies). Large values of
r0 - i.e.,
nearly uniform dark matter distributions - require very radial orbits, and
for r0
 5h-1 Mpc, no solution is possible.
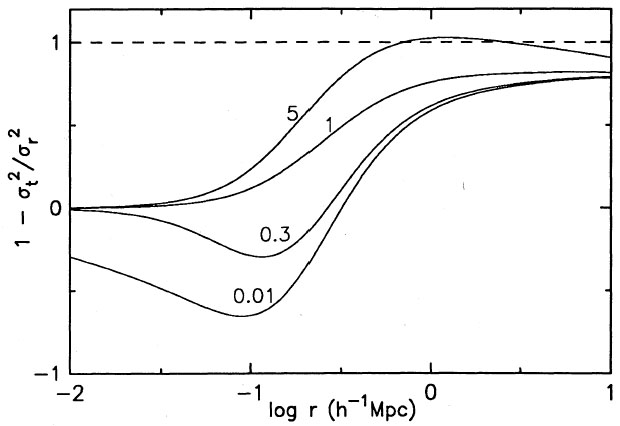 |
Figure 1. Dependence of Coma galaxy velocity anisotropy on radius, assuming the dark-matter potential of eqn. (8). Curves are labelled by the dark-matter core radius r0 in Mpc. Anisotropies greater than unity are unphysical. |
Testing a large number of assumed potentials
(r) in this way gives
approximate upper and lower bounds on the Coma mass-to-light ratio:
 |
(9) |
(The and White 1986;
Merritt 1987).
The low-mass models are perhaps doubly unphysical, in that they require
both a high central concentration of dark matter, as well as galaxy
orbits that are close to circular at large radii
(
1h-1
Mpc). Most theories of the early universe predict that the galaxies
would be, if anything, more clustered than the dark matter. Furthermore,
to the extent that clusters form via gravitational collapse, the galaxy
orbits should be predominantly radial, not circular. However, even
excluding the tangentially anisotropic models, the mass of the Coma cluster is still uncertain by a factor of about
three.
If the number of galaxy radial velocities available in the Coma cluster were much larger - of order 103 or 104 - one could make further progress at constraining its mass by investigating the form of the line-of-sight velocity distribution as a function of projected radius. In effect, this technique would require any model of Coma to be consistent not only with the Jeans equation, but also with the more detailed Boltzmann equation from which the Jeans equation is derived. No one has yet described the best way to carry out this task (nor is there any cluster that is both sufficiently well observed, and convincingly close to equilibrium, to justify such an analysis. In the case of Coma, one way to make use of the extra information contained within the full velocity distribution function is illustrated in Figure 2. The overall velocity histogram appears marginally most consistent with a high-mass, radial-orbit model; a model with low mass and circular orbits appears strongly inconsistent. There are, however, a number of reasons to be cautious about this comparison. The shape of the velocity histogram can be strongly affected by processes such as rotation and infall which we have so far neglected. In fact, inspection of Figure 2 reveals a possibly significant (~ 97% confidence) degree of skewness in the observed distribution. Cluster rotation by itself would tend to broaden the velocity distribution rather than make it skew; furthermore, Coma does not exhibit significant rotation (Rood et al. 1972). However there is good reason to believe that contamination by foreground galaxies might explain the low-velocity "tail". De Lapparent, Geller and Huchra (1986) show that the Coma cluster appears to sit at the intersection of a number of large-scale galaxy "shells", one of which lies nearly along the line of sight to Coma. These foreground galaxies could significantly affect the form of the overall velocity histogram, even if they have little effect on the inferred dynamics of the central regions.
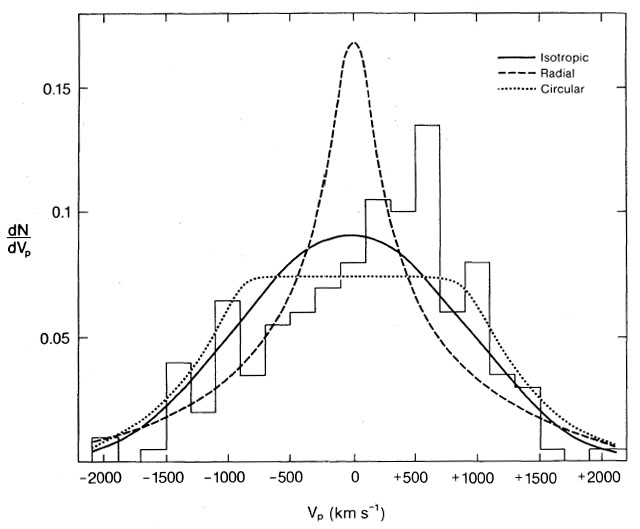 |
Figure 2. Velocity histogram for galaxies in Coma. The three curves are derived from models in which the galaxy orbits are isotropic, radial, and circular; the dark matter distributions have been adjusted to give the same line-of-sight velocity dispersion profile in each case. (From Merritt, Ap. J., 313, 121.) |
A number of other techniques have been discussed for constraining the orbital kinematics of galaxies in clusters. Pryor and Geller (1984) attempted to use the observed tidal radii and gas content of galaxies in Coma to put limits on their orbital pericenters, and hence on the degree of velocity anisotropy. Their result (that the Coma cluster is close to isotropic within 1h-1 Mpc) is strongly dependent on the uncertain physics of tidal truncation and gas dynamcal ablation; furthermore those authors only considered models in which the dark matter is distributed like the galaxies, while in fact the available velocity data imply a fairly tight relation between the mass distribution and the galaxy orbits, as discussed above. O'Dea, Sarazin and Owen (1987) used the orientation of "narrow angle tail" radio sources in clusters to constrain the' distribution of galaxy orbits, under the assumption that the radio-luminous plasma ejected by a moving galaxy is bent into a tail which marks the path taken by the galaxy through the cluster. Since most clusters contain only a few such radio sources (Coma, for instance, contains only one), those authors were forced to superpose data from many clusters. They obtained the surprising result that galaxy orbits in the inner ~ 0.5h-1 Mpc of their clusters are strongly radial; at large radii the distribution of tail orientations appears to be random. The correct interpretation of this result will probably have to await a better understanding of the gas ablation process. It may be, for instance, that the probability of observing a galaxy as a narrow angle tail depends strongly on its velocity with respect to the intracluster gas, in which case the observed sample could be kinematically biased.
For a long time it was hoped that X-ray observations of hot intracluster gas would resolve the indeterminacy of cluster masses. The equation of hydrostatic equilibrium, in spherical symmetry, states
 |
(10) |
where  g
and Tg are the gas density and
temperature. Equation (10) is simpler than the Jeans equation (3) since
gas is a collisional fluid with an isotropic pressure; thus the two
functions
{r(r),
t(r)}
are replaced by one,
Tg(r). Furthermore, the statistical accuracy of
a mass
determination based on the Xray emitting gas can always be increased by
lengthening the integration time, whereas the number of bright galaxies
in a cluster is limited. Unfortunately, the spatial resolution of the
spectral instruments on past X-ray satellites has not been very good,
and at present there is no cluster (with the possible exception of
Virgo) for which we have an accurate determination of
Tg(r). This problem is capable of solution;
future satellites, such as
AXAF, should yield accurate temperature profiles and hence accurate
masses for nearby clusters. However
we have so far learned little about cluster masses from X-ray studies
that we could not have learned from the kinematics of relatively modest
samples of cluster galaxies.
g
and Tg are the gas density and
temperature. Equation (10) is simpler than the Jeans equation (3) since
gas is a collisional fluid with an isotropic pressure; thus the two
functions
{r(r),
t(r)}
are replaced by one,
Tg(r). Furthermore, the statistical accuracy of
a mass
determination based on the Xray emitting gas can always be increased by
lengthening the integration time, whereas the number of bright galaxies
in a cluster is limited. Unfortunately, the spatial resolution of the
spectral instruments on past X-ray satellites has not been very good,
and at present there is no cluster (with the possible exception of
Virgo) for which we have an accurate determination of
Tg(r). This problem is capable of solution;
future satellites, such as
AXAF, should yield accurate temperature profiles and hence accurate
masses for nearby clusters. However
we have so far learned little about cluster masses from X-ray studies
that we could not have learned from the kinematics of relatively modest
samples of cluster galaxies.
This point is made quantitatively in Figure 3,
which presents limits on
the mass distribution of the Coma cluster obtained from the kinematical
technique described above, as well as the limits from the most recent
analysis of the Coma X-ray data
(Hughes 1988).
In the vicinity of ~ 1h-1 Mpc, both techniques give
similar
results for the enclosed mass, with error bars that span about a factor
of two in both cases. Neither technique places interesting constraints
on the central mass density; at large radii, the kinematical mass
determination is superior, because currently available X-ray emissivity
data for Coma do not extend beyond ~ 50 arcmin
1h-1
Mpc.
 |
Figure 3. Constraints on the mass distribution in Coma derived from kinematical and X-ray techniques (h = 1). |