


5.2. The 2dFGRS power spectrum and CDM models
Perhaps the key aim of the 2dFGRS was to perform an accurate
measurement of the 3D clustering power spectrum, in order
to improve on the APM result,
which was deduced by deprojection of angular clustering
(Baugh & Efstathiou
1993,
1994).
The results of this direct estimation of the 3D power
spectrum are shown in figure 5
(Percival et al. 2001).
This power-spectrum estimate uses the FFT-based approach of
Feldman, Kaiser &
Peacock (1994),
and needs to be interpreted with care. Firstly, it is a raw
redshift-space estimate, so that the power beyond
k  0.2 h
Mpc-1 is severely damped
by smearing due to peculiar velocities, as well as being
affected by nonlinear evolution. Finally, the FKP estimator yields the
true power convolved with the window function. This
modifies the power significantly on large scales (roughly
a 20% correction). An approximate correction for
this has been made in figure 5.
0.2 h
Mpc-1 is severely damped
by smearing due to peculiar velocities, as well as being
affected by nonlinear evolution. Finally, the FKP estimator yields the
true power convolved with the window function. This
modifies the power significantly on large scales (roughly
a 20% correction). An approximate correction for
this has been made in figure 5.
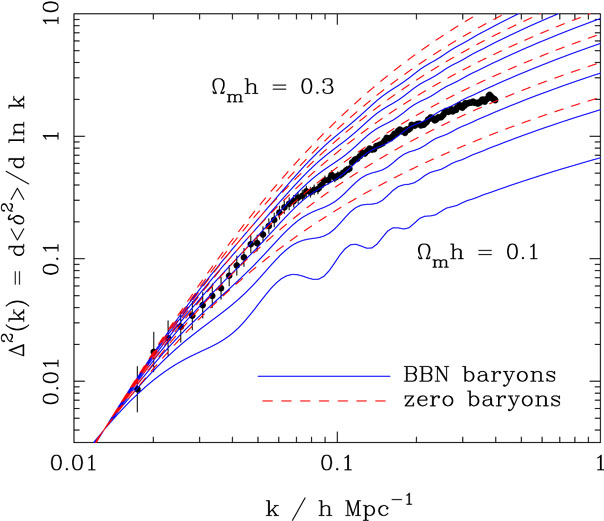 |
Figure 5. The 2dFGRS redshift-space
dimensionless power spectrum,
|
The fundamental assumption is that, on large scales, linear biasing
applies, so that the nonlinear galaxy power spectrum in redshift space
has a shape identical to that of linear theory in real space.
This assumption is valid for
k < 0.15 h Mpc-1;
the detailed justification comes from analyzing realistic
mock data derived from N-body simulations
(Cole et al. 1998).
The free parameters in fitting CDM models are thus the primordial spectral
index, n, the Hubble parameter, h, the total matter
density,  m, and the baryon fraction,
b /
m.
Note that the vacuum energy does not enter. Initially, we
show results assuming n = 1; this assumption is relaxed later.
m, and the baryon fraction,
b /
m.
Note that the vacuum energy does not enter. Initially, we
show results assuming n = 1; this assumption is relaxed later.
An accurate model comparison requires
the full covariance matrix of the data, because
the convolving effect of the window function
causes the power at adjacent k values to be correlated.
This covariance matrix was estimated by applying the survey window to a
library of Gaussian realisations of linear density fields, and
checked against a set of mock catalogues.
It is now possible to explore the space of CDM models, and
likelihood contours in
b /
m versus
mh
are shown in figure 6. At each point in this
surface we have marginalized by integrating the likelihood surface
over the two free parameters, h and the power spectrum
amplitude. We have added a Gaussian prior
h = 0.7± 10%, representing external constraints such as the
HST key project
(Freedman et al. 2001);
this has only a minor effect on the results.
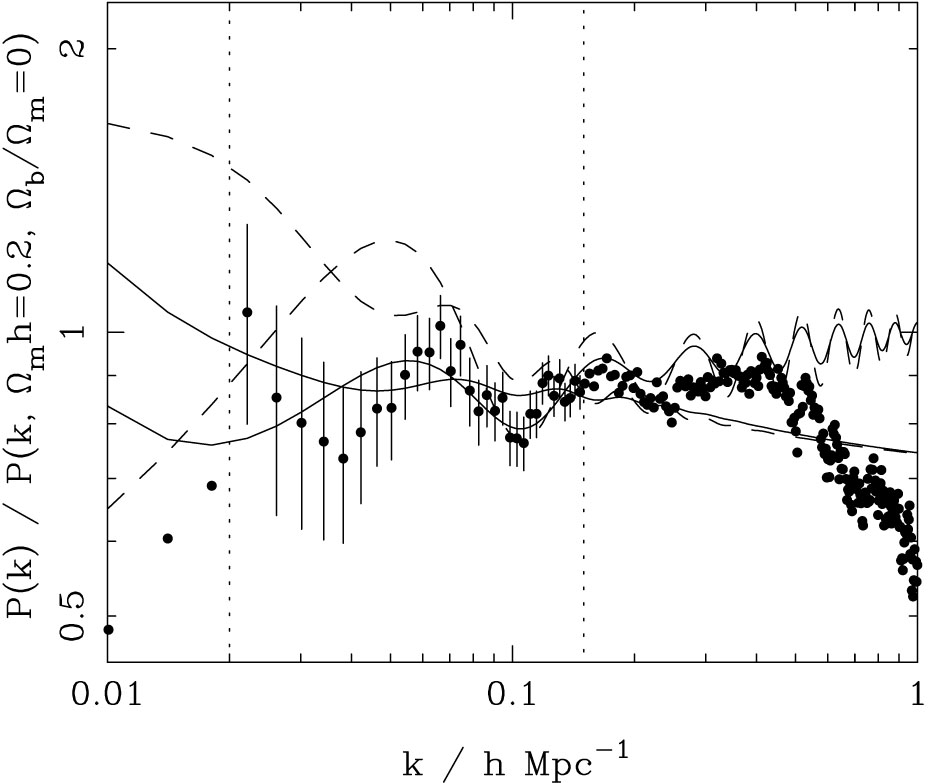 |
Figure 6. Likelihood contours for the
best-fit linear CDM fit to the 2dFGRS power spectrum over the region
0.02 < k < 0.15. Contours are plotted
at the usual positions for one-parameter confidence of 68%, and
two-parameter confidence of 68%, 95% and 99% (i.e.
-2 ln( |
Figure 6 shows that there is a degeneracy between
m
h and the baryonic fraction
b /
m.
However, there are two local maxima in the likelihood, one with
m
h 0.2
and ~ 20% baryons, plus a secondary solution
m
h 0.6
and ~ 40% baryons. The high-density model can be rejected through a variety
of arguments, and the preferred solution is
 |
(95) |
The 2dFGRS data are compared to the best-fit linear power spectra
convolved with the window function in figure 6.
The low-density model fits the overall shape of the spectrum with
relatively small `wiggles', while the solution at
m
h 0.6 provides a
better fit to the bump at
k 0.065 h
Mpc-1, but fits the overall shape less well.
A preliminary analysis of P(k) from the full final dataset
shows that P(k) becomes smoother:
the high-baryon solution becomes disfavoured, and
the uncertainties narrow slightly around the lower-density solution:
m
h = 0.18± 0.02;
b /
m =
0.17± 0.06. The lack of large-amplitude oscillatory features in the
power spectrum is one general reason for believing that the universe is
dominated by collisionless nonbaryonic matter.
In detail, the constraints on the collisional nature of dark matter
are weak, since all we require is that the effective sound speed
for modes of 100-Mpc wavelength is less than about 0.1c.
Nevertheless, if a pure-baryon model is ruled out, the next simplest
alternative would arguably be to introduce a weakly-interacting
relic particle, so there is at least circumstantial evidence
in this direction from the power spectrum.
It is interesting to compare these conclusions with other
constraints. These are shown on figure =, again assuming
h = 0.7± 10%.
Estimates of the Deuterium to Hydrogen ratio in QSO spectra
combined big-bang nucleosynthesis theory predict
b
h2 = 0.020 ± 0.001
(Burles et al. 2001),
which translates to the shown locus of fb vs
m
h. X-ray cluster analysis yields a baryon fraction
b /
m = 0.127
± 0.017
(Evrard 1997)
which is within 1 of our
value. These loci intersect very close to our preferred model.
of our
value. These loci intersect very close to our preferred model.
Perhaps the main point to emphasise here is that the 2dFGRS results are not
greatly sensitive to the assumed tilt of the primordial spectrum.
As discussed below, CMB data show that n = 1 is a very
good approximation; in any case, very substantial tilts (n
0.8)
are required to alter the conclusions significantly.
 2(k),
estimated according to the FKP procedure. The solid points
with error bars show the power estimate. The window
function correlates the results at different k values,
and also distorts the large-scale shape of the power spectrum
An approximate correction for the latter effect has been applied.
The solid and dashed lines show various CDM models, all assuming
n = 1. For the case with non-negligible baryon content,
a big-bang nucleosynthesis value of
2(k),
estimated according to the FKP procedure. The solid points
with error bars show the power estimate. The window
function correlates the results at different k values,
and also distorts the large-scale shape of the power spectrum
An approximate correction for the latter effect has been applied.
The solid and dashed lines show various CDM models, all assuming
n = 1. For the case with non-negligible baryon content,
a big-bang nucleosynthesis value of
 /
/