


6.3. Observations of biased clustering
As indicated above, the first strong indications of biased clustering came from measurements of the correlation function of Abell clusters, which showed a far greater amplitude than for galaxies in general (Klypin & Kopylov 1983; Bahcall & Soneira 1983). Following Kaiser (1984), Cole & Kaiser (1989) etc., our explanation for this is that massive haloes show clustering that is an increasing function of mass. This is illustrated in figure 9, which shows that the rarest and most rich clusters (as measured by the intercluster separation) have the highest clustering, and that the trend is in agreement with the theoretical predictions.
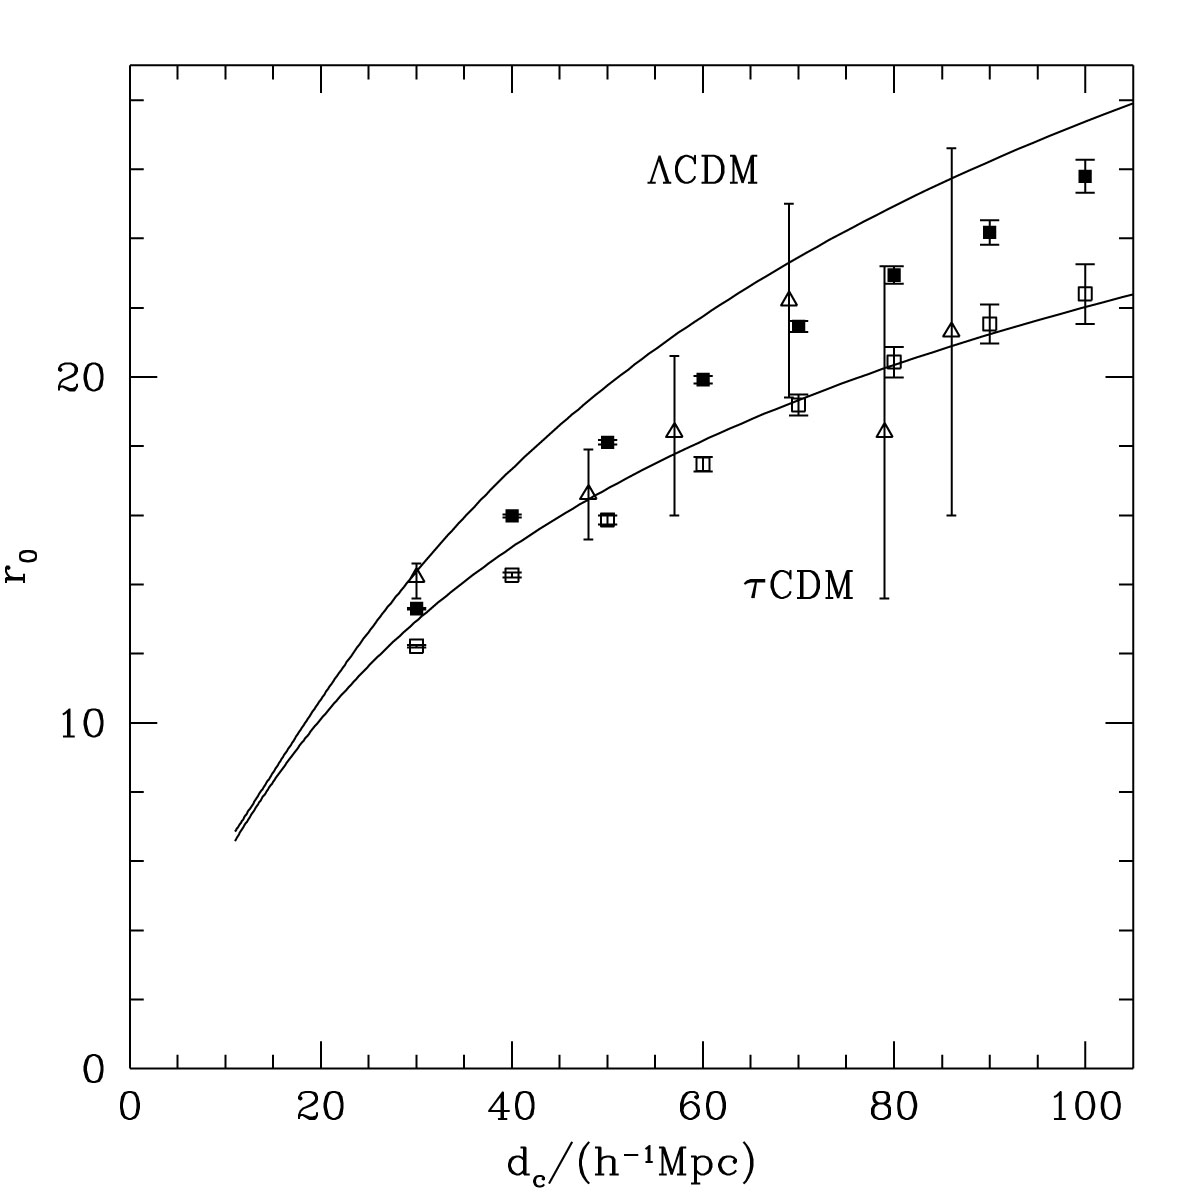 |
Figure 9. The correlation length for
clusters of galaxies, r0,
as a function of mean intercluster separation, dc,
taken from
Colberg et al. (2000).
Results are shown for |
 |
Figure 10. (a) The correlation length in real space as a function of absolute magnitude. The solid line shows the predictions of the semi-analytic model of Benson et al. (2001), computed in a series of overlapping bins, each 0.5 magnitudes wide. The dotted curves show an estimate of the errors on this prediction, including the relevant sample variance for the survey volume. (b) The real space correlation length estimated combining the NGP and SGP (filled circles). The open symbols show a selection of recent data from other studies. |
Because galaxy halo masses are less extreme, it is not so clear a priori that any trend of this sort should be expected for galaxies. However, our empirical knowledge of luminosity functions and morphological segregation did argue for an effect. It has been clear for many years that elliptical galaxies display a higher correlation amplitude than spirals (Davis & Geller 1976), and this makes sense in terms of the preference of ellipticals for cluster environments. Since ellipticals are also more luminous on average than spirals, some trend with luminosity is to be expected, but the challenge is to detect it. For a number of years, the existence of any effect was controversial (e.g. Loveday et al. 1995; Benoist et al. 1996), but Norberg et al. (2001) were able to use the 2dFGRS to demonstrate very clearly that the effect existed, as shown in Figure 10. The results can be described by a linear dependence of effective bias parameter on luminosity:
 |
(111) |
and the scale-length of the real-space correlation function for
L*
galaxies is approximately r0 = 4.8
h-1 Mpc.
Finally, with spectral classifications, it is possible to
measure the dependence of clustering both on luminosity and
on spectral type, to see to what extent morphological
segregation is responsible for this result.
Norberg et al. (2002)
show that, in fact, the principal effect seems to be with luminosity:
 (r)
increases with L for all spectral types.
(r)
increases with L for all spectral types.
Finally, we can look at high-redshift clustering.
At high enough redshift, M* is of order a
galaxy mass and
galaxies could be strongly biased relative to the mass at that time.
Indeed, there is good evidence that this is the case.
Steidel et al. (1997)
have used the Lyman-limit technique
to select galaxies around redshifts
2.5  z
3.5
and found their distribution to be highly inhomogeneous. The apparent
value of
z
3.5
and found their distribution to be highly inhomogeneous. The apparent
value of  8
for these objects is of order unity
(Adelberger et al. 1998),
whereas the present value of
8
8
for these objects is of order unity
(Adelberger et al. 1998),
whereas the present value of
8
 0.8
should have evolved to about 0.26 at these redshifts
(for
0.8
should have evolved to about 0.26 at these redshifts
(for  m =
0.3, k = 0). This suggests a bias parameter of b
4,
or
m =
0.3, k = 0). This suggests a bias parameter of b
4,
or  2.5, which requires a
halo mass of about 1012.1 h-1
M
2.5, which requires a
halo mass of about 1012.1 h-1
M for concordance
  CDM.
The masses of these high-redshift galaxies can be estimated
directly through their stellar masses, which are typically
1010 h-2
M
(Papovich, Dickinson &
Ferguson 2001),
and thus only 1% of what is required in order to explain
the clustering. This is an unreasonably small baryon
fraction, so the correct explanation is more plausibly that
each 1012 h-1
M halo
at z = 3 contains a number of Lyman-break galaxies. This theme is
pursued below.
CDM.
The masses of these high-redshift galaxies can be estimated
directly through their stellar masses, which are typically
1010 h-2
M
(Papovich, Dickinson &
Ferguson 2001),
and thus only 1% of what is required in order to explain
the clustering. This is an unreasonably small baryon
fraction, so the correct explanation is more plausibly that
each 1012 h-1
M halo
at z = 3 contains a number of Lyman-break galaxies. This theme is
pursued below.
 CDM
(open squares) and
CDM
(open squares) and