


Radio sky maps should be very sensitive to fluctuations in the sky
density of sources for the reasons given in
Section 15.1. Radio sources
appear to cluster about galaxies
at least as much as galaxies cluster with galaxies
(Longair and Seldner
1979),
so radio source clustering in space should reflect large-scale
inhomogeneities in the distribution of galaxies in space. However, the
faint radio sources in any area of sky are spread along a line of sight
almost cz / H0
 3000 Mpc in
length, reducing the angular sensitivity to clustering in space by
averaging over many clusters in the line
of sight. Consequently, existing radio surveys are sensitive only to
clustering on very
large scales (d > 100 Mpc) at cosmological redshifts (z
1), in contrast to
optical
(Bahcall and Burgett 1986,
de Lapparent et al. 1986)
and far-infrared
(Meiksin and Davis 1986,
Rowan-Robinson et
al. 1986)
surveys that probe nearby (z
0)
clustering on scales up to d
100 Mpc.
3000 Mpc in
length, reducing the angular sensitivity to clustering in space by
averaging over many clusters in the line
of sight. Consequently, existing radio surveys are sensitive only to
clustering on very
large scales (d > 100 Mpc) at cosmological redshifts (z
1), in contrast to
optical
(Bahcall and Burgett 1986,
de Lapparent et al. 1986)
and far-infrared
(Meiksin and Davis 1986,
Rowan-Robinson et
al. 1986)
surveys that probe nearby (z
0)
clustering on scales up to d
100 Mpc.
Several different techniques have been used to search for fluctuations
in the sky densities of radio sources. One is plotting the distribution
of angular distances to
the nearest neighbors of all sources in a survey and comparing this
distribution with the expected random distribution
(Maslowski et al. 1973).
The nearest-neighbor test is sensitive to clustering only in the small
range of angular scales between the survey
resolution and the typical separation between sources. Another simple
procedure is to group the sources by position on the sky, flux-density
range, etc. and compare
their numbers with the expected Poisson distributions
(Machalski 1977).
A variation of this test for confusion-limited surveys is to divide the
mapped region into small
areas and compare the widths W of the P(D)
distributions in each
(Hughes and Longair 1967).
Then the effective number of sources sampled equals the number of
beam areas in the whole map, potentially quite a large number. The
distribution of
widths W from the 480 squares, each covering 2° × 2°
91 independent beam
areas, from the Green Bank 1.4-GHz sky map overlapping the north
galactic pole
(Condon and Broderick
1985)
is shown as a histogram in Figure 15.16. It is
indistinguishable from the distribution expected in the absence of
clustering (filled circles). Such grouping tests are most sensitive to
clustering on the grouping scale
chosen, so they must be repeated on a variety of scales. But they can
easily be applied to surveys with irregular boundaries. More powerful
tests for clustering of discrete sources are power spectrum analysis
(Webster 1976a,
b)
based on the Fourier
transform of a map with the sources replaced by
 -functions, and
its Fourier-transform relative, correlation function analysis
(Masson 1979).
A significant advantage of correlation function analysis is that
confusion anticorrelation affects only the smallest correlation lags but
essentially all Fourier components of the fluctuation power spectrum.
-functions, and
its Fourier-transform relative, correlation function analysis
(Masson 1979).
A significant advantage of correlation function analysis is that
confusion anticorrelation affects only the smallest correlation lags but
essentially all Fourier components of the fluctuation power spectrum.
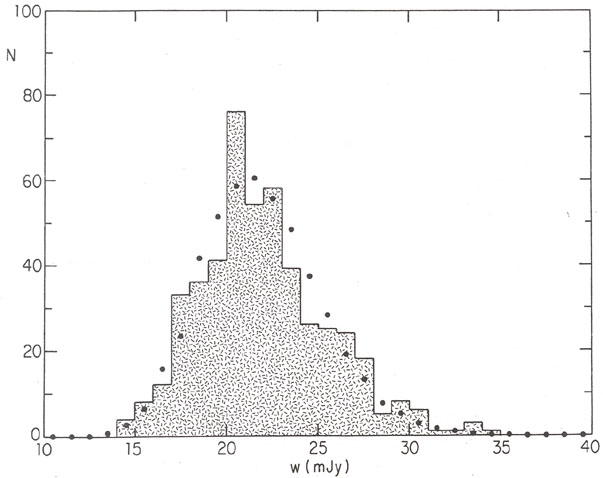 |
Figure 15.16. The observed widths W of the P(D) distributions in 480 2° × 2° squares (histogram) and the expected width distribution (filled circles) if sources are not clustered. Abscissa: width (mJy). Ordinate: number of maps. |
No convincing detection of anisotropy in the sky distribution of
extragalactic radio sources has been made. The upper limits obtained are
strong enough to rule
out the "local hole" interpretation of the drop in the weighted source
counts at high flux densities, but they do not yet strongly constrain
clustering on scales
d < 100 Mpc. This limitation is primarily statistical - the
source density is too low in large-scale surveys. There are (very
approximately)
N [cz /
(H0 d )]3
 / 3 clusters
of comoving size d in the cone of solid angle
. Only if the
number n of sources in
this solid angle is much greater than N can the statistical
fluctuations be smaller than those caused by clustering. For
P(D) analysis of confusion-limited surveys,
n
/
b, where
b is the beam
area; and clustering on scales d >>
(b /
3)1/3(c z / H0)
might be seen. The Green Bank 1.4-GHz sky map
(Condon and Broderick
1985)
has b
10-5 sr
and so reaches d >> 50
Mpc. Confusion-limited surveys with only
moderately higher resolution may detect clustering on scales already
known to exist in optical and infrared samples.
/ 3 clusters
of comoving size d in the cone of solid angle
. Only if the
number n of sources in
this solid angle is much greater than N can the statistical
fluctuations be smaller than those caused by clustering. For
P(D) analysis of confusion-limited surveys,
n
/
b, where
b is the beam
area; and clustering on scales d >>
(b /
3)1/3(c z / H0)
might be seen. The Green Bank 1.4-GHz sky map
(Condon and Broderick
1985)
has b
10-5 sr
and so reaches d >> 50
Mpc. Confusion-limited surveys with only
moderately higher resolution may detect clustering on scales already
known to exist in optical and infrared samples.
Finally, it should be noted that the speed v of the Earth relative to
the extragalactic source frame produces a dipole anisotropy of amplitude
[2 + ( - 1)(1 +
 )] / (v / c)
in the differential count
n(S)
)] / (v / c)
in the differential count
n(S)  S- of sources with
spectral index
(Ellis and Baldwin 1984).
This effect is just below current limits of detectability, requiring
surveys covering
N 2 ×
105 beam areas with high gain accuracy.
S- of sources with
spectral index
(Ellis and Baldwin 1984).
This effect is just below current limits of detectability, requiring
surveys covering
N 2 ×
105 beam areas with high gain accuracy.