


3.2. Lyman Edges
The accretion disks of AGNs are thought to include thermally radiating regions with temperatures in the range 30,000-300,000 K. A fundamental signature of thermal gas is that the emitted spectrum should show spectral features that are associated with large changes in opacity of the gas. At the expected temperatures and densities of an accretion disk, neutral hydrogen ionizes, and there is a large change in the opacity of the gas. The ionization of hydrogen should give rise to spectral features at the Lyman limit (912 Å). The SED in the Lyman limit region can therefore be used as an important diagnostic of accretion disk characteristics. The exact nature of the Lyman edge feature, which will be discussed in Section 4.2, depends on the viewing angle of the disk, the conditions in the disk atmosphere (e.g., vertical structure of the disk, atomic level populations), the conditions in the accretion system (e.g., the accretion rate, black hole mass), and general relativistic effects.
Since the strength and shape of the Lyman limit feature are diagnostics of the properties of the gas, observational studies have concentrated on quantifying the nature of the spectral feature at the Lyman limit. The Lyman edge region for AGNs has now been investigated at high (Antonucci, Kinney, & Ford 1989), intermediate (Koratkar, Kinney, & Bohlin 1992), and low (Kriss et al. 1996; Kriss et al. 1997; Zheng et al. 1995) redshifts. Figure 7 shows the variety of continuum distributions seen in the Lyman limit region. Of the 73 AGNs investigated in these studies, only eight candidate objects were found that might have an intrinsic Lyman edge that may be associated with an accretion disk. In these candidate "partial" Lyman edge objects, there is no sharp discontinuity in the continuum at the Lyman limit but usually just a change in continuum slope on either side of 912 Å (see Fig. 7). In objects in which a sharp Lyman absorption edge is present, nearly 25% of objects investigated, the feature can clearly be associated with intervening absorbing material such as broad emission line clouds in the AGN or gas in the AGN host galaxy. Two (Sun, Malkan, & Chang 1993 and Tytler & Davis 1993) seemingly contradictory results concerning the statistics of Lyman edges in HST data have been reported. A uniform detailed analysis needs to be conducted. Analyses so far conclude that intrinsic Lyman edge features that can be associated with accretion disk features are rare in AGNs, and more importantly there has been no reported case of a Lyman edge feature in emission.
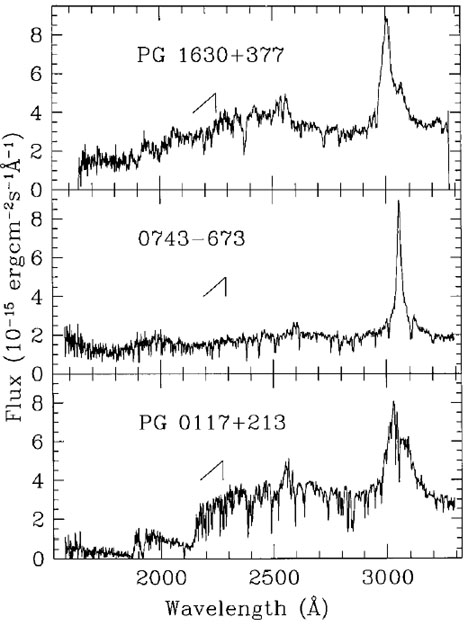 |
Figure 7. Spectral energy distribution in the Lyman limit region. The spectrum of PG 1630+377 (top panel) is an example with a possible intrinsic Lyman edge. The Lyman limit in this object shows no sharp discontinuity like that seen in PG 0117+213 (bottom panel) but does show a change in slope on either side of the Lyman limit. The spectrum of 0743-673 (middle panel) is an example in which we see no Lyman edge. The spectrum of PG 0117+213 (bottom panel) shows sharp Lyman edges at ~ 850 Å and ~ 750 Å owing to intervening absorbing material. The location of the intrinsic Lyman limit is indicated by the arrows in each panel. |
On a statistical basis, one could use the UV composite spectrum (Zheng et al. 1997) to determine the nature of the Lyman edge. In this spectrum the edge is seen only as a 10% effect (see Fig. 8). This may be indicating that many AGNs have a very weak Lyman edge feature. But given the fact that intrinsic Lyman forest lines and reddening can have a dramatic effect on the correction for the SED in this region, the 10% effect cannot be used effectively to quantify the nature of the spectral feature at the Lyman limit.
 |
Figure 8. Spectral energy distribution in
the Lyman limit region for the UV composite generated from
HST/FOS data. The dotted line represents the continuum fit using
the entire HST composite. The
|
To investigate the Lyman edge in AGNs, the observational studies have
been over a limited wavelength region in both low-redshift and
high-redshift objects. Since the accretion disk is in the black hole
environment, the Lyman edge is expected to be broadened by disk rotation
and by general relativistic effects (owing to the extreme depth of the
local potential). Testing the theoretical models would ideally involve
high signal-to-noise ratio observations over a wavelength range ~ 450 to
~ 1200 Å in the AGN rest frame. This is observationally extremely
difficult because complete access to this region at low redshifts is
limited by Galactic hydrogen opacity, and at high redshifts by the
intervening intergalactic medium! The detection of z > 2 QSOs
in the Hamburg quasar survey, which are not only bright but also have a
clear line of sight, are ideal to investigate the Lyman limit
region. Five of these objects have HST/FOS spectroscopy in the ~
300 to ~ 1000 Å wavelength range. There does not seem to be any
evidence of a Lyman edge feature in these objects after the spectra have
been dereddened, corrected for the individual Lyman limit systems and
cumulative H I continuum absorption of
Ly clouds with low
column densities. Once again, if we use the Zheng et al. UV composite,
the Lyman edge feature is quite narrow (~ 5%) and is thus not likely to
be from a disk. With the Far-Ultraviolet Spectroscopic Explorer
(FUSE) coming on-line, we will have opportunity to investigate
the ~ 450 to ~ 1200 Å region in the AGN rest frame for a larger
sample of objects.
clouds with low
column densities. Once again, if we use the Zheng et al. UV composite,
the Lyman edge feature is quite narrow (~ 5%) and is thus not likely to
be from a disk. With the Far-Ultraviolet Spectroscopic Explorer
(FUSE) coming on-line, we will have opportunity to investigate
the ~ 450 to ~ 1200 Å region in the AGN rest frame for a larger
sample of objects.
 2 values for
each bin relative to the continuum
fit are shown in the bottom panel. The ~ 10% trough seen shortward of
the Lyman limit may be indicating that many AGNs have a very weak Lyman
edge feature. But given the observational caveats discussed in
2 values for
each bin relative to the continuum
fit are shown in the bottom panel. The ~ 10% trough seen shortward of
the Lyman limit may be indicating that many AGNs have a very weak Lyman
edge feature. But given the observational caveats discussed in